

- Environmental degradation is the deterioration of the environment through the depletion of resources such as air, water and soil, the destruction of ecosystems and habitats, the extinction of wildlife and pollution.
- In its broadest sense it is any change or disturbance to the environment perceived to be deleterious or undesirable.
- It is a systemic problem, not a sectoral one: damage to one resource spills into others, and each kind of damage can turn into a cause of further damage.
- Today it is usually framed as the triple planetary crisis of climate change, biodiversity loss and pollution. All three draw on the same human drivers.
- The geographer’s interest lies in its spatial pattern: where the pressure comes from, where the damage lands, and why poor regions and poor people bear more of it than they cause.
Meaning and Types of Environmental Degradation

Definitions and nature
- The UN disaster-risk terminology defines environmental degradation as “the reduction of the capacity of the environment to meet social and ecological objectives and needs.”
- The emphasis is on lost capacity: a degraded forest, aquifer or soil can no longer deliver the goods and services it once did.
- The UN High-level Panel on Threats, Challenges and Change (2004) grouped the world’s major threats into six clusters. It placed environmental degradation, along with poverty and infectious disease, among the economic and social threats to collective security.
- Two forms of degradation are recognised:
- Structural degradation: the whole composition or form of a resource changes, as when a forest is cleared or farmland is eroded into ravines.
- Compositional degradation: the resource remains but its constituents are altered, as when air or water is polluted.
- The two interact in feedback loops: deforestation (structural) raises silt and nutrient loads in rivers (compositional), which in turn degrade fisheries and wetlands.
Natural and human drivers
- Degradation has both natural and anthropogenic (human-induced) drivers.
- Natural events such as floods, droughts, volcanic eruptions, cyclones and wildfires cause sharp but usually local and recoverable change.
- Human activities such as urbanisation, industrialisation, deforestation, population pressure and agricultural mismanagement now dominate.
- In the pre-industrial era, nature’s restorative capacity could absorb most disturbances. The modern problem is the pace and scale of human pressure, which has outstripped that self-restoring capacity.
- The concept of homeostasis and resilience explains why: an ecosystem recovers only while a disturbance stays within its tolerance.
Degradation, pollution and ecological imbalance
| Term | What it means | Example |
|---|---|---|
| Environmental degradation | Loss of the environment’s capacity to meet ecological and social needs | Degraded forests, eroded soils, depleted aquifers |
| Pollution | Addition of harmful substances or energy beyond what the environment can absorb | Sewage in the Yamuna, PM2.5 over Delhi |
| Resource depletion | Use of a resource faster than it renews | Groundwater mining in Punjab |
| Ecological imbalance | Disturbed relations between the components of an ecosystem | Loss of predators, invasive species, algal blooms |
- Pollution is one pathway of degradation, not a synonym for it: a polluted river is degraded, but so is a dammed, sand-mined or dried-up one.
The global scale of degradation
- Land: up to 40% of the world’s land is degraded, and at least 100 million ha of healthy land was lost each year between 2015 and 2019.
- Forests: global deforestation has slowed but continues at about 10.9 million ha a year (2015–2025), down from 17.6 million ha a year in the 1990s.
- Biodiversity: monitored wildlife populations have declined by an average of 73% since 1970, and about one million species face extinction.
- Climate: the 2011–2020 decade was about 1.1°C warmer than 1850–1900, and 2024 was the first calendar year above 1.5°C.
- Overshoot: humanity uses nature about 1.7 times faster than ecosystems can regenerate; Earth Overshoot Day fell on 30 July in 2026.
Types of environmental degradation
- Degradation shows up in every sphere of the environment, and the types are interlinked: degradation of one resource cascades into others.
1. Land degradation
- Land degradation is a deterioration in the quality of land that significantly reduces its productive capacity: in the quantity and quality of goods and services it yields.
- Human drivers: deforestation, intensive farming, river damming, industrialisation, mining, and roads, highways and settlements.
- Natural drivers: droughts, floods, landslides and earthquakes.
- The first world assessment of human-induced soil degradation mapped about 1,964 million ha of damaged land, by cause:
| Cause | Extent (approx.) | Share | Typical impact |
|---|---|---|---|
| Overgrazing | 680 million ha | 35% | Compaction; loss of palatable vegetation |
| Deforestation | 580 million ha | 30% | Erosion; loss of carbon sinks |
| Agricultural mismanagement | 550 million ha | 28% | Salinisation, waterlogging, chemical contamination |
| Over-exploitation for fuelwood | 135 million ha | 7% | Loss of woody biomass and cover |
| Industry and urbanisation | 20 million ha | 1% | Largely irreversible loss of farmland |
- Erosion strips about 24 billion tonnes of fertile soil from the world’s land each year.
- India loses an estimated 5.3 billion tonnes of soil a year, about 16.4 t/ha, against soil formation rates of well under 1 t/ha a year, which makes soil erosion effectively irreversible on a human timescale.
2. Degradation of water resources
- Water demand has grown so fast that extraction exceeds replenishment across much of the world.
- Rivers, lakes, estuaries, seas and aquifers face intensive agriculture, unplanned urbanisation, industrialisation and deforestation at once.
- Siltation, a product of accelerated soil erosion, reduces the carrying capacity of rivers and reservoirs, so floods worsen year after year even without heavier rain.
- Main polluting pathways:
- agricultural runoff carrying fertilisers and pesticides;
- untreated sewage and industrial effluents;
- leaching of agrochemicals into groundwater.
- Results: eutrophication (algal blooms), oxygen depletion, loss of aquatic biodiversity and a shortage of safe drinking water.
- India: the Central Pollution Control Board identified 311 polluted river stretches on 279 rivers (2022). The Ganga, Yamuna and Mumbai’s Mithi, flowing through dense settlements, carry heavy loads of sewage and effluent.
3. Loss of flora and fauna (biodiversity loss)
- Expanding agriculture, drainage of wetlands, taming of rivers for irrigation and urbanisation have destroyed and fragmented natural habitats. The outcome is habitat fragmentation and lost landscape connectivity.
- Current extinction rates are tens to hundreds of times higher than the background rate of the geological record, a pace often called the sixth mass extinction.
- India holds about 7–8% of the world’s recorded species in only 2.4% of its land area. It is one of 17 megadiverse countries and contains parts of four of the world’s 36 biodiversity hotspots.
- Habitat loss, over-exploitation and disturbance have pushed many species to the edge. The cheetah was declared extinct in India in 1952.
Iconic species under threat
- Cheetah: reintroduced from Namibia (September 2022) and South Africa (2023) to Kuno National Park, Madhya Pradesh: the first intercontinental translocation of a large wild carnivore.
- Asiatic lion: confined to the Saurashtra region of Gujarat. The 2025 census counted 891 lions, up from 674 in 2020, with more than half now living outside Gir in farmland, coasts and scrub.
- A single population in one region remains vulnerable to one epidemic or disaster.
- Tiger: forest loss and poaching for skin and body parts shrank its range. Project Tiger (1973) has partly reversed the trend: India held about 3,682 tigers in 2022, more than 70% of the world’s wild tigers.
- Vultures: the white-rumped, long-billed and slender-billed vultures collapsed by more than 95% after cattle were treated with the painkiller diclofenac, which is lethal to vultures feeding on carcasses. Its veterinary use was banned in 2006.
- Their loss shows how degradation ripples through the ecosystem: uneaten carcasses fed feral dogs, and rabies cases rose.
4. Deterioration of air quality
- Urban air quality has deteriorated sharply under emissions from thermal power plants, industries, vehicles, construction dust and crop-residue burning.
- Pollutants include sulphur dioxide (SO₂), oxides of nitrogen (NOₓ), hydrogen sulphide (H₂S), carbon monoxide (CO), ground-level ozone, chlorofluorocarbons (CFCs) and particulate matter (fly ash, dust, soot).
- These emissions drive photochemical smog, acid rain, ozone-layer depletion and global warming.
- Indoor air pollution from biomass and kerosene cooking, incense, insecticides and aerosols is a large but under-recognised threat, above all to women and children in rural homes.
- North Indian cities of the Indo-Gangetic Plain fare worst: a land-locked basin, winter inversions, low wind and seasonal stubble burning trap pollutants, the effect seen in the urban pollution dome.
5. Urban environmental degradation
- Cities consume a disproportionate share of resources and concentrate waste, heat and pollution in small areas.
- Typical symptoms: sprawl over farmland and wetlands, falling water tables, choked drains and urban floods, slums without services, landfills, noise and urban heat islands.
- Problems of urbanisation in Indian million-plus cities combine all of these.
6. Degradation of hills and hillslopes
- Mountains degrade faster than plains because steep slopes, thin soils and fragile rocks leave little margin for error.
- Deforestation, road cutting, hydropower tunnelling, terracing failure and unregulated tourism trigger landslides and soil loss, and the damage travels down-valley as silt, floods and debris flows.
- Degradation of the Himalaya reached disaster scale in the Joshimath land subsidence and the South Lhonak glacial lake outburst flood in Sikkim, both in 2023.
Causes of Environmental Degradation
- Types describe what is degraded; causes explain why. The causes are multidimensional and interlocking: one cause produces several types of degradation, and each type becomes a cause in its turn.
- Two levels of cause are usually separated:
- Proximate (direct) causes: activities that act on the land, water and air: deforestation, farming practices, overgrazing, mining, urban and industrial growth.
- Underlying (root) causes: the social and economic forces behind them: population, poverty, affluence and consumption, technology, and market and policy failure.
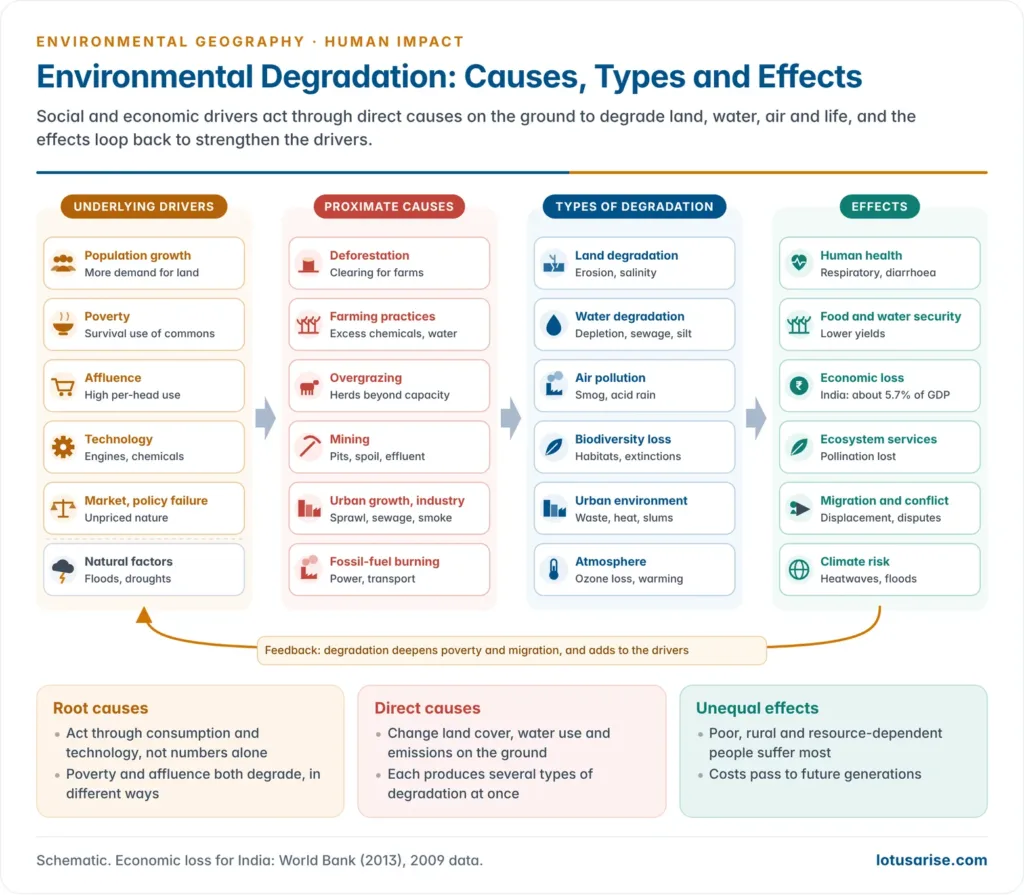
Underlying causes
Population growth
- Population growth multiplies pressure on every resource: more food, water, energy, housing and goods, each with its own environmental footprint.
- More land is cleared for farming and settlement, more energy is burnt, and more waste is generated, so degradation accelerates across all domains at once.
- Mechanism, not just numbers: the effect works through consumption and technology. The I = PAT identity of Paul Ehrlich and John Holdren (1971) writes impact as Population × Affluence × Technology. Each factor of human influence on ecology multiplies the others.
- Slowing population growth could cut global emissions by about 1.4–2.5 billion tonnes of carbon a year by 2050, a modelled estimate of 16–29% of the reductions then needed.
- Pressure in India: a 1.46 billion population on 2.4% of the world’s land; a livestock population of about 536 million (2019) far exceeds what common grazing land can carry.
- Caution: population alone does not explain degradation. A rich minority’s consumption often weighs more than a poor majority’s numbers, which is the core of the Malthusian debate.
Poverty
- Poverty and degradation form a vicious circle, the poverty–environment trap:
- the poor depend directly on common land, forests, water and fuelwood;
- with no capital, they over-use these resources to survive;
- degraded commons yield less, deepening poverty and pushing harder on what remains.
- The Brundtland Commission (1987) called poverty “a major cause and effect of global environmental problems.”
- At the Stockholm Conference (1972), Indira Gandhi asked, “Are not poverty and need the greatest polluters?”: a defining Southern view that development and environment are inseparable.
- Indian examples: shortened jhum cycles in the north-eastern hills, fuelwood head-loading from Chotanagpur forests, and overgrazed commons in western Rajasthan.
Affluence and consumption
- Rising incomes raise per-head use of energy, meat, water, metals and packaged goods, so a rich person’s footprint is many times a poor person’s.
- A “use and throw” culture of cheap goods with short lives, from fast fashion to single-use plastic and electronics, multiplies waste and ties rising economic status directly to rising environmental damage.
- Affluence exports degradation: rich consumers draw timber, soya, palm oil and minerals from distant tropical lands, so the damage appears far from where the demand arises.
Technology
- Technology is double-edged. It raised yields and incomes, but also brought pesticides, fossil-fuel engines, CFCs and plastics.
- Efficiency gains do not always cut total use. The Jevons paradox of William Stanley Jevons (1865) holds that cheaper, more efficient use of a resource can raise total consumption.
- Clean technology can also reduce degradation, as solar power, catalytic converters and drip irrigation show.
Market failure and policy failure
- Market failure: natural resources are treated as free goods, and the costs of degradation fall on third parties as externalities that never enter prices.
- Arthur Cecil Pigou (1920) proposed taxing such external costs, the basis of today’s polluter pays taxes.
- The tragedy of the commons of Garrett Hardin (1968) describes how open-access resources are over-used; Elinor Ostrom (1990) showed that communities can manage commons well under clear rules.
- Policy failure: governments make things worse through perverse subsidies and weak enforcement.
- Free farm power drives groundwater mining in Punjab and Haryana; urea subsidies skew fertiliser use towards nitrogen.
- National debt and revenue pressure push some governments to permit logging and mining.
- Weak governance: gaps in law and enforcement allow illegal mining, sand extraction and encroachment.
Proximate causes
Deforestation
- Deforestation, the large-scale removal of forest for farming, settlement, roads, dams, industry or fuelwood, is the most visible driver of degradation.
- Global deforestation has averaged about 10.9 million ha a year (2015–2025), mostly in the tropics. Forests still cover 4.14 billion ha, about 32% of the land.
- Consequences cascade:
- accelerated soil erosion and desertification;
- leaching of nutrients from soils;
- higher surface runoff and flooding;
- a broken equilibrium between soil, vegetation and atmosphere;
- emissions: land-use change, mainly deforestation, adds about a tenth of global CO₂ emissions.
- Forests regulate the hydrological cycle. They recharge groundwater, moderate river flows, check floods and desertification, filter air, store carbon and keep the air humid, so their loss reverberates through every sphere.
- Root causes of deforestation: weak forest governance, fuelwood collection, subsistence farming, population pressure, national debt and poverty.
Agricultural mismanagement
- Modern agriculture, built on high-yielding varieties, chemical fertilisers and pesticides and intensive irrigation, has raised food output enormously but at a heavy ecological cost.
- It is energy-intensive, running on fossil fuel for fertiliser, pumps and machinery.
- Aquifers are pumped faster than they recharge.
- Continuous cropping leaves the land no time to recover.
- Cultivation on mountain slopes without bunding, terracing or trenching causes severe erosion and nutrient loss.
- In shifting cultivation, shortened fallow cycles prevent the multi-tiered forest from regrowing.
- Excessive irrigation brings waterlogging and salinisation, lowering yields and contaminating soil and water. The Green Revolution belt of Punjab, Haryana and western Uttar Pradesh shows every symptom.
| Effect | Mechanism | Consequence |
|---|---|---|
| Hydrological | Less water retained in soil; more surface runoff | Floods; poor groundwater recharge |
| Micro-climatic | Less canopy cover; more sun on bare soil | Higher temperatures; lower humidity |
| Soil biota | Fewer earthworms and micro-organisms | Lower fertility; shift from perennial to annual plants |
| Chemical | Fertiliser and pesticide leaching to groundwater and rivers | Water pollution; eutrophication; health risks |
Overgrazing
- Overgrazing occurs when livestock numbers exceed the carrying capacity of pastures and rangelands.
- Ecological consequences are systemic:
- palatable fodder species are eaten out first and replaced by thorny, unpalatable weeds;
- loss of cover reduces biomass and species diversity;
- trampling compacts the soil, cutting infiltration and raising runoff and erosion;
- the microclimate turns drier.
- The changes pass up the food chain to higher trophic levels and decomposers, so the whole ecosystem degrades, not just its vegetation.
- India: village grazing commons in the semi-arid west and the alpine meadows of the Himalaya carry far more animals than they can sustain.
Soil erosion and desertification
- Soil erosion, the loss of the nutrient-rich topsoil, is among the most consequential forms of land degradation.
- Water erosion on farmland begins as sheet wash and, if unchecked, cuts rills, then gullies and ravines, as in the Chambal valley.
- Wind erosion dominates arid and semi-arid areas and drives desertification.
- Desertification is land degradation in arid, semi-arid and dry sub-humid areas caused by climatic variation and human activity. It is the degradation of drylands, not the advance of deserts.
- Deforestation, over-cultivation and overgrazing strip the cover; wind and water then remove the exposed soil until fertile land becomes unproductive.
- Slash-and-burn clearance destroys much of the topsoil. After a few cropping cycles the thin fertile layer is exhausted.
- The Thar as a lesson: the region was once far greener. Centuries of overgrazing, woodcutting and drier climate turned it into desert. Revegetation and irrigation on desert margins have had partial success that lasts only while they are maintained.
- India: about 83.69 million ha of drylands was undergoing desertification in 2018–19. Drought years accelerate it.
Mining
- Surface mining exposes deep, unweathered strata and releases manganese, sulphate, iron, zinc and nickel into streams in toxic concentrations, harming aquatic life and downstream users.
- Mining alters groundwater and stream hydrology and reduces species richness and population density.
- Deep mining causes surface subsidence; reclamation rarely restores the original vegetation and drainage.
- India: the coal and iron-ore belts of Jharkhand, Odisha and Chhattisgarh, the Aravallis and Goa carry the scars, from the underground coal fires of Jharia to abandoned iron-ore pits.
Urbanisation and industrialisation
- The world’s urban share rose from about 42% in 1985 to 55% in 2018, and is projected to reach 68% by 2050.
- Much urban growth comes from rural–urban migration, itself a product of rural poverty, unequal land distribution and weak investment in farming.
- Pathways of degradation:
- Land-use conversion: built-up areas spread over fertile farmland, wetlands and forests, an irreversible loss.
- Groundwater depletion: urban demand exceeds local recharge, so cities pump deeper and pipe water from distant sources, disrupting natural drainage.
- Pollution: urban sewage and industrial effluents foul rivers that downstream towns drink from; city emissions of nitrogen, sulphur and particulates cause smog and acid rain.
- Slums: about 17.4% of India’s urban population (2011) lived in slums, short of safe water, sanitation and waste disposal.
- Industrial clusters such as Vapi and Ankleshwar (Gujarat) and the Patancheru belt (Telangana) concentrate effluent, hazardous waste and contaminated groundwater.
Climate change as a driver
- Global warming is both a form of degradation and an accelerating driver of more.
- Under a very high emissions pathway, the IPCC’s Sixth Assessment Report (2021) projects 3.3–5.7°C of warming by 2081–2100 relative to 1850–1900.
- Expected effects: rising seas, intensified desertification, wider drought zones, shifting rainfall, more frequent and intense extremes, and ecosystem disruption beyond existing adaptive capacity.
- Its impact is uneven: warming differs by region, fastest in the Arctic and over high mountains such as the Himalaya.
Natural causes
- Floods, droughts, cyclones, earthquakes, landslides, volcanic eruptions and wildfires degrade land, water and habitats suddenly.
- They usually recover with time, but they compound human pressure: a cyclone on a mangrove coast already cleared for shrimp farms does far more damage.
Effects of Environmental Degradation
- The effects are multidimensional: they touch health, biodiversity, geophysical systems, the economy and social equity.
- They operate across timescales from immediate to multigenerational, and they fall unequally, hardest on the poor, women, children and resource-dependent communities.
Impact on human health
- Air pollution: toxic air causes pneumonia, asthma, chronic obstructive pulmonary disease (COPD), heart disease, stroke and lung cancer.
- Outdoor and household air pollution together cause about 6.7 million deaths a year worldwide.
- Water-borne disease: contaminated water spreads cholera, typhoid and diarrhoeal diseases, leading causes of child death in developing countries.
- Toxic chemicals: about 385 million unintentional acute pesticide poisonings occur worldwide each year, mostly among farmers and farm workers.
- Many such compounds resist breakdown, persist for years and travel long distances in air and water.
- Climate-linked risks: heat stress, and the spread of malaria, dengue and viral encephalitis as mosquitoes colonise newly warm areas.
- Degraded ecosystems also breed new disease: forest clearing brings people into contact with zoonoses such as Nipah, and dams and irrigation spread malaria.
Loss of biodiversity and ecosystem services
- Biodiversity keeps ecosystems working. It cycles nutrients, filters water, regulates climate, controls pests, pollinates crops and holds the genetic reservoir for breeding new crop varieties.
- Its loss has functional consequences, not just aesthetic or ethical ones.
- Biodiversity declines at two scales:
- globally (γ-diversity), as species are permanently lost;
- regionally (β-diversity), as communities in different places become homogenised.
- Locally, α-diversity may even rise as non-native species invade, but this masks a homogenisation that impoverishes the global gene pool.
- Because food, medicine, fibre and livelihoods all depend on it, the loss of biodiversity undermines sustainable development itself.
Ozone-layer depletion
- CFCs, halons and hydrochlorofluorocarbons (HCFCs) from refrigerants, aerosols, foams and solvents destroy stratospheric ozone, weakening Earth’s shield against ultraviolet-B (UV-B) radiation.
- More UV-B raises the risk of skin cancer, cataracts and immune suppression, cuts photosynthesis, and harms phytoplankton at the base of marine food chains.
- The Montreal Protocol (1987) is the most successful environmental treaty: ozone-depleting substances have been almost entirely phased out.
- The ozone layer is on track to return to 1980 values by about 2040 over most of the world, 2045 over the Arctic and 2066 over the Antarctic.
- The Kigali Amendment (2016) now phases down HFCs, which spare ozone but are powerful greenhouse gases.
Economic consequences
- Direct costs: spending to restore green cover, clean rivers, manage landfills and protect endangered species.
- Indirect costs: lost productivity of degraded soil and water, the health burden of pollution, and falling tourism revenue.
- India: the World Bank (2013) estimated the cost of environmental degradation at about 5.7% of GDP, roughly ₹3.75 trillion a year (2009 data). Outdoor air pollution (1.7%) and indoor air pollution (1.3%) were the largest items.
- The deeper flaw: environmental damage is not priced into economic and social accounts. Treating nature as free leads to systematic over-exploitation.
- Cheap goods with short lives are over-produced and freely discarded, a self-reinforcing cycle.
- Hence the call for green GDP and natural-capital accounting, argued globally by the Dasgupta Review (2021) on the economics of biodiversity.
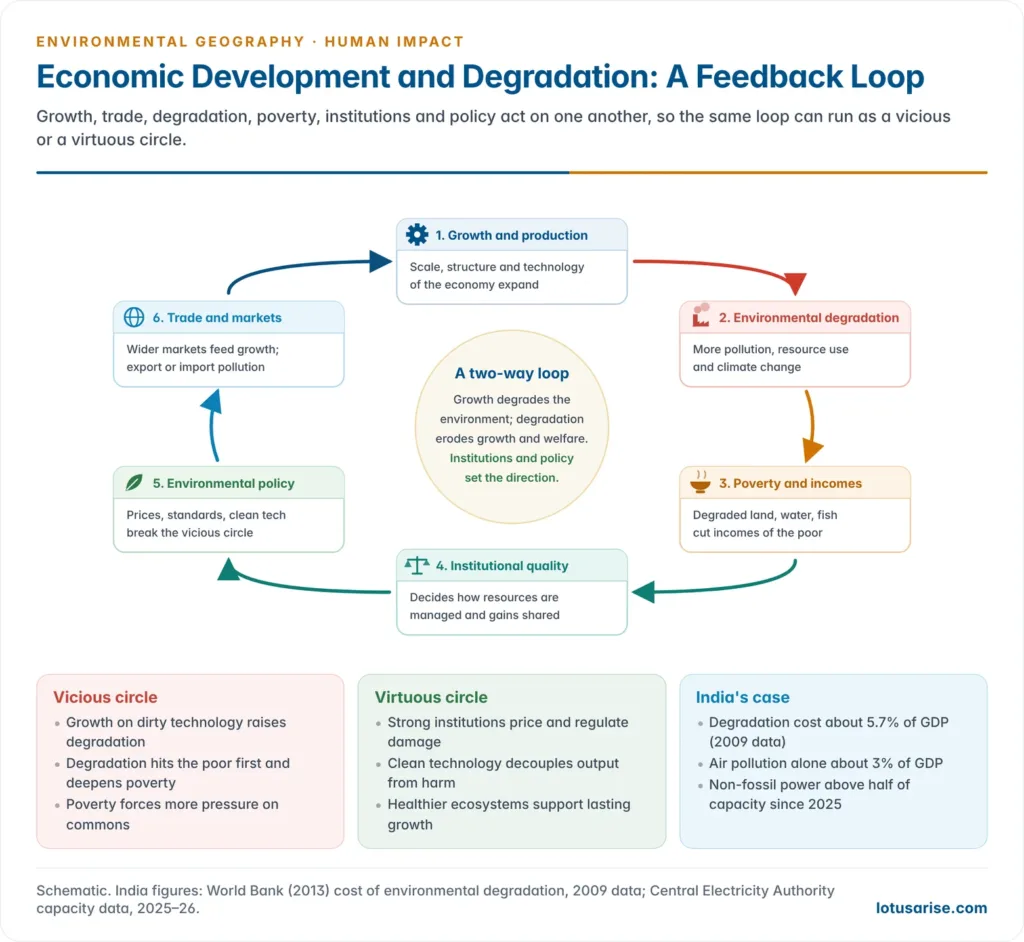
- Growth and degradation feed back on each other:
- production and trade expand through scale, changes in economic structure and technology;
- growth raises pollution and resource use and adds to climate change;
- degradation lowers incomes and deepens poverty, above all among those who live off land, forests and fisheries;
- institutional quality decides how resources are managed and how gains are shared;
- environmental policy can break the vicious circle and set a virtuous one in motion.
Loss to the tourism industry
- Tourism depends directly on environmental quality. Loss of forest and green cover, declining wildlife, spreading landfills and dirty air and water all make destinations less attractive.
- For communities that live by ecotourism, in biodiversity hotspots, on coasts and in hill stations, degradation can bring economic collapse as visitors stop coming.
- Tourism is also a cause: overcrowded hill towns such as Shimla, Manali and Joshimath face water shortages, waste dumps and slope failure.
Degradation of fisheries
- Pollution, habitat destruction, overfishing and climate-driven warming and acidification are depleting marine and freshwater fisheries.
- About 37.7% of assessed marine fish stocks were fished at biologically unsustainable levels in 2021.
- Fish is a key source of protein for millions in India and across the developing world, so declining catches strike both nutrition and livelihoods.
- Responses: integrated coastal zone management and marine protected areas complement conventional fisheries management. The wider threats to the oceans include coral bleaching and dead zones.
Social and political consequences
- Displacement and migration: degraded drylands, eroding coasts and repeated floods push people out. They become environmental or climate migrants.
- Conflict over resources: shrinking water, pasture and forest raise tension between farmers and herders, upstream and downstream users, and people and wildlife. The rise of human–wildlife conflict is one face of habitat loss.
- Inequity: the poor contribute least to degradation but suffer most. Women, who collect fuel, fodder and water, bear an extra burden when these resources recede.
- Intergenerational loss: degradation transfers costs to future generations, the opposite of sustainable development.
Development, Carrying Capacity and the Ecological Footprint
The Environmental Kuznets Curve (EKC)
- Simon Kuznets (1955) proposed an inverted-U relation between income and inequality: inequality first rises with growth, then falls.
- Applied to the environment, the Environmental Kuznets Curve holds that degradation first rises with per-capita income, peaks at a turning point, and then declines as societies grow richer.
- Gene Grossman and Alan Krueger (1991) first showed the pattern for air pollutants such as SO₂ and smoke.
- Theodore Panayotou (1993) gave it the name Environmental Kuznets Curve.
- For most local pollutants the turning point came below about US$8,000 per head (1985 dollars).
- Three effects explain the shape:
- Scale effect: more output means more pollution and resource use.
- Composition (structural) effect: economies shift from farming to heavy industry (dirtier) and then to services (cleaner).
- Technique effect: richer societies adopt cleaner technology and stricter regulation.
- Why richer societies clean up: demand for environmental quality rises with income, education and voice, and states gain the revenue to regulate.
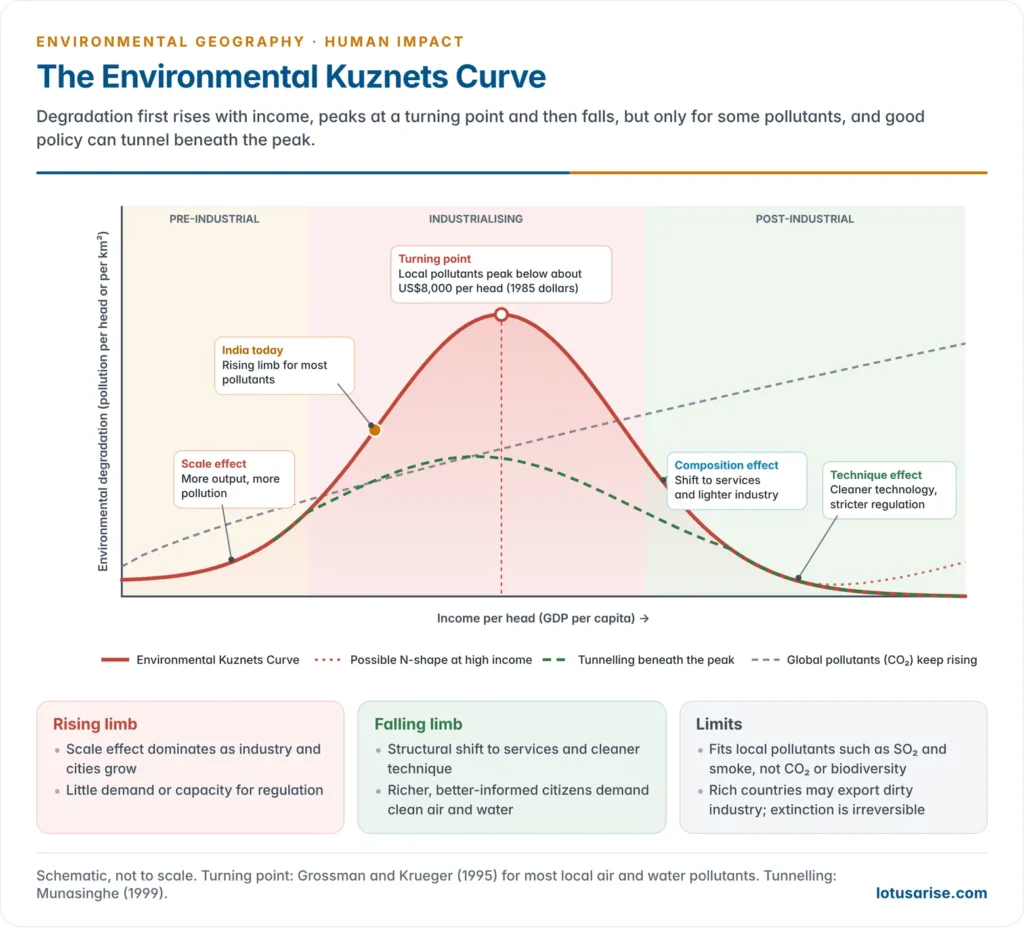
Critique of the EKC
- It fits local, visible pollutants such as SO₂, smoke and faecal coliforms in rivers, but not global ones: CO₂, waste and biodiversity loss keep rising with income in most countries.
- Pollution havens: rich countries may “clean up” partly by relocating dirty industry to poorer countries and importing the goods, so the curve cannot hold for the world as a whole.
- Irreversibility: species extinction, aquifer depletion and topsoil loss cannot be undone after the turning point.
- Weak statistics: later econometric work, notably by David Stern, found the curve far less robust than first claimed.
- N-shaped curves: degradation may rise again at very high incomes.
- Policy lesson, “tunnelling”: Mohan Munasinghe (1999) argued that developing countries can tunnel through the curve. With good policy, clean technology and early regulation, they can reach high incomes without passing the peak of degradation.
- India’s stage: India sits on the rising limb for most pollutants, but has cut the emissions intensity of its GDP by about 36% between 2005 and 2020: an attempt to bend the curve early.
Carrying capacity
- Carrying capacity is the maximum population of a species that an environment can support indefinitely without degrading its resource base.
- In population ecology it is the ceiling K at which a population’s growth levels off.
- Human carrying capacity is elastic: technology, trade and consumption levels decide how many people a region can support.
- A region may import food, water (as virtual water) and energy, and so appear to live within its means while degrading land elsewhere.
- Overshoot occurs when demand exceeds carrying capacity. It is possible for a time only by drawing down stocks: mining groundwater, felling forests, overfishing and accumulating CO₂.
- Applied carrying-capacity studies in India set limits for fragile places, as for hill towns and pilgrim routes in the Himalaya after Joshimath.
Ecological footprint and biocapacity
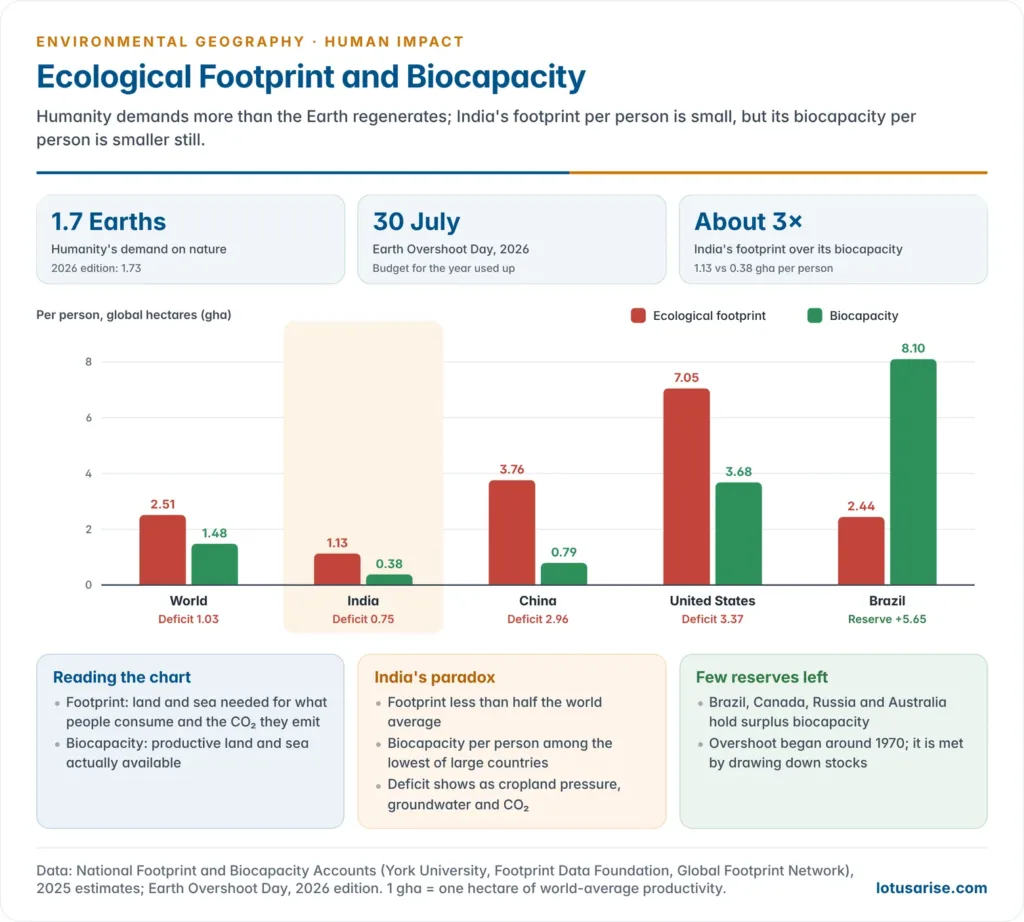
- The ecological footprint, developed by William Rees and Mathis Wackernagel (concept 1992; book 1996), measures how much biologically productive land and water a person, city or country needs to produce what it consumes and absorb its waste, chiefly CO₂.
- Biocapacity is the area of productive land and sea actually available to supply those services.
- Both are expressed in global hectares (gha): hectares of world-average productivity.
- Ecological deficit (footprint > biocapacity) means a country is overdrawing its own ecosystems, importing biocapacity or dumping CO₂ into the global commons. Ecological reserve is the opposite.
| Region (2025 estimate) | Footprint (gha per person) | Biocapacity (gha per person) | Balance |
|---|---|---|---|
| World | 2.51 | 1.48 | Deficit; about 1.7 Earths in use |
| India | 1.13 | 0.38 | Deficit; footprint about 3 times its biocapacity |
| China | 3.76 | 0.79 | Deficit |
| United States | 7.05 | 3.68 | Deficit |
| Brazil | 2.44 | 8.10 | Reserve |
- India’s paradox:
- its per-capita footprint is less than half the world average, and if everyone lived like the average Indian, humanity would need less than one Earth;
- but its biocapacity per person is among the lowest of large countries, so India uses about three times what its ecosystems regenerate.
- The deficit shows as cropland pressure, groundwater mining, degraded forests and CO₂.
- Uneven footprints within India: the footprint of affluent urban households in the metros is many times that of rural and tribal households. The growth of the footprint is driven by cropland and carbon: land for food and fodder, and energy for cities and industry.
- Overshoot began around 1970; since then humanity’s demand has exceeded what the Earth regenerates every year.
- Limits of the measure: it omits toxic pollution, water scarcity and biodiversity loss, and converting everything to “hectares” hides much detail. It is a useful accounting tool, not a complete index of degradation.
Economic development and environmental degradation in India
- Development has come at an environmental cost:
- Green Revolution: groundwater depletion, salinisation and declining soil organic carbon in Punjab and Haryana.
- Industrialisation and mining: polluted river stretches, contaminated groundwater in industrial corridors, and mined-out land on the Chotanagpur plateau.
- Urbanisation: sprawl over farmland and wetlands, solid waste, sewage and some of the world’s highest particulate loads in cities of the Indo-Gangetic Plain.
- Infrastructure: highways, hydropower and tourism in the Himalaya, and ports and industry on the coasts.
- But growth also funds remedies: cleaner cooking fuel, sewage treatment, renewable energy and stricter standards.
- Non-fossil sources passed half of India’s installed power capacity in 2025, five years ahead of the 2030 target; by July 2026 they made up about 54% of 552 GW, led by solar (about 165 GW).
- The task is decoupling: raising incomes while cutting resource use and pollution per unit of output. It lies at the heart of sustainable growth and development.
Environmental Degradation in India and Remedial Measures
- India presents an acute case: rapid population growth, development pressure, poverty and governance gaps meet a monsoon climate, fragile mountains and a long, densely settled coast.
India’s environmental status at a glance
| Indicator | Latest value | Source and year |
|---|---|---|
| Land undergoing degradation | 97.85 million ha (29.77% of India) | ISRO Desertification and Land Degradation Atlas, 2021 (2018–19 data) |
| Drylands undergoing desertification | 83.69 million ha | Same atlas |
| Forest and tree cover | 8,27,357 sq km (25.17%) | India State of Forest Report 2023 |
| Environmental Performance Index | Rank 176 of 177; score 22.46 | EPI 2026 |
| Ecological footprint | 1.13 gha per person; biocapacity 0.38 | 2025 estimate |
| Sewage treated | Installed capacity for about 44% of urban sewage | CPCB, 2021 |
Scale of land degradation
- The Desertification and Land Degradation Atlas of India (Space Applications Centre, ISRO, 2021) found 97.85 million ha, or 29.77% of India’s area, undergoing degradation in 2018–19.
- It rose from 94.53 million ha (28.76%) in 2003–05 and 96.40 million ha (29.32%) in 2011–13, and increased in 28 of 31 states and UTs after 2011–13.
- Main processes: water erosion (36.20 million ha), vegetation degradation (30.07) and wind erosion (17.94), followed by salinity, frost shattering and settlement.
- Most affected by share of their own area: Jharkhand (68.8%), Rajasthan (62.1%), Delhi (61.7%), Goa (52.6%) and Gujarat (52.2%). Rajasthan has the largest absolute area.
- Forests: the India State of Forest Report 2023 puts forest and tree cover at 25.17% of the country (forest cover 21.76%, tree cover 3.41%), a net gain of 1,445 sq km over 2021.
- Quantity hides quality: much of the gain is in plantations and tree cover outside forests, while natural forests in the north-east continue to thin under shifting cultivation and infrastructure. Forest resources vary sharply by state.
- Other pressures on land:
- Soil organic matter decomposes faster as temperatures rise, releasing more CO₂.
- Reactive nitrogen from fertilisers, sewage and fuel combustion acidifies soils and eutrophies water.
- Solid waste: Indian towns generate about 1.6 lakh tonnes of municipal waste a day (roughly 58 million tonnes a year), and only about half is treated. Pavements, open plots, drains and rivers serve as de facto dumps, and legacy landfills such as Ghazipur and Deonar catch fire.
The water crisis
- Untreated sewage is the single largest polluter of India’s rivers and groundwater.
- Indian cities generate about 72,368 million litres a day (MLD) of sewage. Installed treatment capacity is only about 31,841 MLD, and plants actually treat about 20,236 MLD, under a third of the load.
- Rivers such as the Ganga, Yamuna and Mithi carry industrial effluent, farm runoff and raw sewage through dense settlements.
- Groundwater is over-drawn in Punjab, Haryana, Rajasthan and Delhi, and contaminated by arsenic in the Ganga–Brahmaputra delta and by fluoride in the dry peninsular and western states. Most of India’s water resources are now under stress in the dry season.
Biodiversity at risk
- India’s richest ecosystems, the Himalaya, the north-eastern hills, the Western Ghats and the Andaman and Nicobar Islands, are also under the greatest human pressure.
- India lies in the Hindustan centre of crop origin and diversity identified by Nikolai Vavilov, one of his eight primary centres. The wild relatives of rice, millets, pulses, citrus and mango growing in its agro-biodiversity hotspots are of global food-security value.
Endangered species and their threats
| Species or group | Region | Primary threat |
|---|---|---|
| Great Indian Bustard | Rajasthan, Gujarat | Grassland loss; collisions with power lines |
| Bengal Florican | Terai and Brahmaputra grasslands | Conversion of grasslands to farmland |
| Long-billed and slender-billed vultures | Northern and central India | Diclofenac poisoning through carcasses |
| Hangul (Kashmir stag) | Dachigam, Jammu and Kashmir | Habitat shrinkage; disturbance; poaching |
| Hopea shingkeng (a dipterocarp tree) | Arunachal Pradesh | Logging for timber |
| Medicinal plants | Western Ghats (Karnataka, Kerala, Tamil Nadu) | Destructive harvesting |
Regional hotspots of degradation
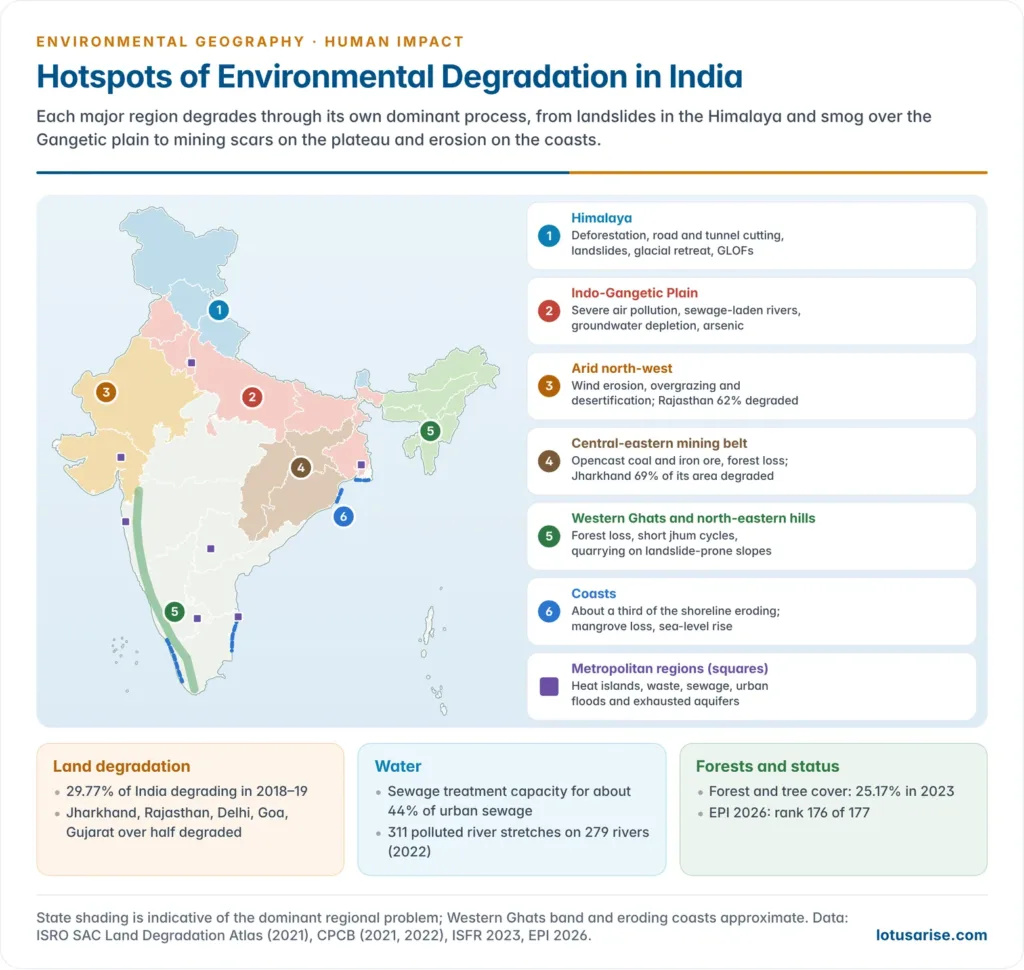
- Himalaya: deforestation, road and tunnel building, landslides, glacial retreat and GLOFs; down-valley silt and floods.
- Indo-Gangetic Plain: severe air pollution, sewage-laden rivers, groundwater depletion and arsenic; salinity and waterlogging in canal commands.
- Arid and semi-arid north-west: wind erosion, overgrazing and desertification in Rajasthan, Gujarat and Ladakh.
- Central and eastern mining belt: opencast coal and iron-ore mining, deforestation and water erosion across Jharkhand, Odisha and Chhattisgarh.
- Western Ghats and north-eastern hills: loss of forest, shortened jhum cycles, plantations and quarrying on landslide-prone slopes.
- Coasts: erosion of about a third of the shoreline, mangrove loss, sea-level rise, port and tourism pressure and polluted estuaries.
- Metropolitan regions: heat islands, waste, sewage, groundwater exhaustion and urban floods.
Conservation, management and remedial measures
- Conservation is the planned management of the environment to prevent its over-exploitation, destruction or neglect.
- It includes rational use of resources, protection of nature, and control or elimination of pollution, through practices that keep resources in circulation by renewal, recovery, recycling and reuse.
- Three pillars:
- Rational use of resources: match extraction to regenerative capacity.
- Sustained-yield management: harvest forests, fisheries and pastures no faster than they replace themselves.
- Continuous restoration and regeneration: actively rehabilitate degraded ecosystems.
- People’s movements such as Chipko and Silent Valley, and tools of environmental management such as environmental audit and carrying-capacity studies, put these pillars into practice.
Land and soil conservation
- Agronomic measures:
- contour bunding and terracing on slopes;
- mulching and green cover to check erosion;
- soil-moisture conservation;
- crop rotation and fallow periods.
- Afforestation:
- social forestry, recommended by the National Commission on Agriculture (1976);
- farm forestry and community woodlots;
- Joint Forest Management (from 1990), in which village committees protect state forests and share their produce. Social forestry and agroforestry extend tree cover onto farmland.
- Problem-soil reclamation:
- gypsum for sodic soils, leaching and drainage for saline soils;
- salt-tolerant crop varieties;
- safe waste disposal to prevent chemical degradation of soil.
- Policy and institutions:
- land-use regulation and zoning;
- wasteland and watershed development programmes;
- economic incentives for soil conservation.
- Land degradation neutrality: India has pledged to restore 26 million ha of degraded land by 2030, and launched the Aravalli Green Wall (2025) against the spread of degradation from the Thar. The global side of this ecosystem restoration is the UN Decade on Ecosystem Restoration (2021–2030).
Conservation of water resources
- Agriculture takes about 70% of global freshwater withdrawals, so water efficiency matters most there:
- drip and sprinkler irrigation, precision farming, drought-tolerant varieties and less water-hungry cropping patterns.
- Traditional water harvesting offers time-tested, low-cost, local alternatives to costly centralised schemes:
- johads and talabs (village ponds), kunds (covered underground tanks) of the Thar, and groundwater dams.
- Policy measures:
- integrated water resources management to balance farming, industry and domestic use, with priority for the poor;
- enforceable effluent standards for industry;
- restoration of degraded lakes, ponds and rivers, as under the Namami Gange programme.
Biodiversity conservation
- India has over 1,000 protected areas, including about 107 national parks, covering about 5.3% of the country.
- The network is significant but small for a country of India’s size and richness, which is why community reserves, sacred groves and other effective area-based conservation measures matter.
- Flagship programmes:
- Project Tiger (1973): 58 tiger reserves by 2026.
- Project Elephant (1992): long-term conservation of elephants and their corridors.
- Crocodile Conservation Project (1975): breeding and release of gharial, mugger and saltwater crocodiles, begun in Odisha.
- Snow leopard and Tibetan antelope (chiru) protection in the trans-Himalaya.
- Cheetah reintroduction (2022): Kuno National Park, Madhya Pradesh.
- Beyond protected areas, ex-situ conservation in seed banks, zoos and botanical gardens holds back the loss of genetic diversity.
Waste management: the 3R framework
- India’s towns, industries and hospitals generate millions of tonnes of municipal, industrial and biomedical waste every year.
- Organic matter makes up a large share of municipal waste, and it can be diverted from landfills by composting, vermicomposting and biogas.
- The 3R hierarchy of Reduce, Reuse, Recycle gives a practical framework for cutting waste at household, community and industrial scales. The circular economy extends it to product design, repair and recovery.
Transition to renewable energy
- Fossil fuels (coal, oil and gas) drive much of the degradation through their extraction, processing and combustion.
- A shift to solar, wind, hydel, tidal, geothermal and biomass energy is therefore central to long-term environmental management.
- India’s first wave-energy plant, a 150 kW pilot, was built at Vizhinjam near Thiruvananthapuram. The Gulf of Kutch, with its high tidal range, holds the country’s main tidal-power potential.
- Solar and wind capacity have expanded fastest, under the National Solar Mission and successor programmes.
- Commitments to net zero by 2070 and the Carbon Credit Trading Scheme (2023) set the long-term frame of carbon neutrality.
Mitigation strategies: the policy framework
- Institutional:
- stronger laws that close the gaps exploited by illegal mining, logging and encroachment;
- the Supreme Court’s directions on municipal solid waste (from 2000), which led to the first waste rules;
- Environmental Impact Assessment (EIA) for new projects;
- the National Green Tribunal (2010) for speedy environmental justice. These rest on the Environment (Protection) Act, 1986 and the sectoral pollution and forest laws.
- Economic:
- pollution taxes and levies that make polluters pay for external costs;
- payments for ecosystem services and rewards for forestation, such as the Green Credit Programme (2023);
- green GDP accounting. Such market-based instruments now sit alongside command-and-control rules in India’s environmental policy.
- Technological:
- cleaner production in industry;
- better engine design for complete combustion, and cleaner fuel standards (BS-VI from 2020);
- bioremediation of contaminated soils and water.
- Educational and social:
- environmental education as a lever of behaviour change;
- awareness that raises demand for environment-friendly products;
- community mobilisation through NGOs and panchayati raj institutions, and the LiFE (Lifestyle for Environment) mission’s appeal to mindful consumption.
The education–environment nexus
- Education improves environmental quality through three channels:
- It makes people more aware of environmental problems and more receptive to pro-environmental behaviour.
- It raises demand for cleaner products and green technology, and the skills to supply them.
- It slows population growth, reducing total resource pressure.
- Educated societies show lower fertility, higher environmental awareness and greater political capacity to demand and enforce protection. Formal and non-formal environmental education, from school curricula to eco-clubs, builds that capacity.
Previous Year Questions
2020The pattern of growing ecological foot-prints is uneven in nature. Analyze with reference to land resources in India.2020“Land degradation is a threat to productivity and sustainable resource management” Explain with suitable examples from India.2016Explain the impact of economic development on environmental degradation in India.2000Discuss the causes and consequences of environmental degradation and highlight the related conservation measures.





Good
very helpful…. thank you …
Add way forward and govt initiative of india and it’s positive impact too