

- Urbanisation is the relative concentration of a territory’s population in towns and cities. It changes the economy, society and landscape as well as numbers.
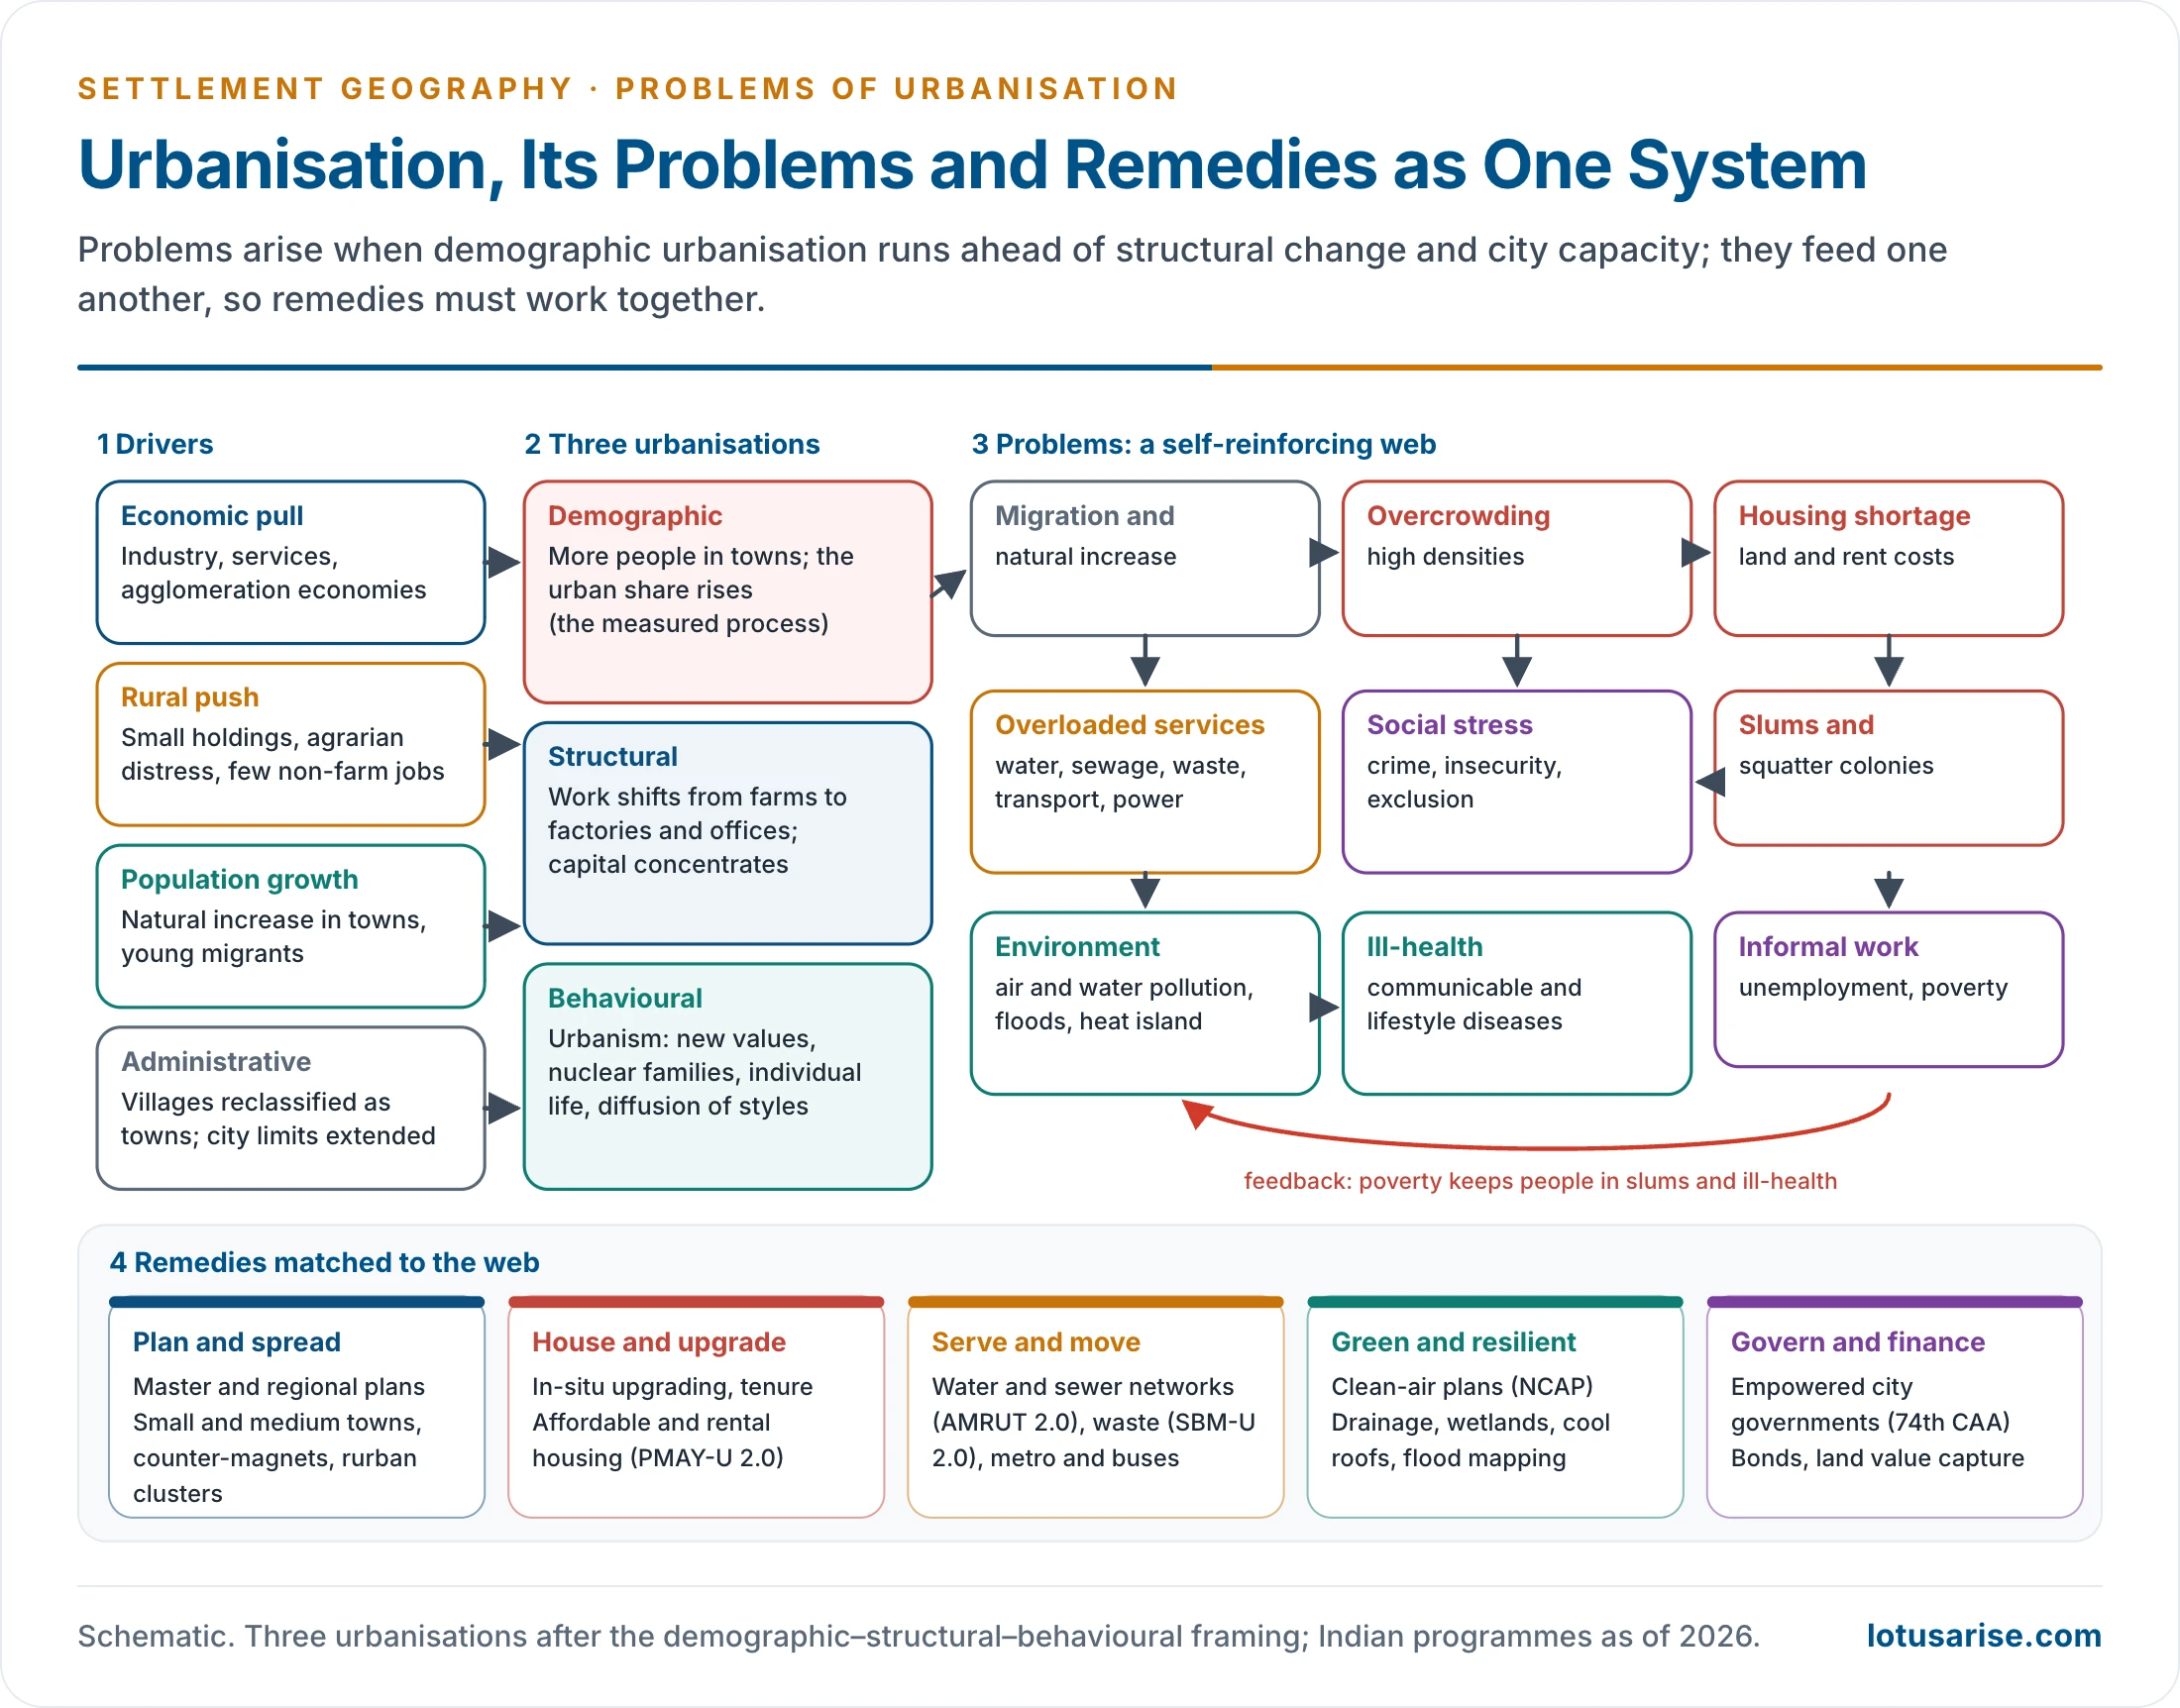
- Urbanisation itself is not the problem. Problems arise when urban growth outruns jobs, housing, services, land management and governance, and when it is unplanned and unsustainable.
- The problems differ between the developed world, which faces sprawl, ageing and inner-city decline, and the developing world, which faces the pressure of numbers, slums and service deficits. The remedies therefore have to work as a system.
Urbanisation: The Setting

Three Dimensions of Urbanisation
- Demographic urbanisation: a rising share of people in urban places, through migration (the main contributor), natural increase and reclassification. The end point is an almost fully urban society concentrated in a few large places.
- Structural urbanisation: the shift of production, distribution and exchange to cities, driven by industrial and later service capitalism and by economies of scale and agglomeration.
- Behavioural urbanisation: urbanism, the urban way of life. New values, attitudes and styles form in cities, above all the large ones, and diffuse down the urban hierarchy and into villages.
- In this framing demographic change is the dependent variable. Structural forces drive it.
- Rapid demographic urbanisation without matching structural change produces over-urbanisation: cities whose populations outrun their jobs and infrastructure, typical of the acceleration stage of urbanisation in poor countries.
- Large cities are not unique to industrial societies. Asia had large cities long before the Industrial Revolution, and the Third World now urbanises through migration as much as through industry.
- India’s census definition of urban covers:
- Every municipality, corporation, cantonment board or notified town area.
- Every other place with at least 5,000 people, 400 persons per km² and 75% of male main workers outside agriculture.
Related Concepts
- What is typical of one time and place may not be typical of others, since demographic urbanisation occurs in many settings.
- Counter-urbanisation: large numbers move from urban areas to the surrounding countryside. It is demographic and social, with some movement of business too.
- Rural–urban continuum: a continuous gradation of ways of life between a truly rural and a truly urban pole. It stresses differences of degree over a sharp dichotomy.
- Stages: an S-shaped curve that levels off near 80% urban, in five steps:
- Very slow growth, with most people in agriculture.
- Rapid urbanisation with economic development.
- Urbanisation ends, with most people in towns, in industry and services.
- Counter-urbanisation, as some commute from outside.
- Re-urbanisation, as cities revive.
Why the Problems Concentrate in the Developing World
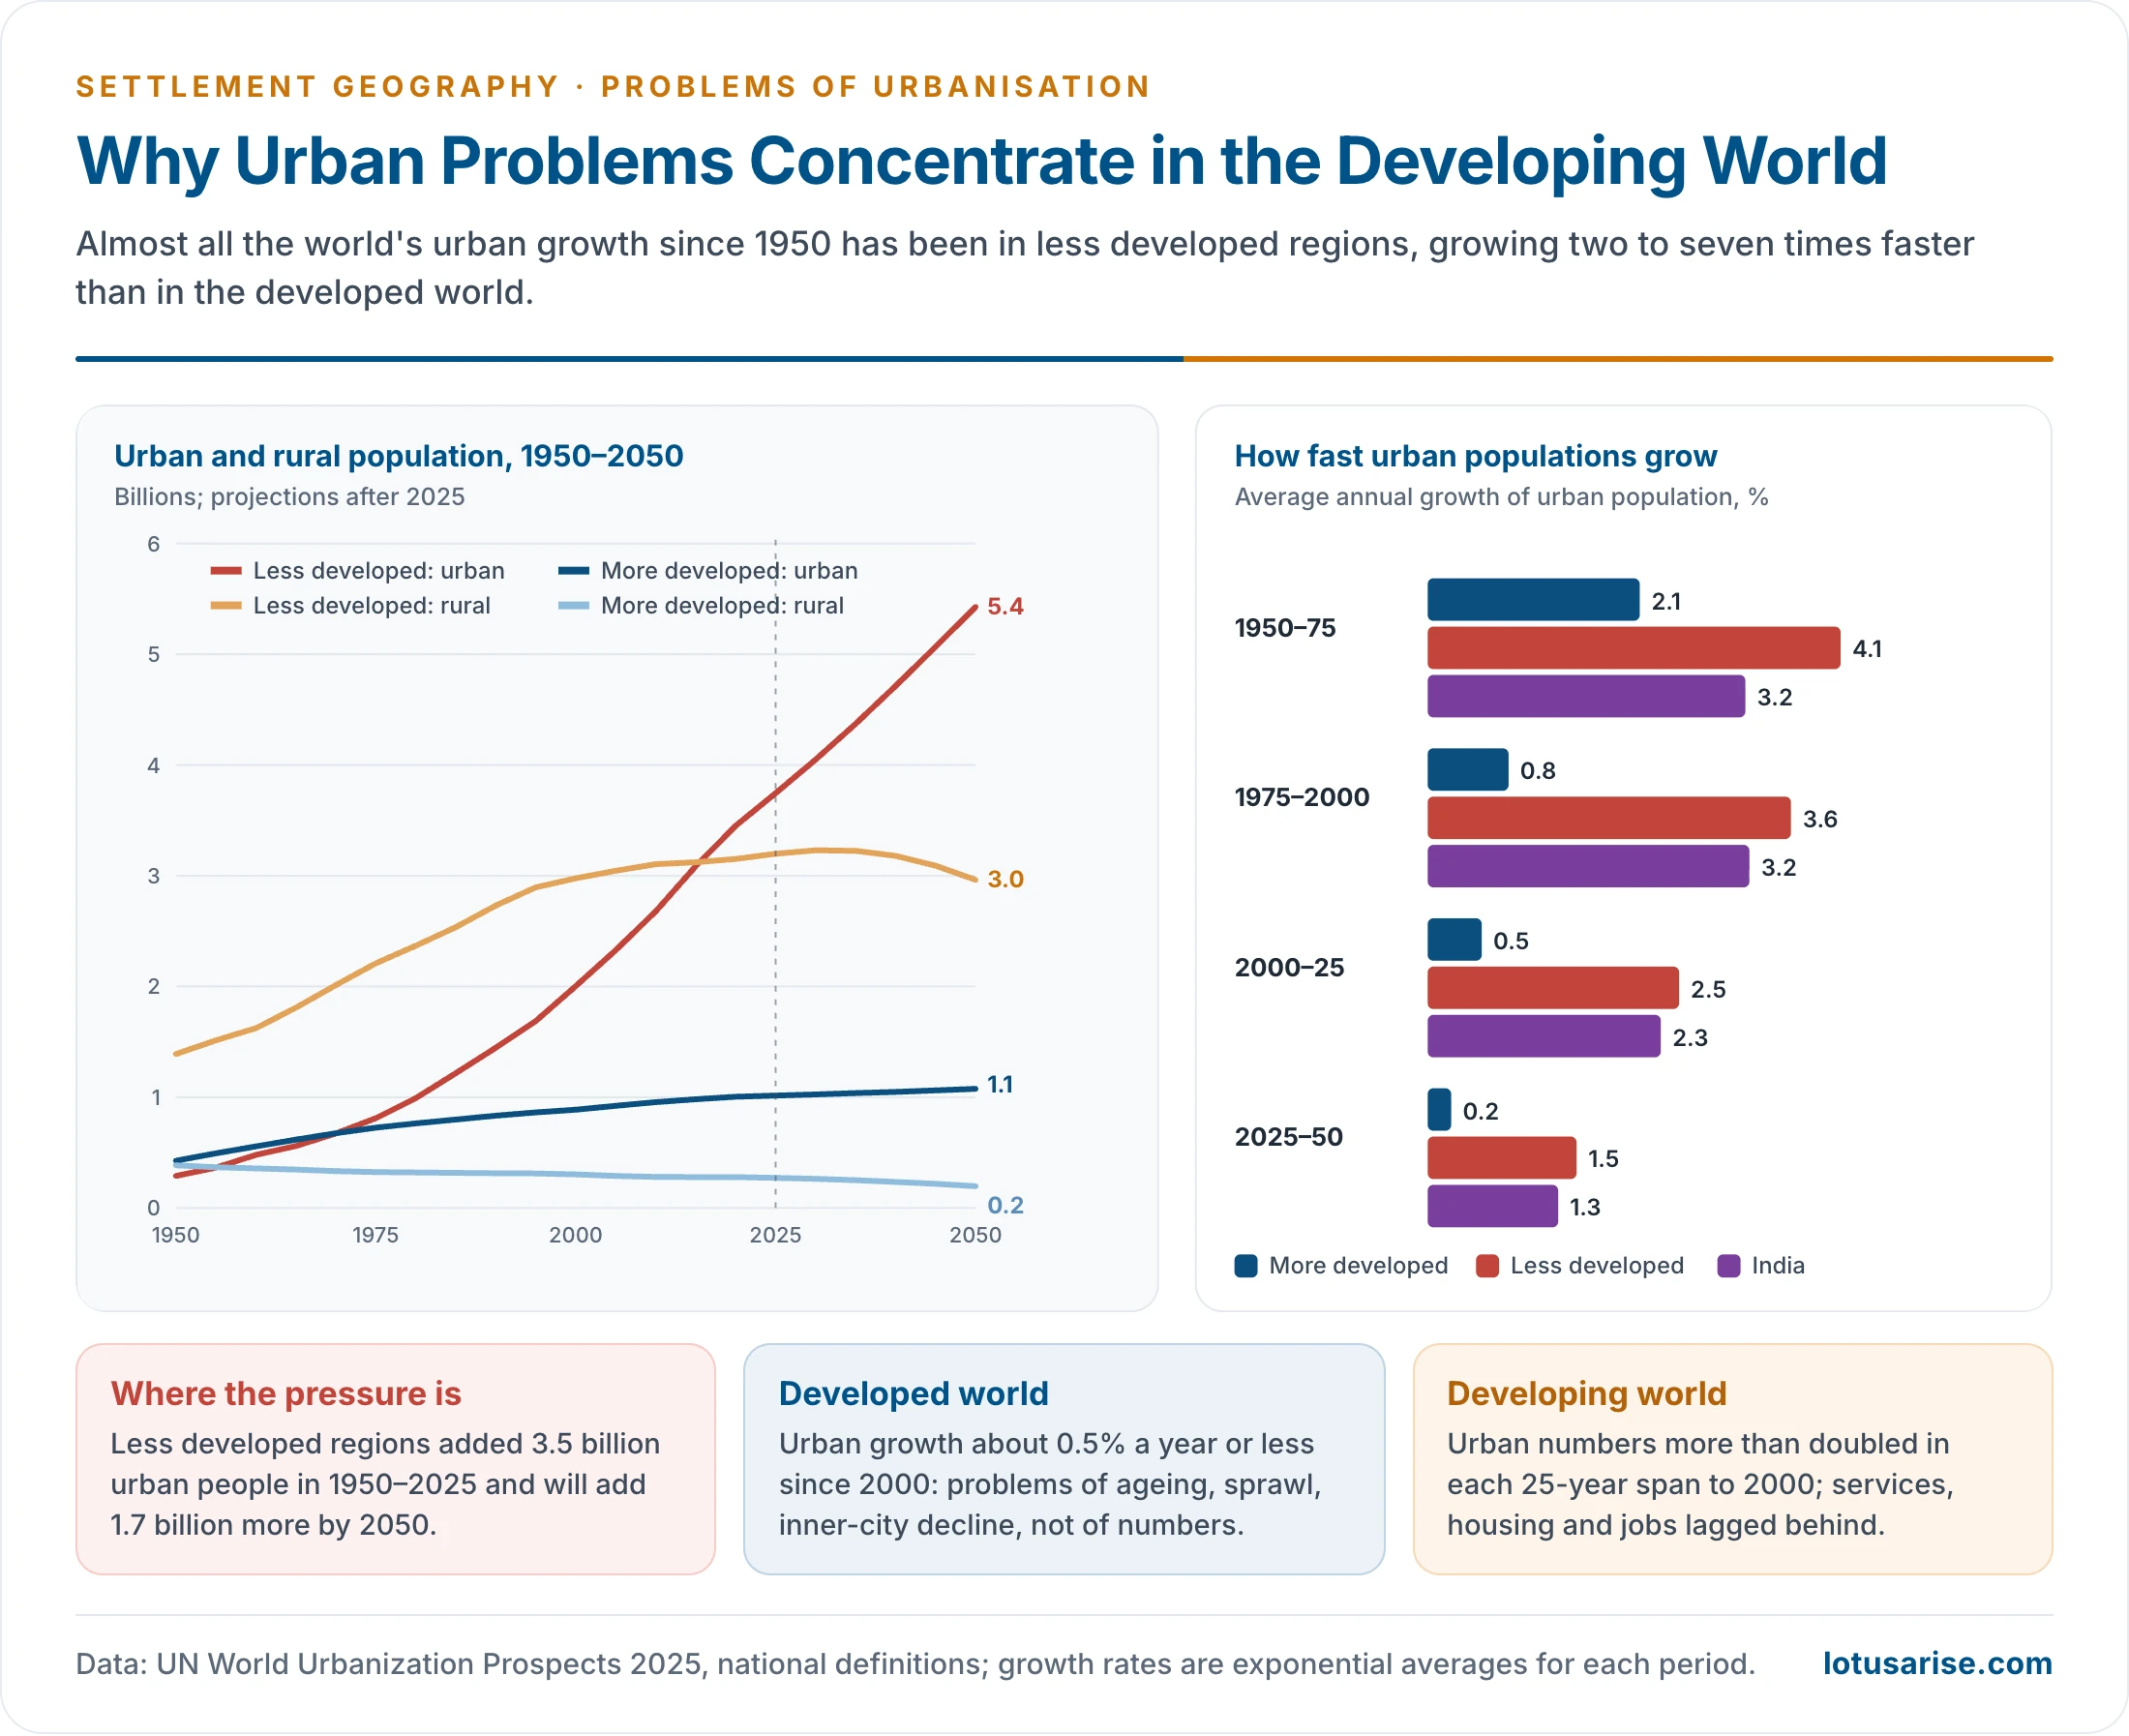
- Less developed regions grew from 290 million urban people in 1950 to 3.75 billion in 2025. They will add 1.7 billion more by 2050 (UN WUP 2025).
- More developed regions grew from 0.43 to 1.01 billion over the same period.
- Urban growth rates in 2000–25 were about 2.5% a year in less developed regions, 2.3% in India and only 0.5% in more developed regions.
- Levels in 2025: more developed regions 78.8% urban, less developed 53.9%, least developed countries 37%.
- The longer series, from the UN’s previous revision:
| Percentage urban | 1950 | 1970 | 1990 | 2018 | 2030 | 2050 |
|---|---|---|---|---|---|---|
| World | 29.6 | 36.6 | 43.0 | 55.3 | 60.4 | 68.4 |
| More developed regions | 54.8 | 66.8 | 72.4 | 78.7 | 81.4 | 86.6 |
| Less developed regions | 17.7 | 25.3 | 34.9 | 50.6 | 56.7 | 65.6 |
| Rate of urbanisation (%) | 1950–70 | 1970–90 | 1990–2018 | 2018–30 | 2030–50 |
|---|---|---|---|---|---|
| World | 1.06 | 0.80 | 0.90 | 0.74 | 0.62 |
| More developed regions | 0.99 | 0.40 | 0.30 | 0.28 | 0.31 |
| Less developed regions | 1.78 | 1.61 | 1.33 | 0.94 | 0.73 |
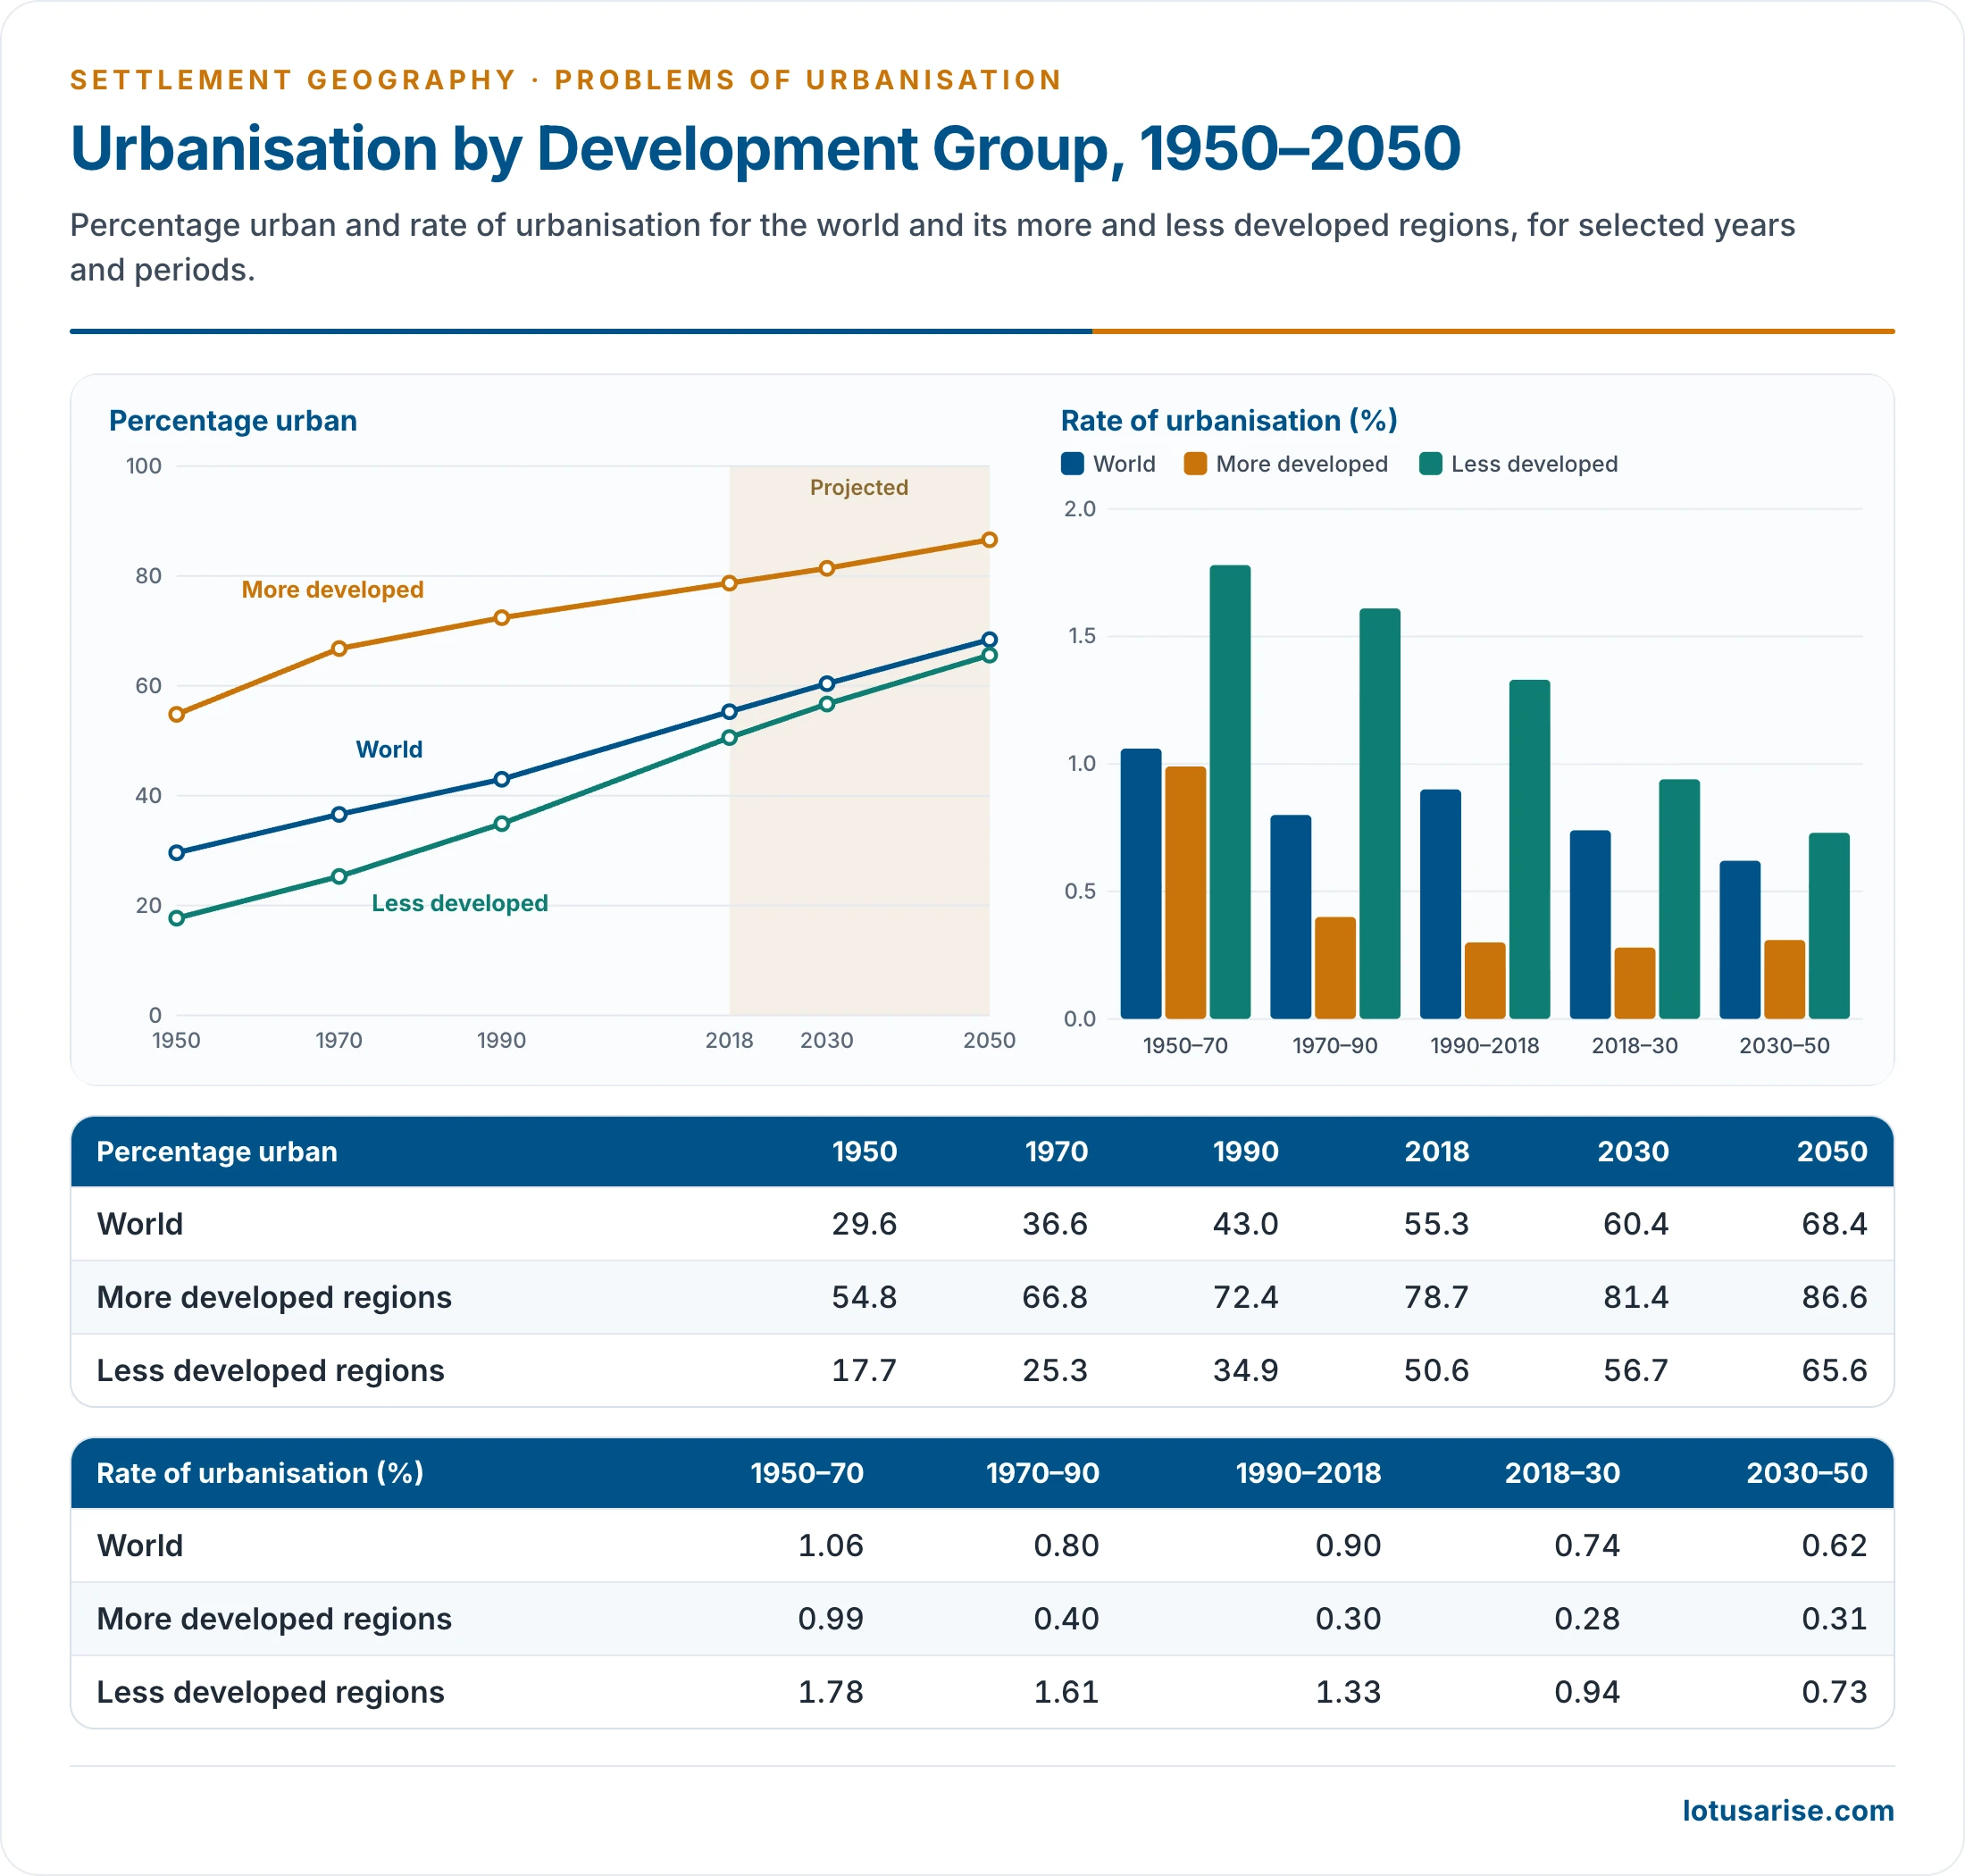
- The 17% often quoted for the early 1950s is the share of the less developed regions, not of the world, which was about 30%.
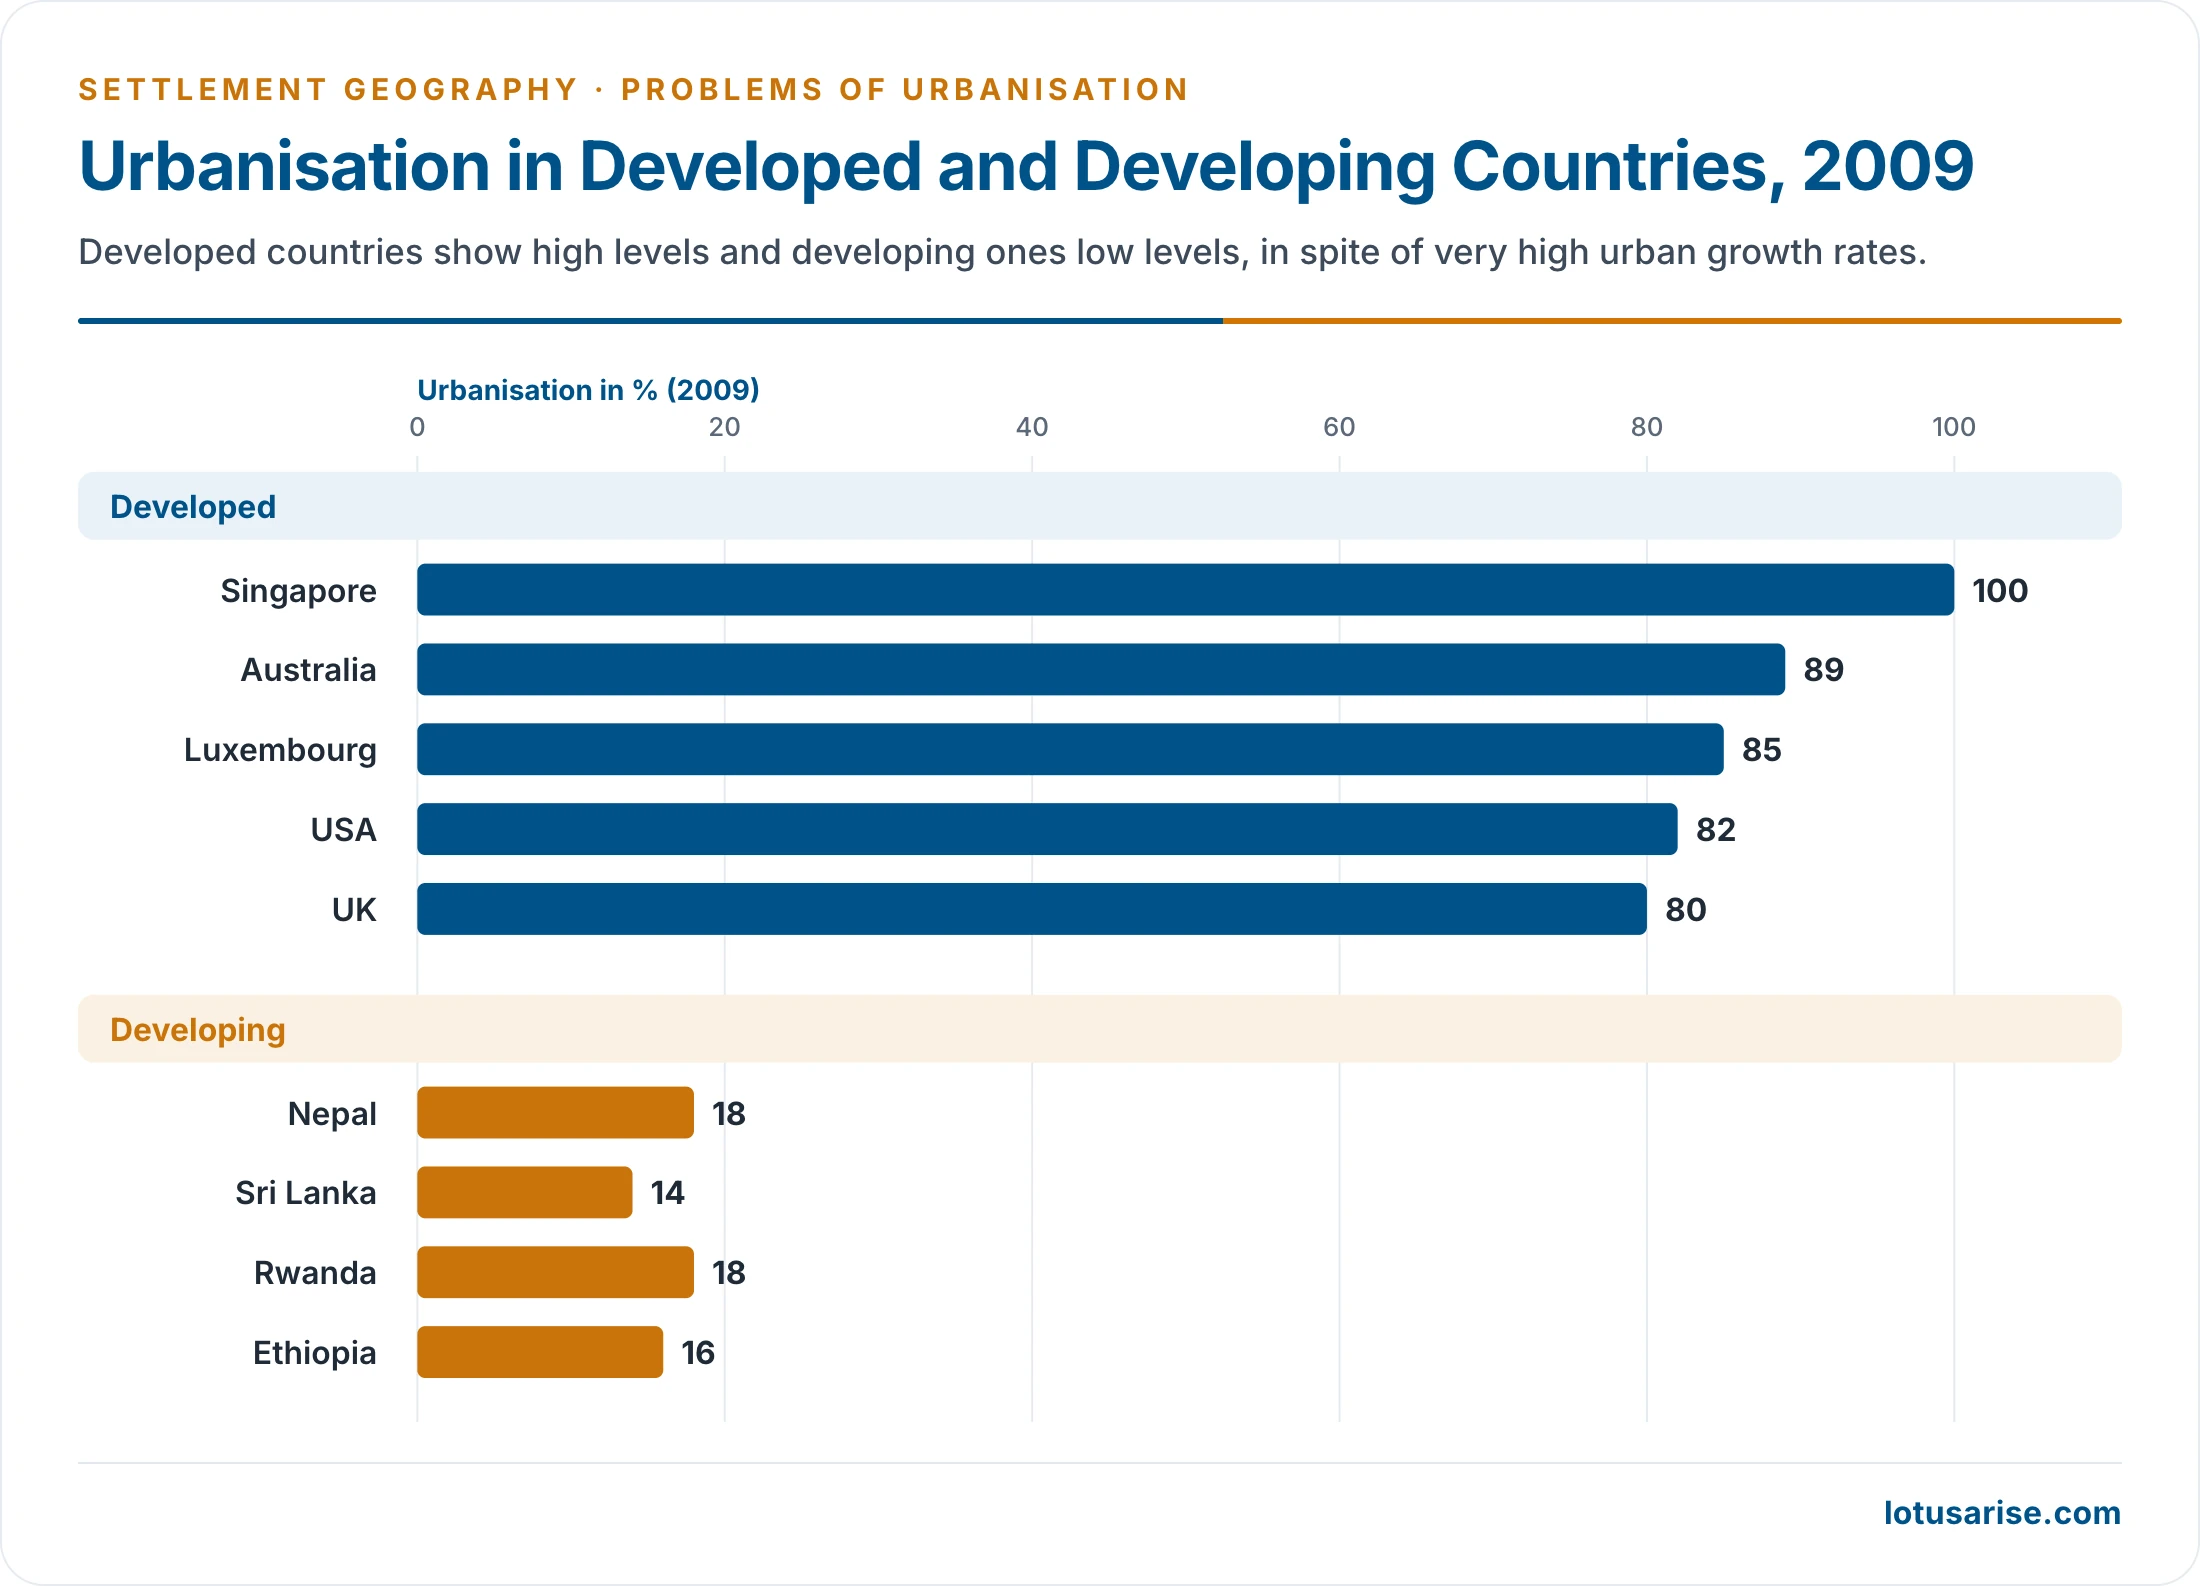
- Developed countries have high levels and developing ones low levels, in spite of very high urban growth rates:
- Sample levels for 2009: Singapore 100%, Australia 89%, Luxembourg 85%, USA 82%, UK 80%; Nepal 18%, Rwanda 18%, Ethiopia 16%, Sri Lanka 14%.
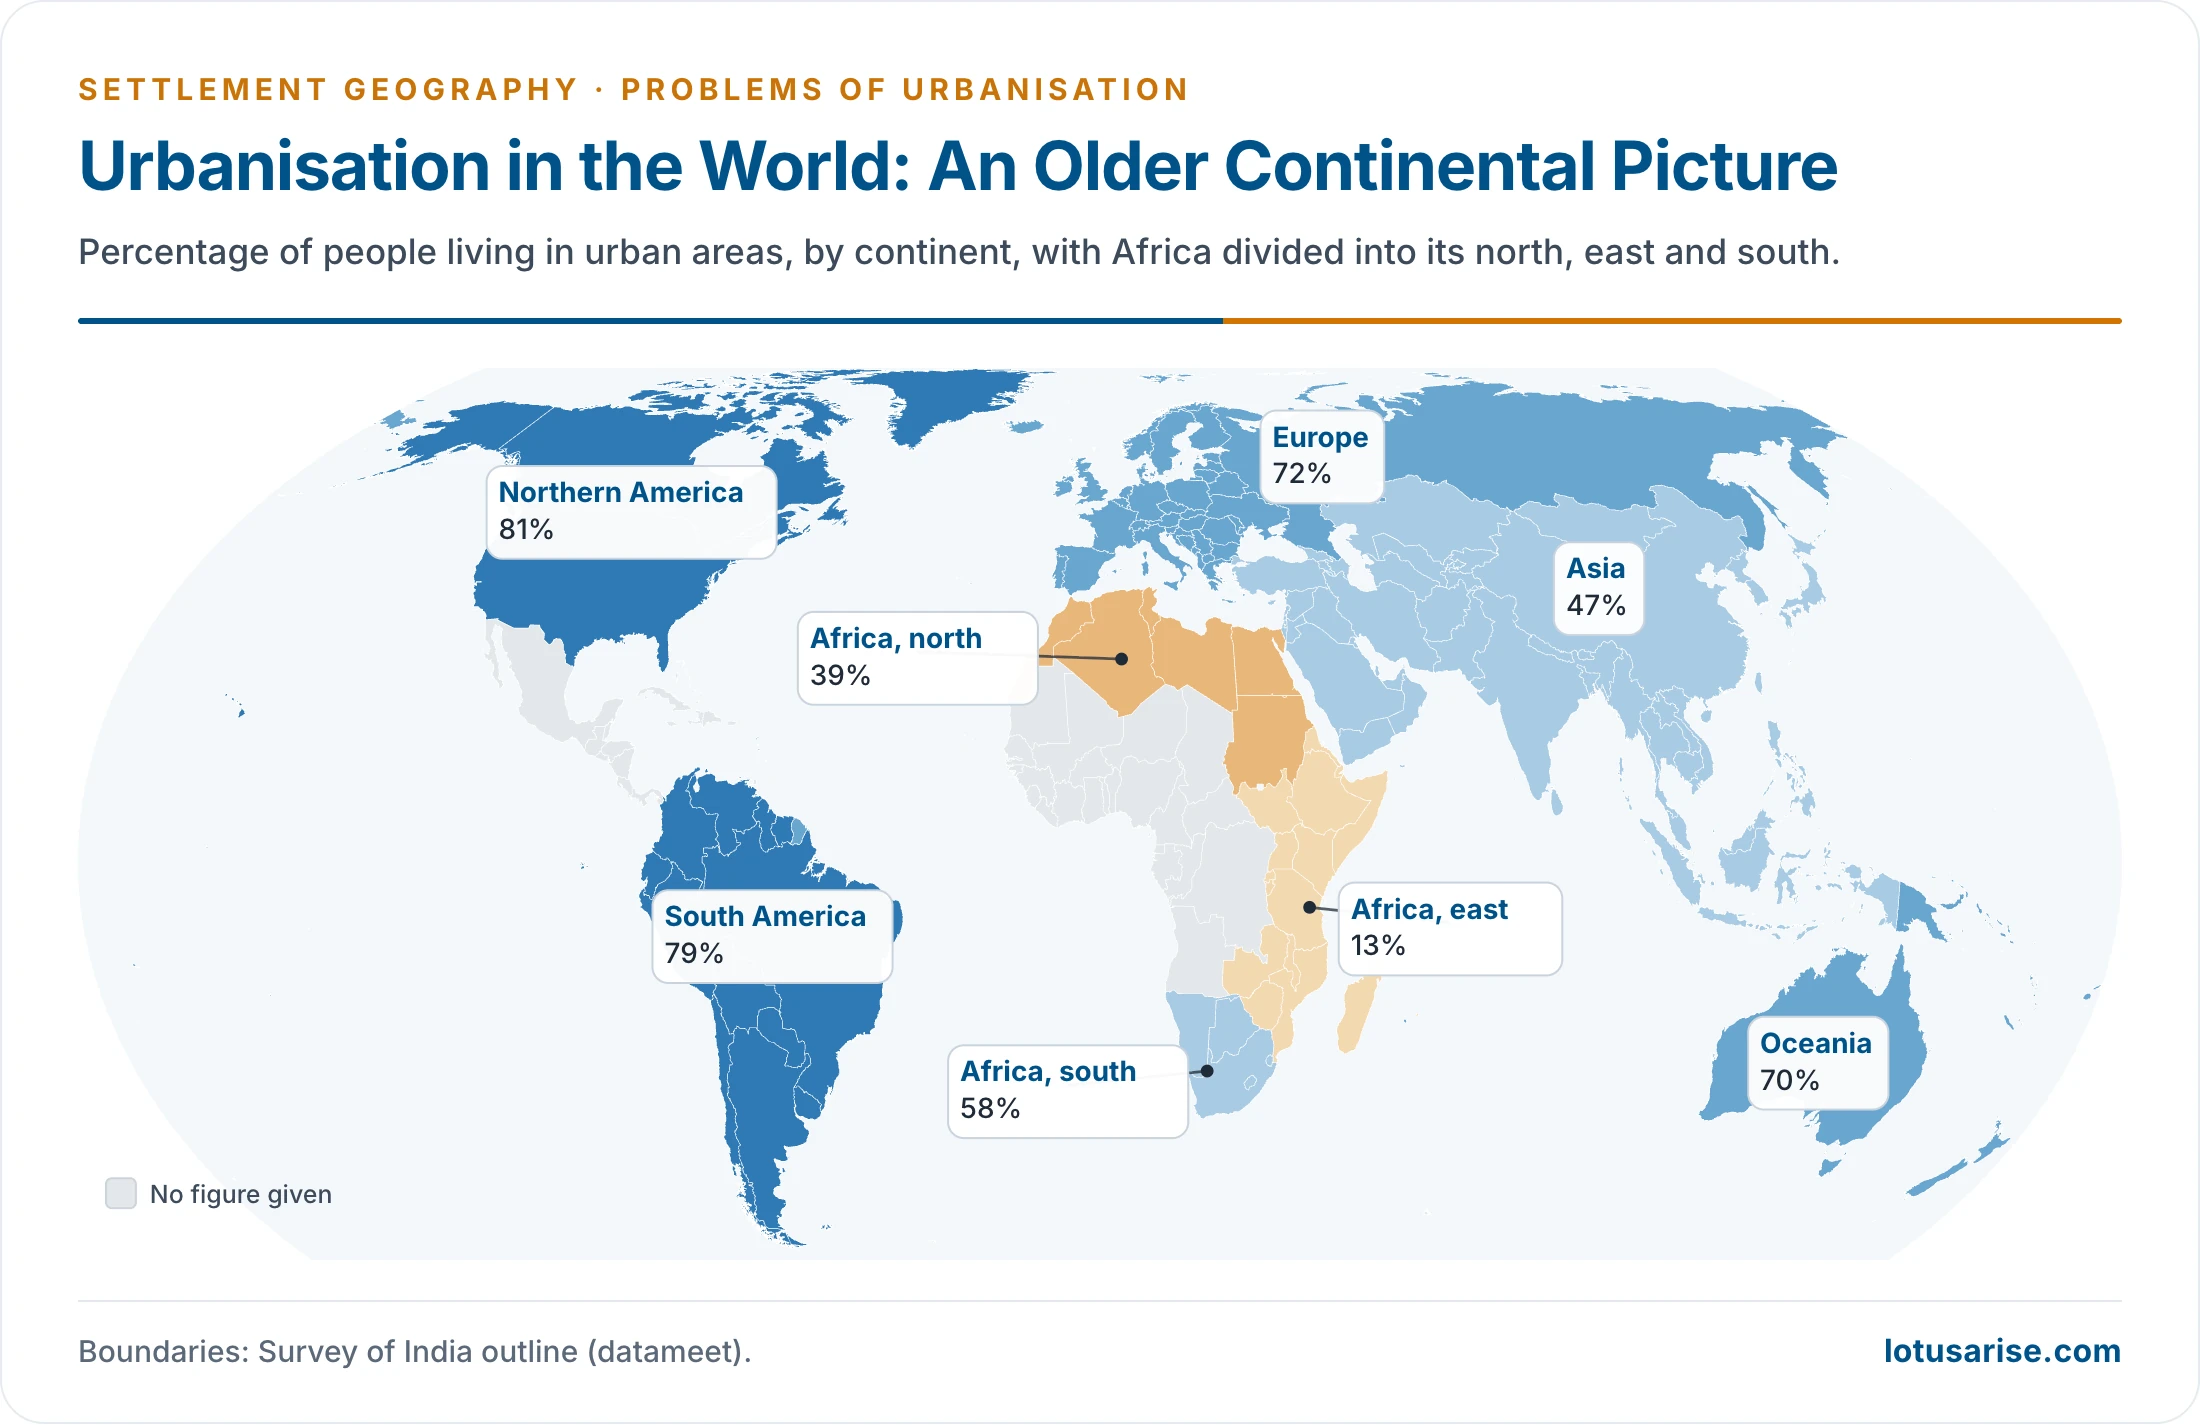
- An older continental picture: Northern America 81%, South America 79%, Europe 72%, Oceania 70%, Asia 47%; in Africa, 39% in the north, 58% in the south and 13% in the east.
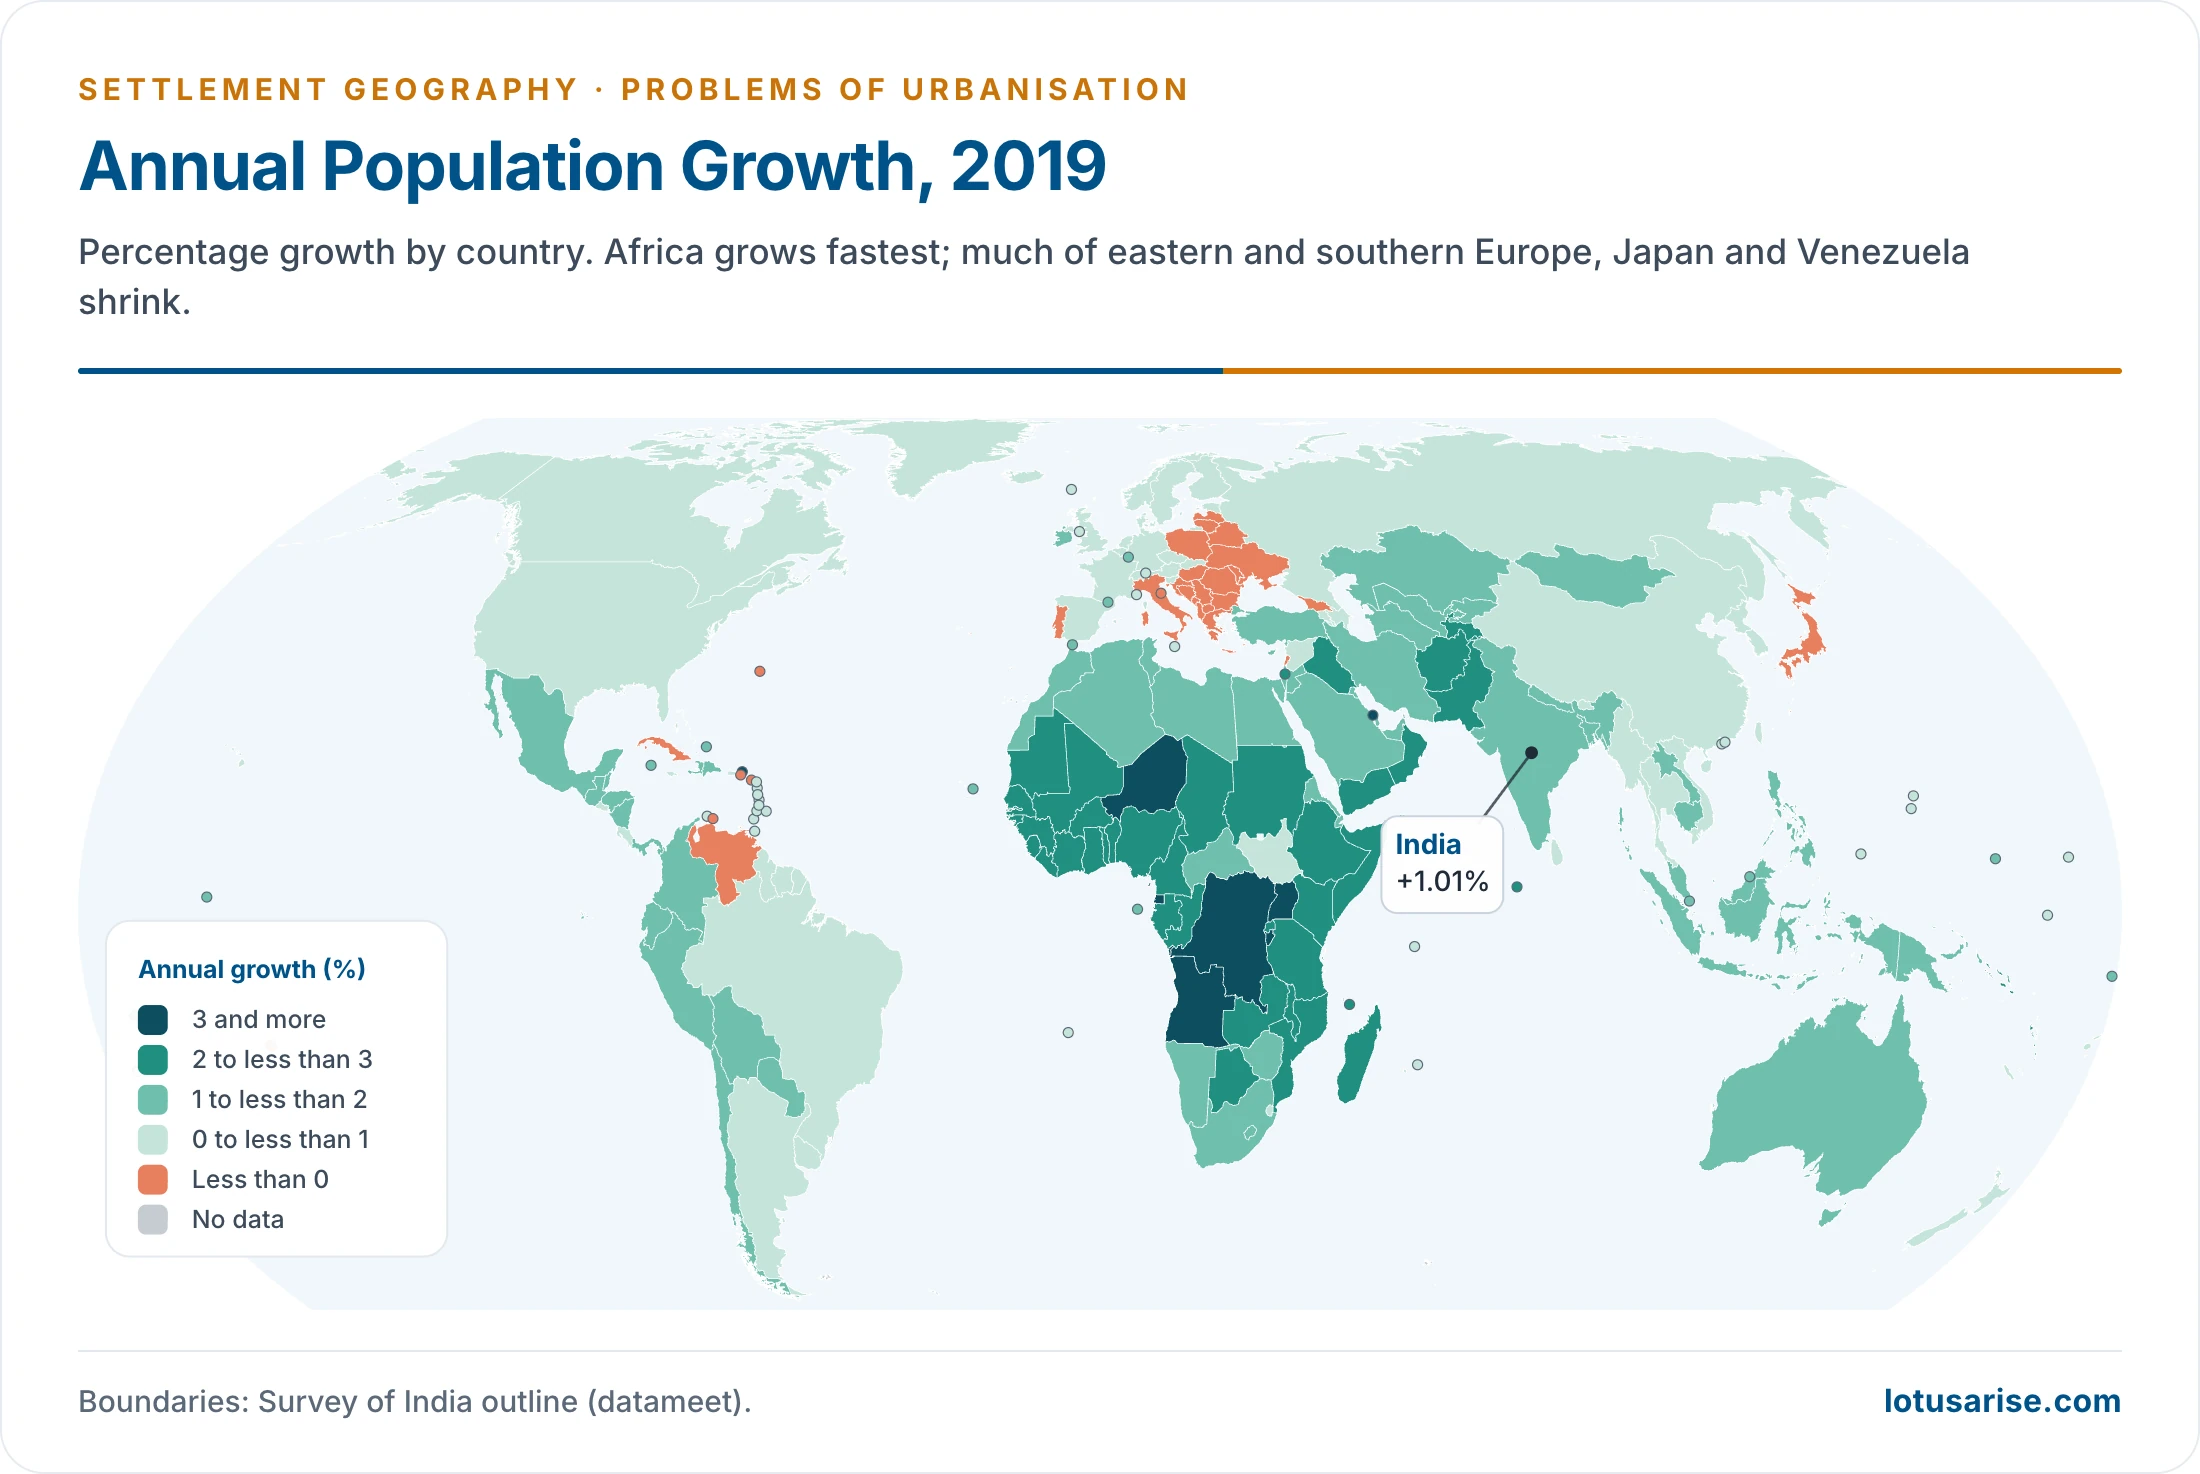
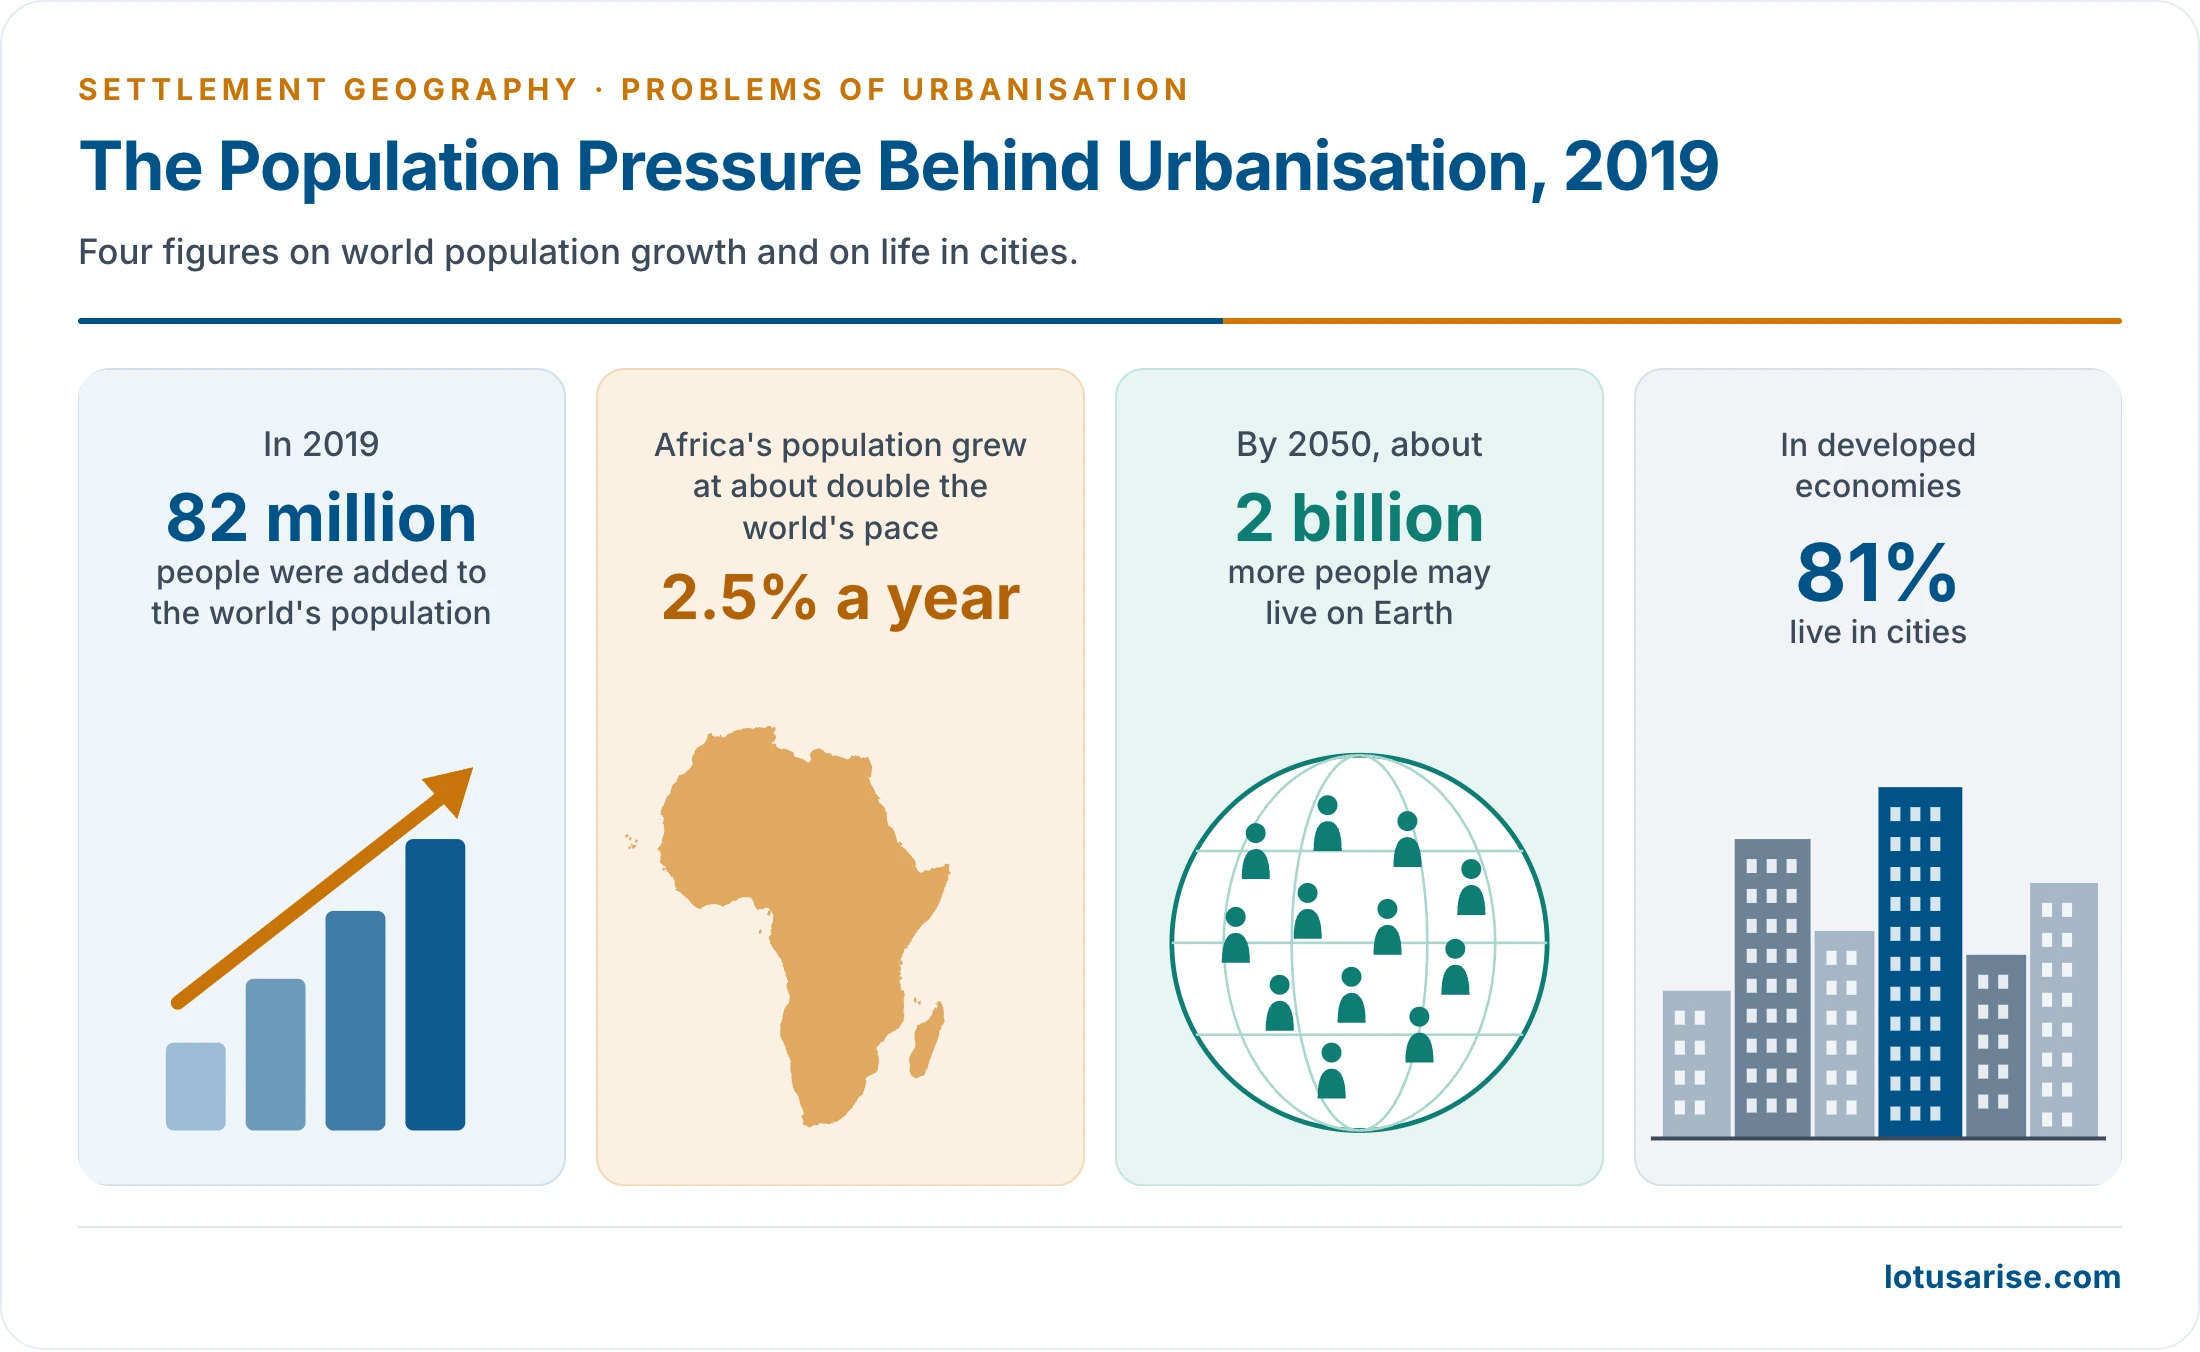
- Population pressure behind this, in 2019:
- The world grew by 82 million people and may add 2 billion by 2050.
- Africa grew at 2.5% a year, about double the world’s pace, and India at 1.01%.
- In developed economies 81% live in cities.
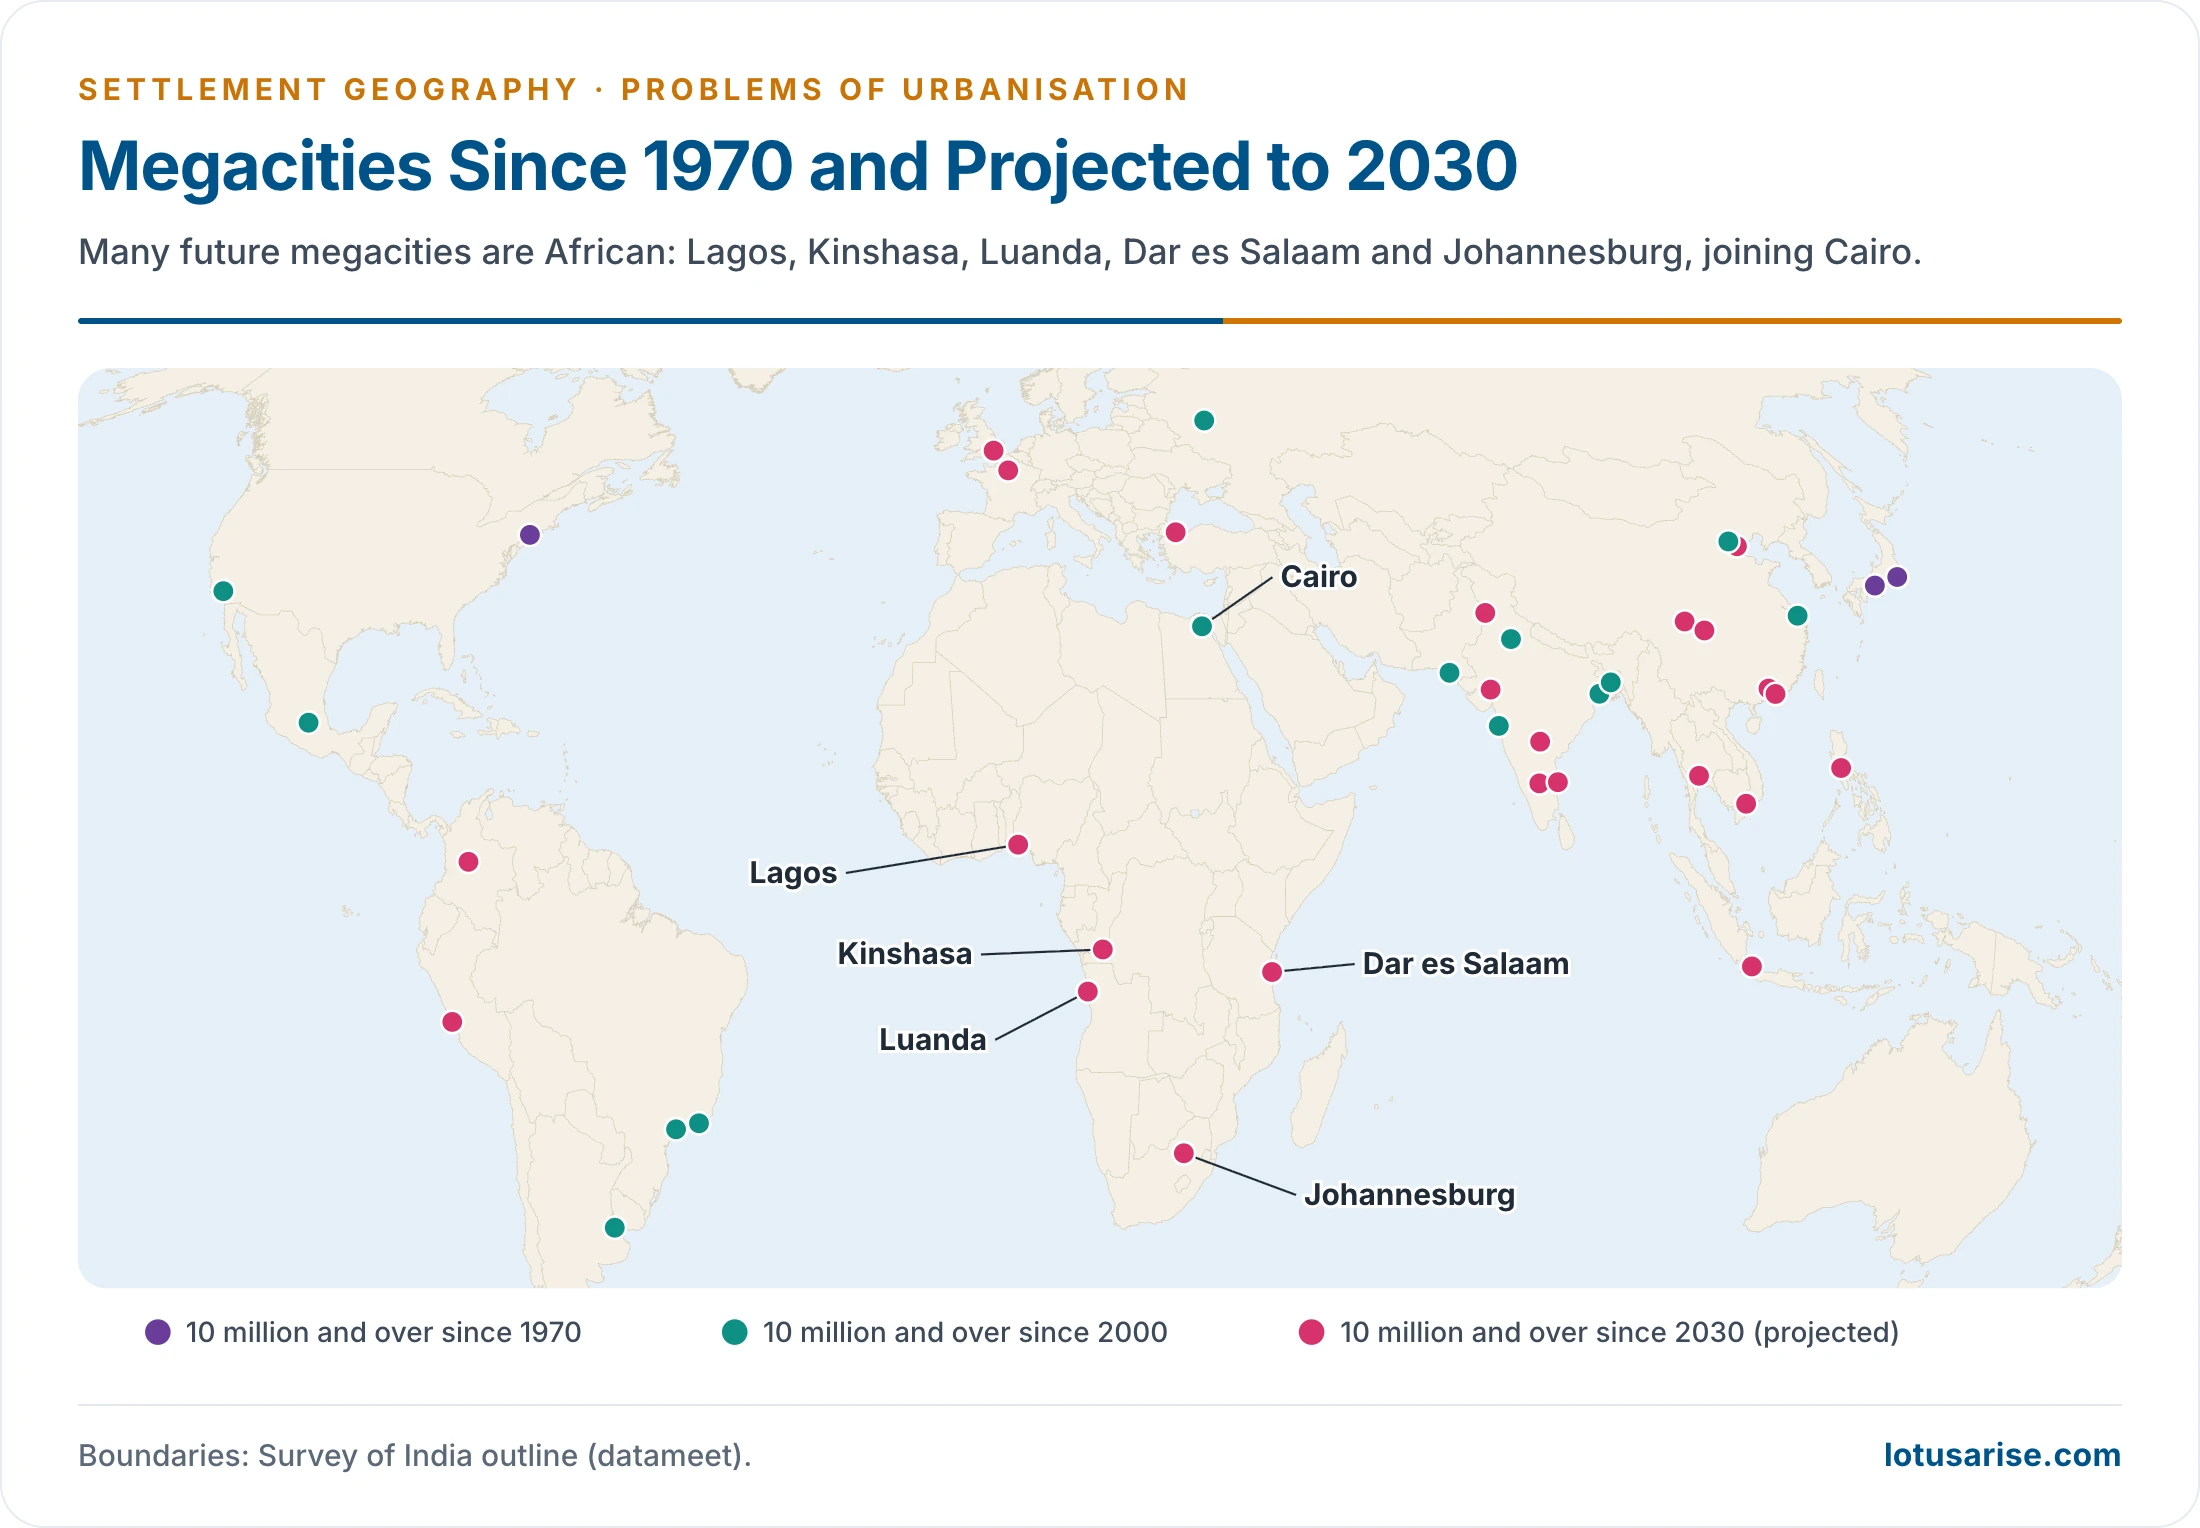
- Many future megacities are African: Lagos, Kinshasa, Luanda, Dar es Salaam and Johannesburg, joining Cairo.
- Rich countries urbanised slowly over a century, alongside industrial growth. Poor countries are urbanising faster, at lower incomes, and often through push migration.
Causes of Urbanisation
- Industrialisation: factory and modern-sector jobs draw people from agriculture. The old agrarian economy gives way to a non-agricultural one.
- Large manufacturing and service centres offer more and better-paid work, especially in megacities.
- Transport: cheap, easy movement between village and city.
- Migration:
- Push: poverty, small holdings, agrarian distress.
- Pull: jobs, wages, education, health care, the “bright lights”.
- Rural–urban, urban–urban and circular streams all feed city growth.
- Infrastructure and agglomeration: concentrated production raises productivity, incomes and demand. This in turn draws more investment.
- Growth of the private sector and of the service economy since liberalisation.
- Josef Gugler (1997) read all this as an old agrarian economy giving way to a non-agricultural one, with push and pull combining in migration. Rural–rural and urban–rural streams count too.
Problems of Urbanisation
Problems in Developed Countries
- Urban sprawl and loss of farmland:
- Built-up area has grown about twice as fast as population since 1975. The world’s built-up land per person rose from 43 to 63 m² (UN WUP 2025). The UN’s 2026 report finds the two rates nearly in step in 2020–25: land 0.83% and population 0.81% a year.
- An older example: more than 15% of the UK’s fertile farmland lay under built-up area, which raised concern over food supply in Western Europe.
- About 60% of land converted to urban use since 1970 was productive farmland.
- Sprawl blurs the rural–urban dichotomy into a continuum, raises transport and service costs, and carries urban pollutants into the countryside.
- Inner-city decline:
- Counter-urbanisation and suburbanisation leave falling tax bases, derelict industrial land and concentrated poverty in the old core.
- Detroit filed for bankruptcy in 2013.
- Shrinking cities and vacant housing: Japan had 9.0 million vacant homes (13.8%) in 2023. Eastern German and US Rust Belt cities show the same pattern.
- Environmental stress:
- Urban heat islands and wind tunnels between tall buildings.
- High per-capita carbon emissions from car-based living.
- Air and noise pollution, and acid rain from urban and industrial emissions.
- Demographic problems:
- Ageing populations and labour shortages, met by immigration, which brings issues of integration.
- The inverted age pyramid has been called a ‘neo population explosion’ of the old.
- Rich countries eased entry rules. Australia dismantled its White Australia policy between 1966 and 1973, and the Racial Discrimination Act of 1975 closed it.
- The break-up of extended families, with a rise of one-person and nuclear households.
- Ageing populations and labour shortages, met by immigration, which brings issues of integration.
- Social:
- Residential segregation.
- Gentrification that displaces poorer residents.
- Homelessness and housing unaffordability in global cities.
Problems in Developing Countries
- Population pressure on large cities:
- Metropolitan and capital cities grow fastest. They attract migrants for economic, social and political reasons, and industry for their infrastructure and markets.
- The result is primacy, the dominance of one or a few large cities.
- Overcrowding:
- It is absolute where densities are truly high, and relative where services fail even at lower densities.
- Delhi’s NCT had 11,320 people per km² in 2011, the highest in India, and more in its core. Ring towns have not decongested it.
- Mumbai had one-sixth of an acre of open space per 1,000 people, against four acres in its Master Plan.
- Housing shortage and slums:
- India’s urban housing shortage was estimated at 18.78 million units (2012), 96% of it in the economically weaker and low-income groups.
- A 1959 sample survey found 44% of urban households in one room or less, against 34% of rural ones, and 67% in larger cities. Cities then needed about 2.5 million new dwellings a year, and under 15% were being built.
- Census 2011 counted 110.1 million urban census houses, with only 68.5% in good condition.
- Rooms per household (% of urban households): none exclusive 3.1, one 32.1, two 30.6, three 18.4, four 9.3, five 3.2, six or more 3.3. Nearly two-thirds have two rooms or fewer.
- Causes: scarce land, materials and finance; slow extension of utilities and transport to the suburbs where vacant land lies; migrants’ poverty; caste and family ties.
- 17.4% of urban Indians lived in slums in 2011.
- Overcrowding: one-room homes, high occupancy per room, and pavement dwellers in Mumbai and Kolkata.
- Water supply:
- Intermittent, unequal supply and high non-revenue water.
- Groundwater depletion.
- Seasonal crises, as in Chennai (2019) and Bengaluru (2024).
- Norms in litres per head per day: an older public-health scale of 125–200 for cities above 50,000, 100–125 for 10,000–50,000 and 70–100 below that; the Zakaria Committee’s 204 for cities of 5 lakh to 2 million and 272 above; and today’s manual, 135 with sewerage, 150 in metros and 70 without.
- The gap in the four metros was put at 10–20%, and is worse in small towns that rely on wells and tube wells. The Accelerated Urban Water Supply Programme targeted towns under 20,000.
- Sanitation and sewage:
- Indian cities generate 72,368 million litres of sewage a day.
- Only 28% is actually treated (CPCB 2021).
- Untreated sewage makes stretches of the Yamuna, the Musi and the Mithi among the most polluted water bodies.
- No Indian city is fully sewered, and older estimates put coverage at 35–40% of urban people. Water mains laid beside old sewers get contaminated when pipes leak.
- Solid waste:
- About 1.62 lakh tonnes a day. Processing has risen from 16% (2014) to 80% (2025).
- 2,478 legacy dumpsites were identified, Ghazipur and Deonar among the largest.
- Full landfills leak leachate into groundwater and breed flies and rats, which spread dysentery, jaundice and typhoid.
- Transport:
- A rapid rise in private vehicles, congestion, and weak public transport outside the metros.
- About 1.68 lakh road deaths in 2022.
- The capacity of transport systems lags behind demand.
- Congestion peaks at the CBD and on roads to factories, offices and schools, in rush hours of about two hours. Old streets lack parking, and mixed traffic and stray cattle slow it further.
- City bus services run at a loss because fares must stay low. Mumbai has the best system, with Chennai, Ahmedabad and Pune fairly well served.
- Delhi had over 82 lakh vehicles in 2014, with roads on 21% of its area. Traffic falls to 5 km an hour on some Ahmedabad roads.
- An older World Disasters Report ranked Ethiopia highest for fatal accidents per 10,000 licensed vehicles.
- Air pollution: 131 non-attainment cities under the National Clean Air Programme. Delhi’s winter smog is the extreme case.
- Urban floods:
- Built-over lakes, wetlands and drains cause repeated floods: Mumbai (26 July 2005, 944 mm in 24 hours), Chennai (2015), Bengaluru (2022).
- Urban heat: heat islands and more frequent heatwaves. The risk is highest in informal housing with tin roofs.
- Unemployment, informality and urban poverty: migrants are absorbed in low-paid, insecure informal work.
- Older estimates put urban unemployment at 15–25% of the labour force, with about half of the educated urban unemployed in the four metros. The Periodic Labour Force Survey 2023–24 puts it at about 5.1% on usual status.
- Social problems: crime, insecurity (especially for women), substance abuse and social exclusion of migrants.
- Causes: materialism, sharp disparity, unemployment and loneliness in the crowd.
- Ashok K. Dutt and G. Venugopal (1983) found violent and economic crime strongest in the north-central cities, and poverty-related crime around Patna, Darbhanga, Gaya and Munger.
- A later survey of 35 cities found 31.8% of people in Mumbai and 30.5% in Delhi had been victims of crime.
- Health:
- Communicable diseases in crowded, insanitary areas: tuberculosis, dengue, diarrhoea.
- Rising non-communicable diseases from lifestyle change.
- Stress and mental illness, with injuries from overloaded systems.
- Education: schools lag behind numbers, and illiteracy feeds the cycle of unemployment and poverty.
- Unplanned outward expansion:
- Urban sprawl and the unregulated growth of the rural–urban fringe.
- Illegal colonies outside municipal limits.
- Vertical expansion without matching infrastructure.
- Governance and finance:
- Weak municipal finances. Cities raise little from property tax and user charges and depend on State and central grants.
- Incomplete devolution under the 74th Constitutional Amendment (1992). Many of the 18 Twelfth Schedule functions, such as urban planning, water and fire services, stay with State departments or parastatal boards.
- Multiple agencies with overlapping roles: development authorities, water boards, transport corporations and police.
- Outdated or unimplemented master plans, and weak enforcement of building and land-use rules.
- Census towns are urban in character but governed by gram panchayats, so they get no urban services or budgets.
| Problem | Root cause | Indian evidence |
|---|---|---|
| Slums, overcrowding | Land prices, low incomes, housing deficit | 6.5 crore slum dwellers (2011) |
| Water stress | Demand, leakage, groundwater mining | Chennai 2019, Bengaluru 2024 |
| Sewage, river pollution | Treatment capacity gap | 28% of sewage treated |
| Waste | Rising consumption, poor segregation | 2,478 legacy dumpsites |
| Congestion, air pollution | Car growth, weak transit, dust, burning | 131 non-attainment cities |
| Floods, heat | Loss of wetlands and drains, impervious cover | Mumbai 2005, Chennai 2015 |
Problems of Urban Agglomerations
- Fragmented governance: a metropolis spreads over many municipal bodies, panchayats, development authorities and even States (the National Capital Region). The Metropolitan Planning Committees provided under Article 243ZE are rarely set up or effective.
- Over-dependence on the core: jobs stay in the centre while people move outward. This means long commutes, overcrowded suburban trains and peak-hour congestion.
- Water imported from far away: Bengaluru lifts Cauvery water about 100 km. Delhi draws on the Yamuna, the Bhakra system and the Upper Ganga Canal. Chennai depends on the Krishna water project and desalination, and has used water trains. Mumbai draws from up to 125 km away in the Western Ghats. Bengaluru lifts its water about 700 m. Hyderabad draws from Nagarjuna Sagar, 137 km away. Delhi has also used Tajewala and the Ramganga, about 180 km away, with Tehri, Renuka and Kishau as further sources.
- Sprawl and coalescence of towns into conurbations, which swallow farmland and wetlands.
- Inequality in space: gated enclaves beside slums, and unequal access to services across wards.
The Other Side of the Ledger
- Urban areas were estimated to give about 60% of national income, with a per capita income about three times the rural, though high living costs and growing disparity blunt the gain.
- Cities are engines of growth. They concentrate productivity, innovation, higher wages and better access to schools and hospitals.
- Urban living goes with lower fertility, more education and more economic independence for women.
- The problems are largely problems of management, finance and planning, not of urbanisation as such. Well-run dense cities use less land and energy per head.
Impact on the Rural Landscape and Urban Ecology
- Rural landscape:
- Conversion of farmland to housing, industry and roads around cities. Prime irrigated land in the Ganga plain, Punjab and the deltas is often lost first.
- Land speculation and rising land prices in the fringe. Farmers sell out, or shift to vegetables, dairy and floriculture for urban markets.
- Commuting and circular migration link villages to city jobs. Remittances change village houses, consumption and aspirations.
- Villages become semi-urban: brick houses, shops, non-farm work and census-town status. This is the rural–urban continuum.
- Out-migration of young men leaves farming to women and the elderly in source regions such as Bihar and eastern Uttar Pradesh.
- Urban ecology:
- Impervious surfaces replace soil and vegetation, raising runoff and flash floods and lowering groundwater recharge.
- Loss of lakes and wetlands: Bengaluru’s tanks, Chennai’s Pallikaranai marsh, Kolkata’s East Kolkata Wetlands under pressure.
- Urban heat islands: city centres stay several degrees warmer than their surroundings at night.
- Air, water and soil pollution from vehicles, industry, untreated sewage and dumpsites.
- Loss of green cover and biodiversity. A few adaptable species prosper, such as feral pigeons, black kites and macaques.
Urban Poverty and Exclusion in Asia and Africa
- Asia and Africa will hold three-quarters of the world’s urban people by 2050. Much of this growth comes without matching industrial jobs.
- 1.12 billion people lived in slums or informal settlements in 2022. Over 85% were in East and South-East Asia (362 million), Central and Southern Asia (334 million) and Sub-Saharan Africa (265 million). The UN’s 2026 report counts 1.16 billion (24.8% of urban residents) in 2024.
- 53.6% of Sub-Saharan Africa’s urban residents live in slums, the highest share of any region.
- Most urban workers are in the informal sector: street vendors, construction labour, domestic work and waste-picking. They have no social security.
- Exclusion follows from the lack of tenure, of documents and of an address. It denies people services, credit and votes, and exposes them to eviction.
- Vulnerability is concentrated in hazard-prone informal settlements: floods in Lagos, Dhaka and Mumbai; heat in Delhi and Karachi; disease in crowded slums during COVID-19.
Remedies
Principles
- Plan comprehensively:
- Scientific, long-term master plans set within a regional planning perspective.
- Strict enforcement of land-use law.
- Compact, mixed-use growth around transit (transit-oriented development).
- Balance the urban system:
- Develop small and medium towns, counter-magnets and satellite towns to relieve the metros. The National Capital Region’s counter-magnets are an example.
- Rural development reduces distress migration:
- PURA (Provision of Urban Amenities in Rural Areas).
- The Shyama Prasad Mukherji Rurban Mission (2016), a form of rurbanisation.
- Rural employment schemes.
- Regulating migration, population control and poverty eradication ease pressure at source, and the basic needs of the urban poor come first.
- House the urban poor:
- In-situ slum upgrading and secure tenure.
- Affordable rental housing for migrants.
- Inclusionary zoning that reserves land for the economically weaker sections.
- Reform water and sanitation:
- Metered, continuous supply and lower losses.
- Reuse of treated water and rainwater harvesting.
- Universal sewer or septage services.
- Manage waste through source segregation, decentralised composting, recycling and the remediation of legacy dumps.
- Move people, not vehicles:
- Mass rapid transit (metro, regional rapid transit, bus rapid transit) and good buses.
- Walking and cycling, with parking and congestion pricing.
- Green and resilient cities:
- Clean-air action plans.
- Protection of lakes, wetlands and floodplains.
- Heat action plans: Ahmedabad’s (2013) was the first in South Asia.
- Flood mapping, green cover and cool roofs.
- Strengthen urban governance and finance:
- Real devolution of the 18 functions of the Twelfth Schedule.
- Property-tax reform and user charges.
- Municipal bonds (Pune, 2017) and land value capture.
- Investment in maintaining assets, not only in creating them.
- Use data and technology: integrated command centres, GIS-based plans and e-governance. This is the “soft infrastructure”.
- Urban public health: the National Urban Health Mission (2013) for slum and poor populations.
- Global co-operation for capital and technology in housing and infrastructure, within SDG 11 and the New Urban Agenda for the sustainable development of cities.
Remedies in Developed Countries
- Urban containment: green belts, as round London since the 1940s, and urban growth boundaries, as in Portland, Oregon. Both stop sprawl onto farmland.
- Compact city and smart growth: higher densities, mixed uses and brownfield redevelopment of old industrial land in place of greenfield building.
- Inner-city regeneration: waterfront and dockland renewal, as in London Docklands and Hamburg’s HafenCity, with inclusionary or social housing to limit gentrification.
- Transport and climate: congestion charging (London 2003, Stockholm), good public transport, cycling, and the 15-minute city idea.
- Shrinking cities: managed decline that demolishes surplus housing and turns vacant land into parks and urban farms, as in Detroit and eastern Germany.
- Ageing and labour: age-friendly design and managed immigration with integration policies.
Metropolitan Governance in India
- Constitute and empower Metropolitan Planning Committees and Unified Metropolitan Transport Authorities, as recommended by the National Urban Transport Policy (2006).
- Bring census towns and peri-urban villages under urban planning before they are built over.
- Give city governments a stable fiscal base and professional municipal cadres.
Indian Programmes
- Earlier steps:
- The National Commission on Urbanisation (1988) asked for a spatial pattern of development and a hierarchy of settlements, an optimum spread of people among towns, activity in small and medium growth centres, counter-magnets, and minimum services. It wanted at least 8% of Plan outlay for cities, against the 3–4% usually given.
- Programmes: Urban Basic Services for the Poor, Environmental Improvement of Urban Slums, Integrated Development of Small and Medium Towns, housing finance from HUDCO, the Mega Cities Project and the Integrated Urban Poverty Eradication Programme.
- JNNURM (2005 to 2014) funded renewal, water, sanitation, waste, transport and heritage in 65 cities through city development plans, with a separate scheme for smaller towns. It approved bus rapid transit in cities such as Ahmedabad, Bhopal, Indore, Jaipur, Pune, Rajkot, Surat and Visakhapatnam.
| Programme | Period | Focus | Status (latest) |
|---|---|---|---|
| PMAY-Urban | 2015– | Housing for all, including in-situ slum redevelopment | 1.22 crore houses sanctioned, 94 lakh completed |
| PMAY-U 2.0 | 2024–29 | 1 crore more houses; rental housing; interest subsidy | ₹2.30 lakh crore central assistance |
| AMRUT 2.0 | 2021–26 | Water taps in all statutory towns; sewerage in 500 cities | ₹2.77 lakh crore at launch, later stated as ₹2.99 lakh crore; 2.68 crore tap connections targeted |
| SBM-Urban 2.0 | 2021–26 | Garbage-free cities, used-water management | 80% of waste processed |
| Smart Cities Mission | 2015–March 2025 | 100 cities; area-based and pan-city projects | 7,790 of 8,064 projects completed (31 March 2026) |
| Metro rail, PM e-Bus Sewa | Ongoing; 2023 | Mass transit; 10,000 e-buses | 1,090 km of metro in 26 cities (2025) |
| National Clean Air Programme | 2019– | 40% cut in PM10 by 2025–26 | 131 cities with action plans |
| Urban Challenge Fund | 2025–26 to 2030–31 | Market-financed projects; city cores, growth hubs, water | ₹1 lakh crore central assistance for ₹4 lakh crore of projects |
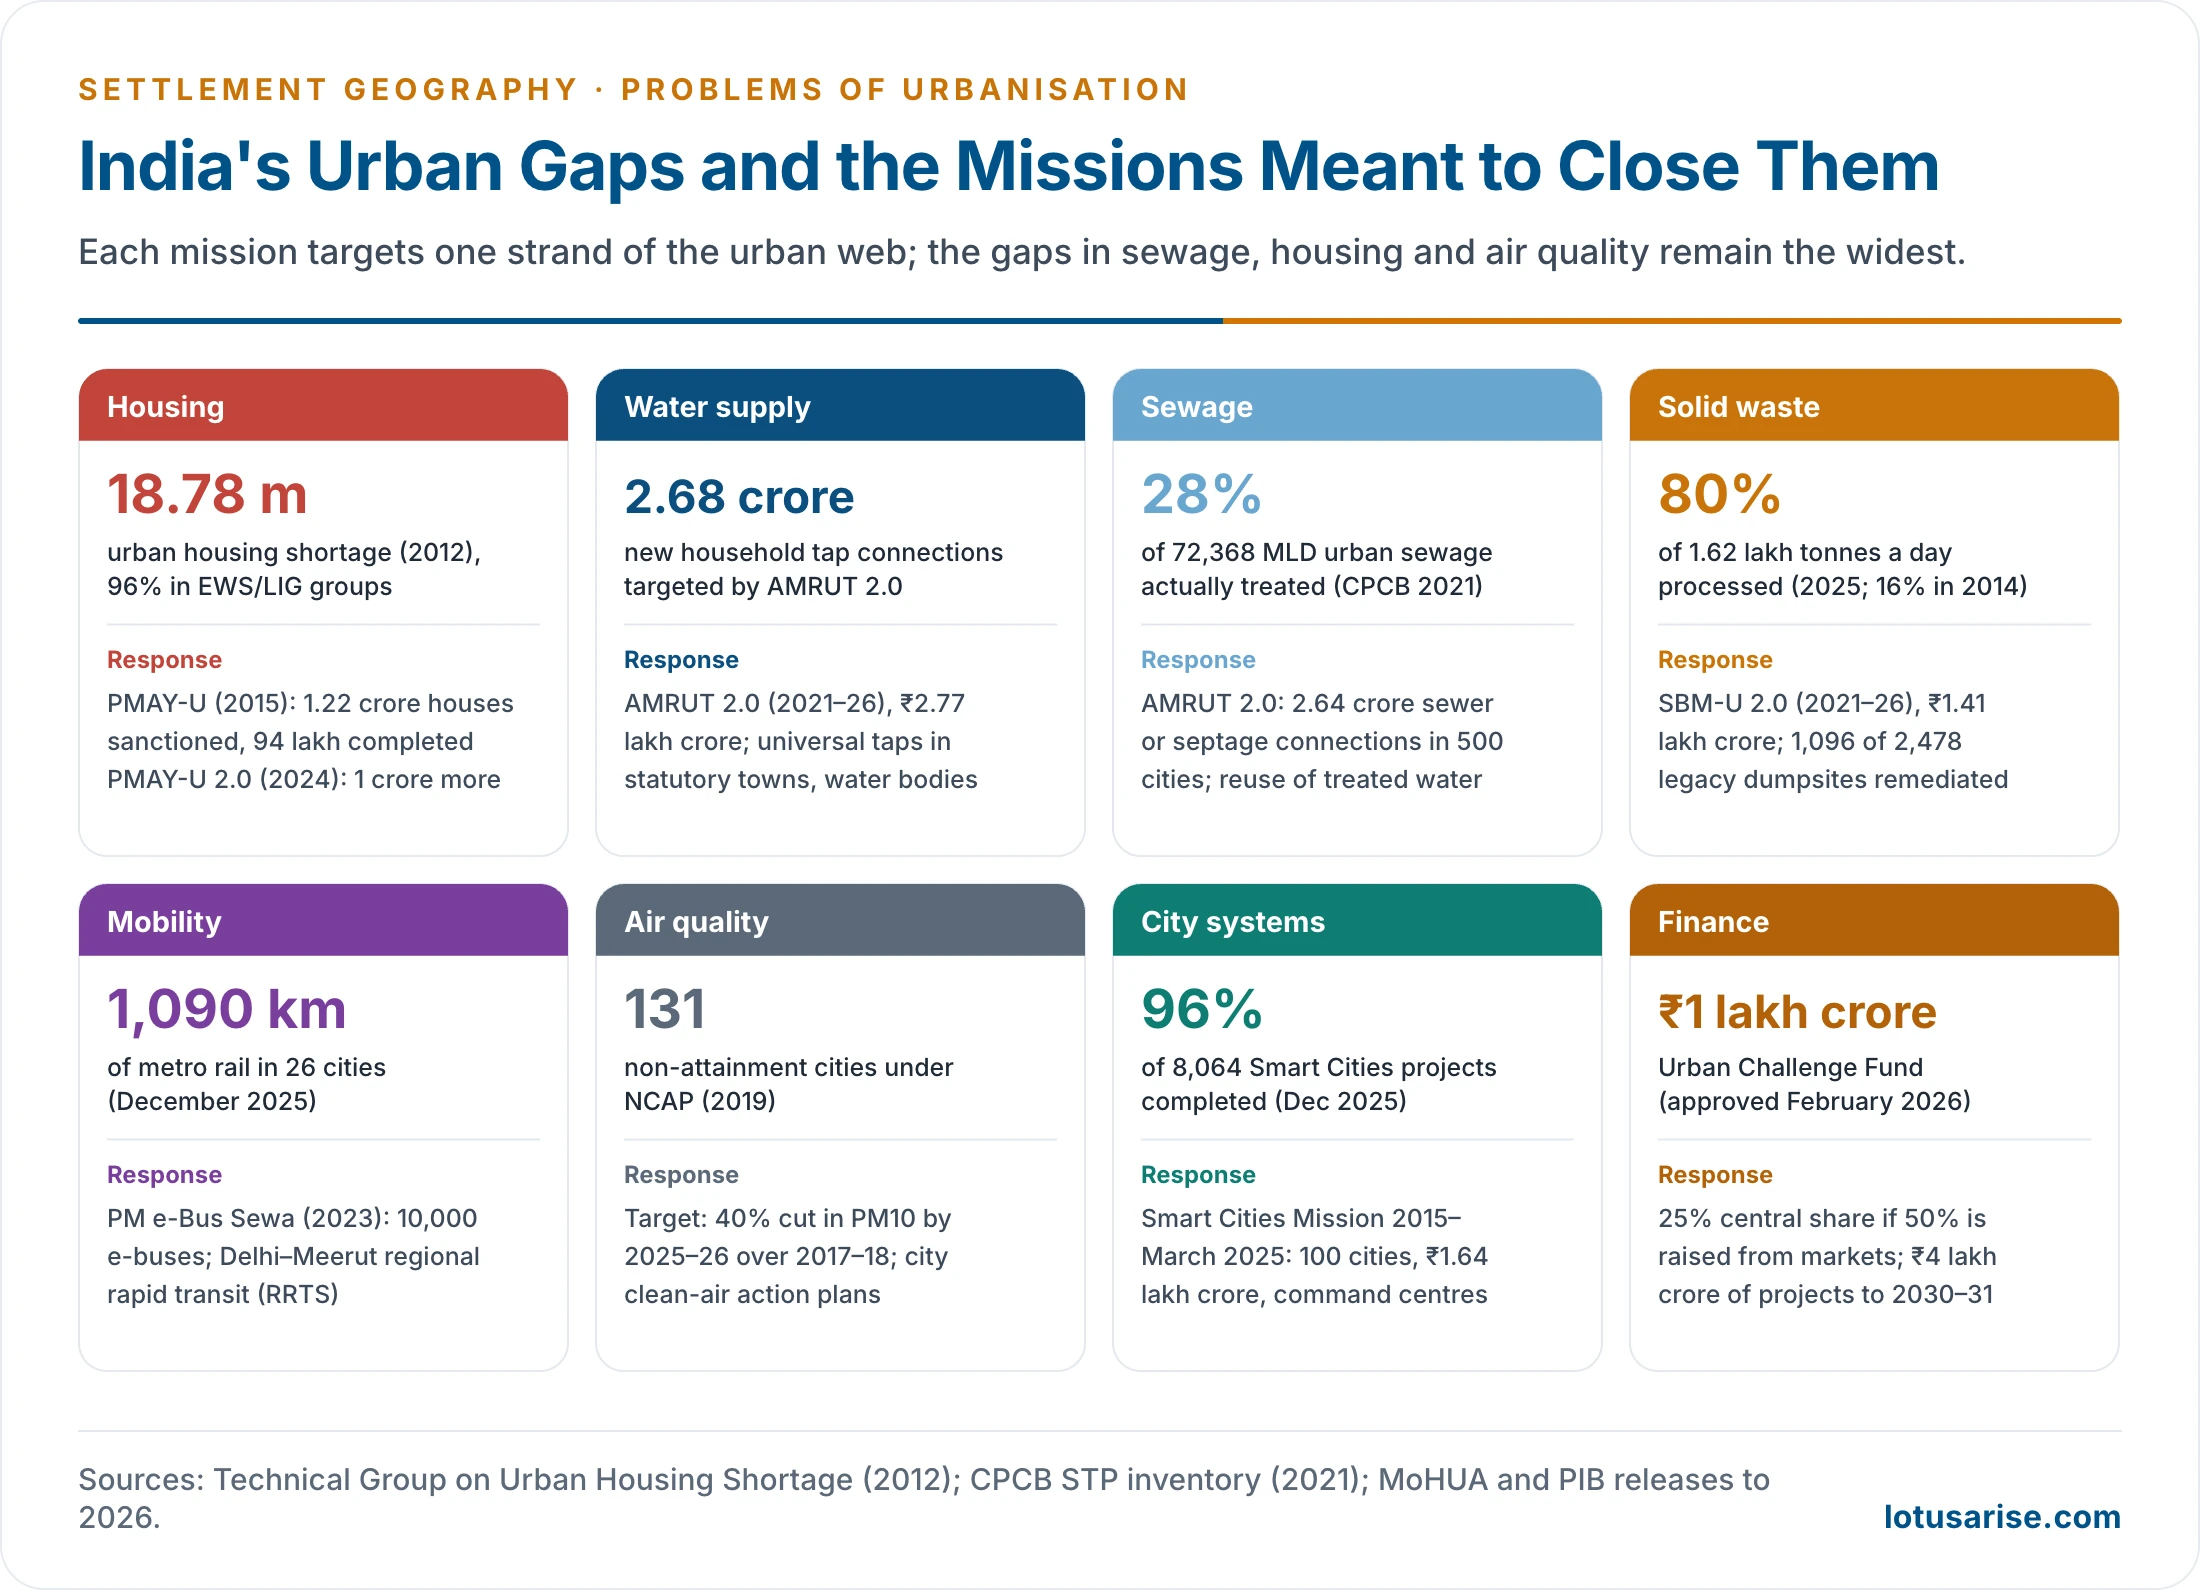
Evaluation
- Progress:
- Large gains in toilets, waste processing, tap connections, metro networks and housing sanctions.
- A shift to outcome-based funding and to market finance through the Urban Challenge Fund.
- Gaps:
- Sewage treatment still lags generation.
- Housing is often built far from jobs, so units lie vacant.
- Air quality targets are largely unmet.
- Smart City projects covered small areas of each city.
- Cities still depend on State and central grants.
- The core lesson: problems are interlinked. Housing, transport, water, waste and governance have to be planned together, at the scale of the city region.
Previous Year Questions
2008‘Unplanned urban development has created numerous problems.’ Comment.2013Describe how urbanization creates air and water pollution in India.2013“Urban solid waste management poses the greatest challenge in metropolitan planning.” Elaborate.2014Account for the multiple problems of urban agglomerations.2016Describe the causes and effects of urbanization in India and explain its impact on rural landscape and urban ecology.2020Discuss the problems associated with the living environment in million-plus cities in India. How can these be managed?2021Critically examine the importance of the Smart Cities Programme for solving urban problems in India.2022“Overcrowding leads to chronic problems of shortage of housing in Indian cities.” Explain citing relevant examples.2023Examine the environmental challenges caused by solid waste in the metropolitan regions of India and discuss the efforts to overcome them.2023Poor quality of urban planning in India is a huge constraint in realising the true economic potential of urbanisation. Critically examine.2023The urban built environment in big cities of India creates key changes in the biophysical character of the landscape. Discuss.2024The urbanisation process is particularly pronounced in Asia and Africa, where too many urban residents grapple with extreme poverty, exclusion, vulnerability and marginalisation. Discuss.2024What are the major regional rapid transit systems developed in India? How are urban problems being addressed by them?2026Poor road infrastructure and inadequate public transport system remain the key issues in Indian metropolitan areas. Discuss with suitable examples.





Perfect solution 👌
Nice
Good work guys🌷👍🏿
thank u so much …
Thanks