

- Forests have a dual identity: they are ecological systems and socio-economic resources at the same time. Managing them therefore needs judicious, science-based planning, neither purely extractive nor purely preservationist.
- A forest is not just standing timber but a dynamic biogeographical entity: it regulates climate, sustains the water cycle, holds genetic diversity and supports millions of forest-dependent people.
- Deforestation, the clearing of forest for other uses, has eroded the world’s forests since the mid-Holocene spread of farming, and dramatically since the Industrial Revolution; today it is concentrated in the tropics.
Forests and Deforestation: Concepts and Trends

Forests as a resource
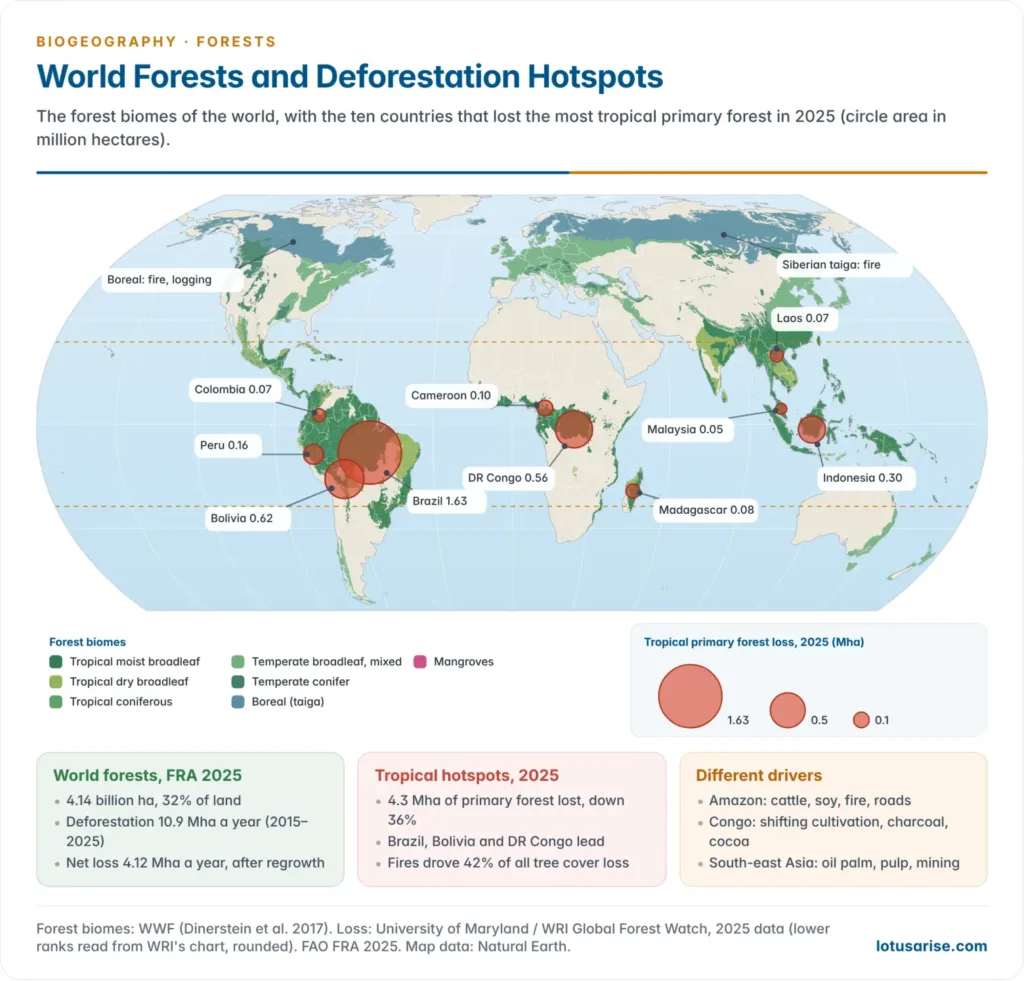
- Forests now cover about 4.14 billion ha, or 32% of the world’s land (FAO Global Forest Resources Assessment 2025): roughly one-third, about 0.5 ha per person. Nearly half of this lies in the tropics.
- What forests provide:
- Habitat and biodiversity: homes for wildlife, complex food webs and genetic reservoirs.
- Provisioning resources: timber, firewood, fodder, medicinal drugs, resins and non-timber forest produce (NTFP) such as tendu leaves, lac, honey and bamboo.
- Aesthetic and cultural value, including sacred landscapes central to indigenous belief.
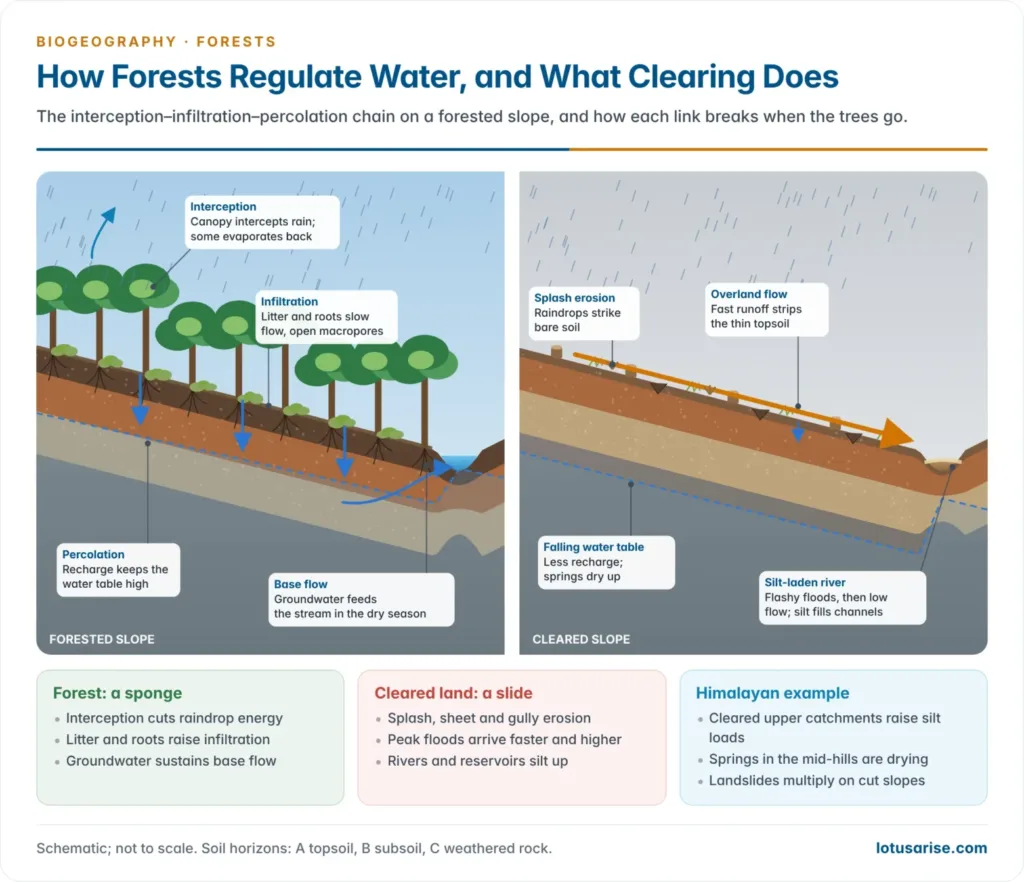
- Regulating services: forests protect watersheds from soil erosion, keep rivers and reservoirs free of silt through canopy interception and root binding, and recharge groundwater by slowing surface runoff.
- The forest as a hydrological regulator works through an interception–infiltration–percolation chain:
- The canopy absorbs the kinetic energy of falling raindrops, reducing splash erosion.
- The litter layer slows overland flow, so more water infiltrates.
- Roots open macropores that channel water down to the aquifer (percolation), which later feeds streams as base flow.
- When the forest goes, each link breaks in turn, so the hydrological effects of deforestation (flashy floods, siltation, falling groundwater) are tightly linked.
What deforestation means
- In practice deforestation is a broad and loosely used term. It covers:
- the cutting of trees, including repeated lopping, felling and removal of forest litter;
- browsing, grazing and trampling of seedlings, which stops natural regeneration even where mature trees are not felled.
- Formal definition: deforestation is the removal or damage of vegetation in a forest to the point where it no longer supports its natural flora and fauna.
- A threshold is crossed: the ecosystem loses its capacity for self-renewal, and its characteristic species assemblage collapses or migrates.
- FAO defines it as the conversion of forest to another land use, or the long-term reduction of tree canopy cover below the 10% threshold.
- Related processes must be kept apart:
| Process | What happens | Example |
|---|---|---|
| Deforestation | Forest converted to non-forest use: farms, settlements, infrastructure | Amazon forest turned to cattle pasture |
| Forest degradation | Forest remains on paper, but biomass, density and species composition decline | Selective logging; invasion by Lantana |
| Afforestation | Planting trees on land that was not forest | Plantations on wasteland |
| Reforestation | Replanting land that was recently forest | Replanting after a fire or a mining lease |
| Fragmentation | A continuous forest broken into isolated patches | Roads and canals cutting through tiger habitat |
- Why the distinction matters: national statistics can show stable or rising “forest cover” even while natural dense forest degrades.
- India’s forest-cover figures count any land over 1 ha with more than 10% tree canopy, whatever its ownership, so plantations, orchards and tree crops count alongside natural forest: a frequent criticism of the India State of Forest Report.
Global trends in forest loss
- Deforestation is slowing but remains high. FAO’s FRA 2025 puts it at 10.9 million ha a year in 2015–2025, down from 17.6 million ha in the 1990s; regrowth cuts the net loss to 4.12 million ha a year.
- Primary forests still cover at least 1.18 billion ha, a third of all forests; their rate of loss has halved since the early 2000s.
- Satellite monitoring (University of Maryland data on Global Forest Watch) tells the same story with sharp swings:
- 2024 was a record year: 6.7 million ha of tropical primary forest was lost, nearly half to fire, for the first time more than to agriculture.
- In 2025 the loss fell 36% to 4.3 million ha. Brazil cut its loss by 42%; Bolivia, the Democratic Republic of the Congo and Cameroon stayed high.
- Loss is still about 70% above the path needed to halt deforestation by 2030.
- Tropical forests account for over 90% of global deforestation since 2000; temperate forests in Europe, China and North America are stable or expanding.
| Indicator | Earlier | Latest |
|---|---|---|
| World forest area | About one-third of land | 4.14 billion ha, 32% of land (2025) |
| Deforestation (FAO) | 17.6 Mha a year (1990–2000) | 10.9 Mha a year (2015–2025) |
| Net forest loss (FAO) | 10.7 Mha a year (1990s) | 4.12 Mha a year (2015–2025) |
| Tropical primary forest loss (GFW) | 6.7 Mha, record (2024) | 4.3 Mha (2025) |
| Leading countries, 2025 | — | Brazil 1.63 Mha, Bolivia about 0.62 Mha, DR Congo third |
Causes of Deforestation
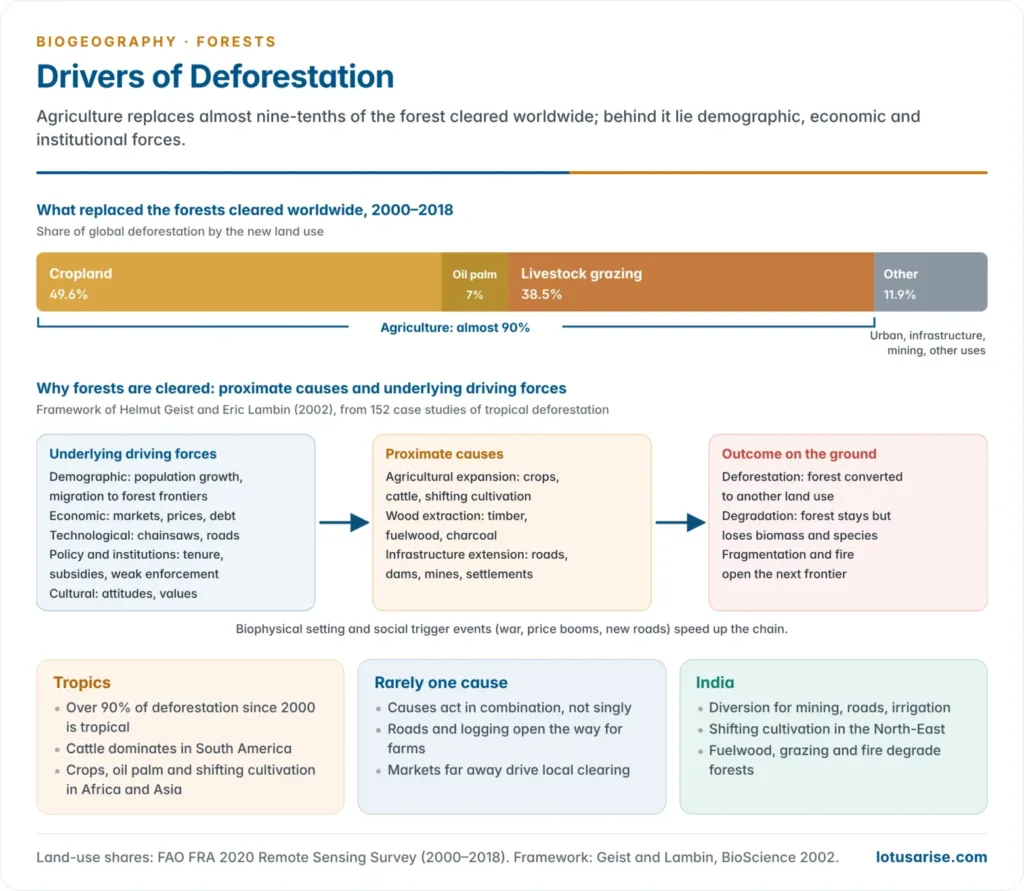
- Helmut Geist and Eric Lambin (2002), in a study of 152 cases of tropical deforestation, separated two layers of causation:
- Proximate causes are the immediate human actions that change land cover: agricultural expansion, wood extraction and infrastructure extension.
- Underlying driving forces are the demographic, economic, technological, policy-institutional and cultural factors that motivate them.
- Deforestation is rarely single-caused: proximate causes combine, driven by population pressure, market demand and institutional failure.
- Agriculture dominates. Between 2000 and 2018, cropland replaced 49.6% of the forest cleared worldwide (oil palm alone 7%) and livestock grazing 38.5%: almost 90% in all (FAO Remote Sensing Survey).
Agriculture
- Expanding agriculture is among the biggest drivers of deforestation, worldwide and in India.
- As demand for farm products grows with population and incomes, more land is brought under the plough: forests, grasslands, marshes and even land under water are cleared and reclaimed.
- The ecological loss usually exceeds the marginal gain in crop output, a classic case of short-term extraction outrunning long-term carrying capacity.
- Forest soils are poorly suited to sustained cultivation.
- They lack the deep, humus-rich A horizon of mature farm soils; their fertility lies in nutrient cycling through litter fall, not in stored reserves. This is most marked under tropical rainforest.
- After a few cropping cycles nutrients are exhausted, the land is abandoned, and the bare surface suffers accelerated soil erosion and degradation.
- Fresh forest is then cleared elsewhere: the shifting frontier of agricultural deforestation.
- Commercial agribusiness drives most tropical clearing: cattle and soy in the Amazon, oil palm in South-East Asia, cocoa in Africa.
Shifting cultivation (jhum)
- Shifting cultivation, or slash-and-burn agriculture, is one of humanity’s oldest land-use systems, perhaps 12,000 years old. It marks the transition from food gathering to settled food production.
- The cycle: a forest patch is cleared and burnt, cropped for 2–3 years, then abandoned to natural fallow so that forest and soil regenerate.
- It was sustainable when fallows were long (15–20 years) and population was sparse.
- Under population pressure the fallow has shortened drastically, often to a few years. Forest and soil cannot recover, and a rotational system becomes a driver of permanent deforestation and soil degradation.
- Today: shifting cultivation caused 86% of primary forest loss in the Democratic Republic of the Congo between 2002 and 2025, and remains significant in Laos, Myanmar and the hills of north-east India.
- India: it persists in Assam, Manipur, Meghalaya, Mizoram, Nagaland, Tripura and the Andaman and Nicobar Islands, mostly among tribal communities under customary land tenure. It is a main reason for the decline of forest cover in the North-East.
| Regional name | Area |
|---|---|
| Jhum | North-East India |
| Podu | Andhra Pradesh, Odisha |
| Bewar, Dahiya | Madhya Pradesh |
| Kumari | Western Ghats |
| Pama Dabi, Koman, Bringa | Odisha |
Demand for firewood
- Firewood remains a leading domestic fuel for cooking, heating and small-scale processing across the developing world.
- Of about 4 billion m³ of roundwood cut worldwide in 2022, about half (49%) was burnt as fuel (FAO).
- The share is high in Africa and South Asia and small in Europe and North America, where fossil fuels and electricity have replaced wood.
- India: households burn about 216 million tonnes of fuelwood a year, of which about 59 million tonnes comes from forests (Forest Survey of India estimate).
- The pressure falls hardest on forests near dense settlements: a fuelwood crescent of degraded woodland around villages and towns.
- Rural energy transition (LPG through the Pradhan Mantri Ujjwala Yojana from 2016, biogas, improved chulhas) therefore brings a forest-conservation dividend, not only a public-health one.
Wood for industry and commerce
- Wood is a versatile industrial raw material: crates, packing cases, furniture, matchboxes, paper and pulp, and plywood.
- Unrestricted commercial exploitation of timber and wood products is a major driver of forest degradation, distinct from subsistence clearing.
- Himalayan examples:
- The apple industry of the western Himalaya consumed fir and other conifers for wooden packing boxes.
- Plywood tea chests long consumed large volumes of timber for packing tea and other exports.
- Policy correction is easier here: substitution (cardboard and plastic crates for wood) and certification (FSC-certified sustainable timber).
Urbanisation and development projects
- Infrastructure-led deforestation differs from agricultural or subsistence clearing: it is capital-intensive, state- or corporate-driven and often irreversible.
- It begins with roads, railways, dams, townships and power transmission lines.
- Thermal power plants and mining for coal, metal ores and other minerals add to it.
- In India this category has grown since liberalisation, creating the recurring development versus environment tension:
- Narmada Valley projects submerged forests and displaced tribal people.
- Western Ghats mining led to the Madhav Gadgil (2011) and K. Kasturirangan (2013) committee reports on ecologically sensitive areas.
- Coal blocks in the forests of Chhattisgarh, Jharkhand and Odisha, such as Hasdeo Arand; the Great Nicobar project needs about 130 km² of island forest.
- About 3.06 lakh ha of forest land was diverted for non-forest purposes in 2008–09 to 2022–23; mining, roads, irrigation and transmission lines took the largest shares.
Overgrazing
- Overgrazing of forests with moderate cover by domestic and sometimes feral animals is worst in tropical, subtropical, arid and semi-arid regions.
- Continuous browsing prevents saplings from regenerating even after the canopy is removed by other causes, so it can lead to complete destruction of forest cover.
- In India it is compounded by common property resource degradation: without clearly assigned grazing rights, village forest lands suffer a tragedy of the commons.
Forest fires and other causes
- Development pressures have fallen hardest on tropical forest regions, because their concentration of living and non-living resources (minerals, rivers, fertile land) attracts industrial and development agencies alike.
- Forest fires, natural (lightning, common in dry deciduous and coniferous belts) or human-made (burning to clear land, accidental ignition), are increasingly frequent destroyers of forest.
- Climate change is lengthening fire seasons and raising fire intensity: fire caused 42% of global tree cover loss in 2025.
- India: Uttarakhand, Odisha and Chhattisgarh recorded the most fire incidents in 2023–24; the chir pine forests of Uttarakhand and the dry deciduous forests of the Western Ghats burn most often.
- Pests, invasive species such as Lantana camara and storms also degrade forests.
- The monsoon deciduous forest is among the world’s most disturbed ecosystems: fire, grazing, farm clearing and commercial felling have shrunk it to degraded patches, and much of India’s savanna-like scrub is vegetation derived from it.
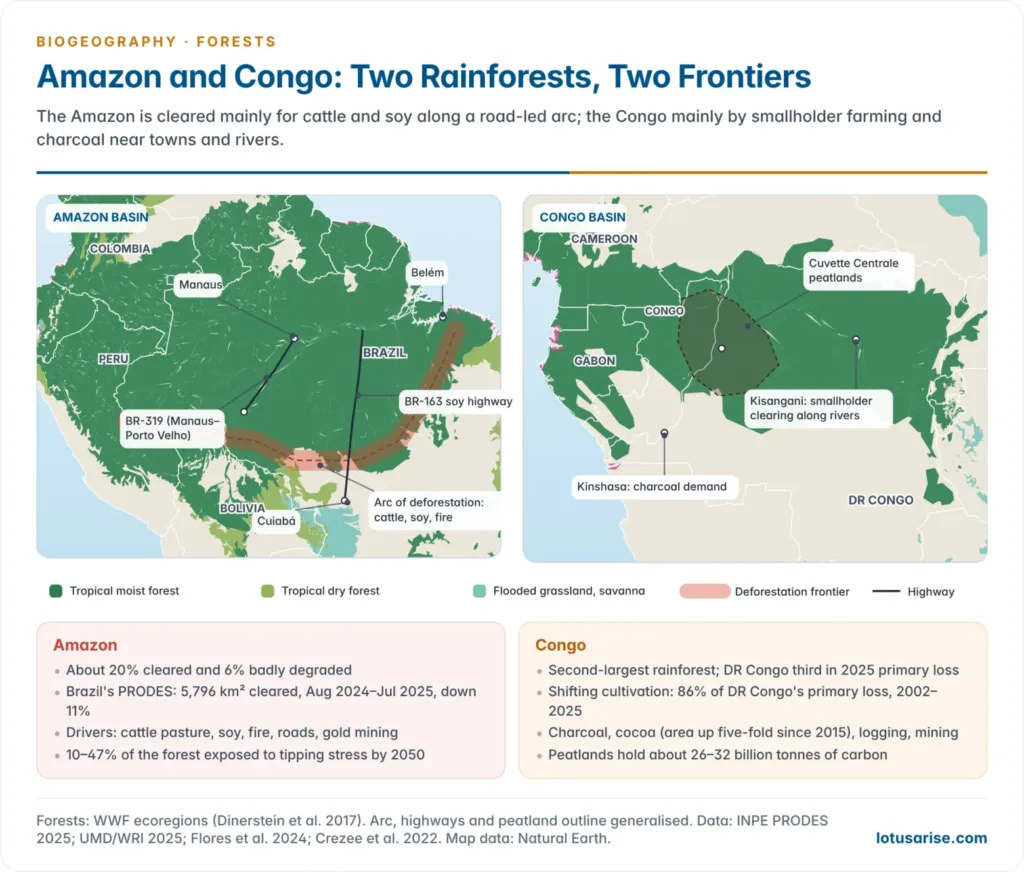
Tropical deforestation: Amazon and Congo
- Tropical forests need separate treatment, because their drivers and pace differ from temperate and boreal forests.
- Tropical rainforests of the Amazon, the Congo Basin, South-East Asia and India’s Western Ghats and North-East hold disproportionately high biodiversity and carbon stocks per unit area.
- Their drivers are dominated by commercial agribusiness (soy, palm oil, cattle), logging concessions and road-building that opens frontier access, the fishbone pattern of clearing seen on satellite images along new highways.
- Tropical deforestation rates remain the highest in the world, which is why the tropics are the focus of REDD+ under the UNFCCC.
| Feature | Amazon Basin | Congo Basin |
|---|---|---|
| Size | Largest tropical rainforest; about 60% in Brazil | Second-largest; DR Congo holds most of it |
| Main drivers | Cattle pasture, soy, fire, roads, gold mining | Smallholder shifting cultivation, charcoal, cocoa, logging, mining |
| Pattern | Large clearings along the southern and eastern arc of deforestation and highways such as BR-163 and BR-319 | Small clearings near towns, rivers and roads; rural complex around Kisangani and Kinshasa |
| Recent trend | Brazil’s PRODES: 5,796 km² cleared in Aug 2024–Jul 2025, down 11%; Bolivia’s loss near record | DR Congo third in 2025; non-fire loss at a record; Cameroon’s highest ever |
| Carbon | South-eastern Amazon now a net carbon source | Peatlands of the Cuvette Centrale store about 26–32 billion tonnes of carbon |
- Amazon: about 20% has been cleared and 6% more is badly degraded.
- Bernardo Flores and colleagues (2024) found that 10–47% of the forest could face compounding heat, drought, fire and clearing by 2050, enough to tip parts of it into savanna.
- Gold mining caused a third of primary forest loss in Peru’s Madre de Dios region (2002–2025).
- Congo Basin: about 100 million people depend on its forests.
- Charcoal (makala) for cities such as Kinshasa, and cocoa, whose area in DR Congo rose more than five-fold in 2015–2024, are growing pressures.
- Its peatlands, about 16.7 million ha, make clearing and drainage a major carbon risk.
Consequences of Deforestation
- The impacts cascade through the physical and biological environment; they are best read as a chain reaction rather than isolated effects.
Soil erosion and flash floods
- Shrinking forest cover, together with over-use of groundwater, has accelerated erosion on the slopes of the lower Himalaya and the Aravalli hills and made them prone to landslides.
- Without canopy and litter, water runs off the ground rapidly instead of infiltrating. It washes away topsoil, which is deposited as silt in river beds, reducing channel capacity and raising flood risk downstream.
- Himalayan rivers: clearing in the upper catchments of the Ganga, Yamuna and Kosi raises sediment loads, silts reservoirs and builds up beds in the plains, worsening floods in Bihar and Uttar Pradesh.
- Forests act as natural check-dams: they lower flood peaks by delaying runoff, and ease droughts by sustaining base flow through groundwater recharge.
- Clearing also alters local rainfall by cutting the evapotranspiration that feeds local showers.
Climatic change
- Forests raise local precipitation through transpiration-driven moisture recycling and improve the soil’s water-holding capacity.
- The Amazon recycles much of its own rain and exports moisture southwards as “flying rivers” to the farms of the La Plata basin; clearing weakens this pump.
- They regulate the water cycle and keep soil fertile by returning nutrients through leaf fall and litter decomposition, the same cycle that breaks when land is cleared for farming.
- Carbon sink: forests absorb atmospheric CO₂ and help balance the CO₂–O₂ ratio. They also regulate atmospheric oxygen and humidity, acting as environmental buffers.
- World forests store about 714 gigatonnes of carbon (FRA 2025).
- Deforestation adds to the greenhouse effect twice over: it releases stored carbon and removes future sequestration capacity. Fires in 2024 alone emitted about 4.1 gigatonnes of greenhouse gases.
- The Himalayan ecosystem shows the cascade vividly:
- The system is under severe strain: the snow line is retreating and perennial springs are drying; about half the Himalayan springs have dried up or turned seasonal (NITI Aayog, 2018).
- Drought-proneness has also appeared in areas not historically drought-prone, such as parts of Tamil Nadu and Himachal Pradesh, showing that the effects of clearing spread beyond the cleared locality.
Loss of wildlife and biodiversity
- Habitat destruction causes ecological imbalance in the affected region and is the leading cause of species loss on land.
- Shrinking green cover destabilises ecosystems, breaking predator–prey relationships, pollination networks and seed-dispersal mutualisms.
- Habitat fragmentation turns continuous forest into isolated patches.
- It shrinks large-mammal populations, raises human–wildlife conflict at forest edges, and undermines the genetic viability of wildlife.
- Island biogeography theory explains why: small, isolated patches hold fewer species and lose them faster.
- Indian examples: elephants and tigers squeezed into fragments in central India; corridor breaks in the Western Ghats; Asiatic lions surviving only in the Gir landscape of Saurashtra.
- Tropical clearing threatens endemics such as orangutans in Borneo and bonobos and okapis in the Congo.
Effects on agriculture and people
- Agriculture loses forest services: soil fertility, pollinators, spring water and protection from floods and silt.
- In India, silted reservoirs, drier hill springs and weaker dry-season flow hurt irrigation; in the North-East, short jhum cycles cut yields and push farming on to steeper slopes.
- Forest-dependent communities, especially tribal people, lose fuel, fodder, food and NTFP income.
Conservation Measures
- Protecting and conserving forests is essential for ecological balance and for the economic development of the nation, because forest livelihoods, watershed services and climate stability all rest on standing forest capital.
- The first task is to protect existing forests from reckless, commercially driven cutting, through government legislation and by building public awareness of their value.
- UNESCO’s Man and the Biosphere (MAB) Programme (1971) links conservation with development through biosphere reserves, whose buffer and transition zones support sustainable forest use.
India’s forest cover: ISFR 2023
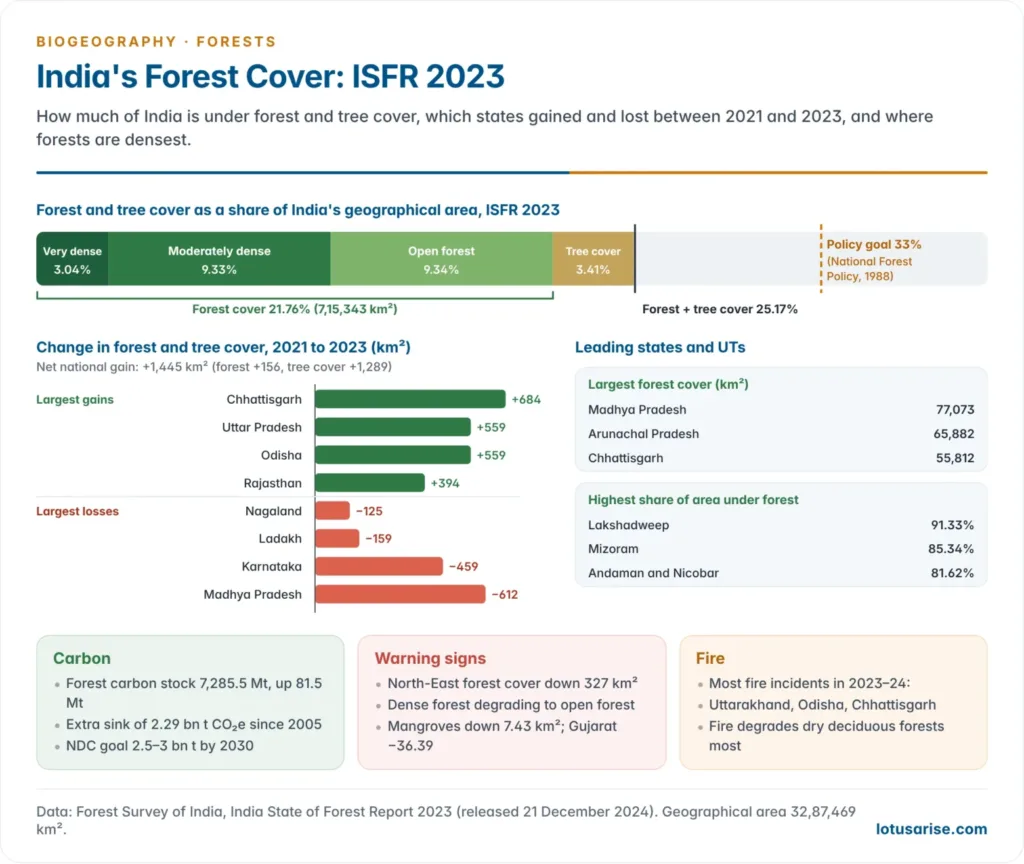
- The Forest Survey of India has assessed forest cover every two years since 1987. Its 18th report, the India State of Forest Report (ISFR) 2023, was released on 21 December 2024.
| Indicator | ISFR 2023 |
|---|---|
| Forest cover | 7,15,343 km², 21.76% of geographical area |
| Tree cover (outside forest) | 1,12,014 km², 3.41% |
| Forest and tree cover | 8,27,357 km², 25.17% |
| Density classes | Very dense 3.04%, moderately dense 9.33%, open 9.34% |
| Change since 2021 | +1,445 km² (forest +156, tree cover +1,289) |
| Largest forest cover | Madhya Pradesh, Arunachal Pradesh, Chhattisgarh |
| Largest gains | Chhattisgarh (+684), Uttar Pradesh, Odisha (+559 each), Rajasthan |
| Largest losses | Madhya Pradesh (−612), Karnataka (−459), Ladakh, Nagaland |
| Mangroves | 4,992 km² (down 7.43 km²) |
| Carbon stock | 7,285.5 million tonnes, up 81.5 Mt |
| Additional carbon sink since 2005 | 2.29 billion t CO₂e, against the 2030 target of 2.5–3 |
- The gains are mostly in tree cover (plantations, agroforestry and urban trees), while natural forest is degrading:
- forest cover in the North-East fell by 327 km²;
- some very dense and moderately dense forest slipped to lower density classes.
- 19 states and UTs have more than 33% of their area under forest.
National Forest Policy
- The National Forest Policy of 1952 laid down the founding principles of forest management:
- a functional classification of forests into protection forests, national forests, village forests and tree lands;
- the target of one-third of the land under forest: two-thirds in the hills and 20% in the plains.
- The legal classification into reserved, protected and village forests comes from the Indian Forest Act, 1927.
- The National Forest Policy of 1988 shifted the aim from revenue to ecological security and people’s needs. Its main principles:
- expanding forest cover through tree planting, to improve physical and climatic conditions for public welfare;
- progressively increasing supplies of fodder, small timber and firewood to people living near forests;
- opposing the reckless extension of agriculture into forest land;
- massive afforestation, on a war footing, to bring 33% of India’s geographical area under forest or tree cover, and two-thirds of the hills. Against this benchmark, forest and tree cover stands at 25.17% (ISFR 2023).
- A draft National Forest Policy (2018) added climate change, watershed and urban forestry goals but has not been adopted.
Scientific harvesting and afforestation
- Scientific selective cutting: fell only mature, desired trees and leave low-value trees standing, so the canopy stays continuous.
- Wasteland and already deforested land should be brought systematically under vigorous afforestation.
- Forests should not be replaced by commercial fruit orchards. The Himalayan apple economy shows why:
- apple growing clears the natural vegetation first;
- it then demands huge quantities of wood every year for packing, a double pathway of land clearance plus timber extraction.
Livelihood-based conservation
- Agroforestry and social forestry: growing trees with crops and livestock eases pressure on natural forests while sustaining rural livelihoods.
- Ethnobotany: documenting and valuing indigenous knowledge of forest plants conserves that knowledge and creates economic incentives to protect forests.
- Nature-based tourism: channelling ecotourism revenue into community conservation incentives.
Remedial measures
- Intensive afforestation, with high-yielding, ecologically suitable species planted in suitable areas.
- Modern seasoning and preservation techniques to cut timber waste in processing and storage.
- Protection from fire and plant disease to prevent avoidable losses: fire lines, early-warning alerts by satellite, community fire watchers.
- A thorough forest resource inventory for sound assessment and planning, the mandate of the Forest Survey of India.
- Discourage shifting cultivation while giving dependent tribal communities alternative, sustainable livelihoods (terraces, horticulture, settled agroforestry). Restriction without livelihood substitution is both unjust and unworkable.
- Proper training of forest staff, including in community engagement and participatory management.
Government initiatives in India
Survey, regulation and pollution control
- Survey and inventory: the Botanical Survey of India (BSI) and Zoological Survey of India (ZSI) survey flora and fauna. The Forest Survey of India (FSI) assesses forest cover every two years for planning and monitoring.
- Biological Diversity Act, 2002, with the Biological Diversity Rules, 2004 (amended in 2023):
- conserves biological resources and regulates access to them for fair and equitable benefit-sharing;
- works through the National Biodiversity Authority, State Biodiversity Boards and Biodiversity Management Committees at the local level.
- Pollution control clearances: industries need Consent to Establish and Consent to Operate from the State Pollution Control Boards under the Water (Prevention and Control of Pollution) Act, 1974 and the Air (Prevention and Control of Pollution) Act, 1981 before starting operations.
- Environmental Impact Assessment: development projects need an EIA and an Environmental Management Plan under the EIA Notification of 14 September 2006.
- Cleaner technology: promotion of cleaner production and better fuel quality to reduce industry’s footprint.
- Regulatory monitoring: regular checks of industrial units for continued compliance.
Joint Forest Management and sacred groves
- Joint Forest Management (JFM): guidelines of the Ministry of Environment and Forests dated 1 June 1990 involved village communities and voluntary agencies in regenerating degraded forest land.
- JFM is co-management: the Forest Department and local communities protect and manage forests together and share usufructs.
- It marked a shift from exclusionary fortress conservation to participatory stewardship.
- Sacred groves are patches of forest, from a few trees to several hectares, dedicated to local folk deities or tree spirits (vanadevatas) and protected through belief and ritual.
- They are among India’s oldest faith-based systems of biodiversity conservation.
- Examples: devarakadu (Karnataka), sarna (Jharkhand, Chhattisgarh), kavu (Kerala), law kyntang (Meghalaya) and orans (Rajasthan).
- People’s movements also defended forests: the Bishnoi sacrifice at Khejarli (1730) led by Amrita Devi; the Chipko movement (1973) in the Garhwal Himalaya, with Chandi Prasad Bhatt, Gaura Devi and Sunderlal Bahuguna; and the Appiko movement (1983) in the Western Ghats of Karnataka.
National Mission for a Green India
- The Green India Mission (GIM), launched in 2014, is one of the eight missions of the National Action Plan on Climate Change (NAPCC, 2008). It aims to raise forest and tree cover on 5 million ha and improve forest quality on another 5 million ha.
- Its sub-missions:
- Better forest quality and ecosystem services on 4.9 million ha, mostly forest land: 1.5 million ha of moderately dense forest, 3 million ha of open forest and 0.4 million ha of degraded grassland.
- Eco-restoration and afforestation on 1.8 million ha of forest and non-forest land: scrublands, shifting cultivation areas, abandoned mines, ravines, mangroves and sea-buckthorn areas. Restoration has to extend to degraded non-forest ecosystems too.
- Urban greening on 0.2 million ha of urban and peri-urban land, including institutional land, because urban forestry matters for city microclimates and air quality.
- Agroforestry and social forestry on 3 million ha, and wetland restoration on 0.1 million ha.
- Revised GIM (June 2025): the mission now concentrates on the Aravallis, Western Ghats, Indian Himalayan Region, mangroves and the arid north-west, working with MGNREGS and other schemes to restore degraded land and meet the carbon-sink target.
Laws and funds
- Forest (Conservation) Act, 1980: central approval is needed before forest land is diverted to non-forest use. It has been the main legal check on development-led deforestation.
- The Supreme Court in T. N. Godavarman Thirumulpad v. Union of India (1996) widened “forest” to its dictionary meaning: any forest, whatever its ownership, and any land recorded as forest.
- Scheduled Tribes and Other Traditional Forest Dwellers (Recognition of Forest Rights) Act, 2006: recognises individual and community forest rights, correcting historical injustice and giving communities a stake in conservation. Gram sabhas can manage community forest resources.
- Compensatory Afforestation Fund Act, 2016 (CAMPA): a project that diverts forest land must pay for compensatory afforestation and the Net Present Value (NPV) of the forest lost, into national and state funds.
- Audits have criticised the quality and survival of its plantations.
- National Afforestation Programme (NAP): afforestation of degraded forest land through Forest Development Agencies and JFM committees.
- National Green Tribunal Act, 2010: a specialised tribunal hears forest and environment cases and has halted illegal diversion and mining.
- Paris Agreement: India’s NDC includes an additional carbon sink of 2.5–3 billion tonnes of CO₂ equivalent through extra forest and tree cover by 2030; 2.29 billion tonnes had been achieved by 2023.
- Recent steps: the Nagar Van Yojana (2020) for urban forests, the Ek Ped Maa Ke Naam campaign (2024), and a pledge to restore 26 million ha of degraded land by 2030 (Bonn Challenge).
The Forest (Conservation) Amendment Act, 2023
- Assented to on 4 August 2023 and in force from 1 December 2023, it renamed the 1980 law the Van (Sanrakshan Evam Samvardhan) Adhiniyam, 1980.
- Main changes:
- New preamble on carbon neutrality, net-zero emissions and raising forest and tree cover.
- Narrower scope: the Act covers land notified as forest under the Indian Forest Act, 1927 or other laws, and land recorded as forest in government records on or after 25 October 1980.
- Exemptions: strategic and security linear projects within 100 km of international borders and the Line of Control; up to 10 ha for security infrastructure; up to 5 ha for public utilities in Left Wing Extremism districts; up to 0.10 ha for access to roadside settlements and railways.
- New forestry activities: zoos, safaris and eco-tourism, frontline forest infrastructure and surveys no longer count as non-forest use.
- Concerns: unrecorded “deemed” forests, reportedly about 1.99 lakh km², may lose protection; border exemptions in the fragile North-East and Himalaya may bypass Forest Rights Act consent; zoos and safaris may fragment habitat.
- Supreme Court: in February 2024 it told states to follow the wide Godavarman definition until all forest-like lands are recorded, and in September 2026 directed them to set up expert panels for that record. The challenge to the Act is pending.
International measures
- REDD+ (Reducing Emissions from Deforestation and Forest Degradation, plus conservation, sustainable management and enhancement of carbon stocks), adopted under the UNFCCC through the Warsaw Framework (2013): results-based payments to developing countries that cut forest emissions.
- Glasgow Leaders’ Declaration on Forests and Land Use (2021): more than 140 countries pledged to halt and reverse forest loss by 2030.
- Bonn Challenge (2011) and the UN Decade on Ecosystem Restoration (2021–2030) for restoring degraded land.
- Kunming–Montreal Global Biodiversity Framework (2022): protect 30% of land and sea by 2030 and restore 30% of degraded ecosystems.
- Trade rules: the EU Deforestation Regulation bars cattle, cocoa, coffee, palm oil, rubber, soy and wood linked to recent deforestation. After two postponements it applies to large companies from 30 December 2026.
- Tropical Forest Forever Facility (TFFF): launched at COP30 in Belém (November 2025), a planned US$125 billion fund paying tropical countries for each hectare of forest kept standing, with 20% for Indigenous peoples and local communities.
- Enforcement works: Brazil’s recent fall in Amazon clearing rests on satellite alerts, fines and Indigenous territories, which lose far less forest.
Previous Year Questions
2026Deforestation in the upper reaches of a river augments the magnitude of soil erosion. Elaborate your answer citing the example of any North Indian river.2025What are the ecological consequences of agricultural deforestation in the Amazon and Congo Basins, particularly concerning biodiversity and climate regulation?2023Discuss the impact of the National Green Tribunal Act, 2010 on forest conservation in India.2020Explain the effects and causes of deforestation, and its impact on the pattern of agriculture in India.2018Discuss the causes of degradation of tropical rainforests and suggest remedial measures for their prevention, conservation and development.1996Write short note: Man, and the Amazon rainforest.





nice
Thank uh so much….for helping us
thank you so much sir
Very helpful
Add a point that it will increase chances of Man Wildlife conflict by reducing the buffer between human beings and wildlife.
Very well explained