

- The Green Revolution is the multiple growth in crop output in developing countries that came from a joint package of high yielding varieties (HYVs), irrigation, chemical inputs, farm machinery and institutional support.
- It reflected the condition of poor countries seeking self-sufficiency in food and relief from hunger, famine and the social evils tied to them.
- India turned from a “begging bowl” dependent on foreign grain into a food-surplus country, with foodgrain output rising from 72.35 million tonnes in 1965-66 to 357.73 million tonnes in 2024-25.
- The gains were narrow in crop and place, and they carried economic, social and ecological costs that still shape farm policy.
Origin and Basis
The Term and the Global Background
- Begging bowl image: before 1966-67, India leaned heavily on American wheat under the PL-480 programme, a state described as living “ship to mouth”.
- The term: William S. Gaud, Administrator of the United States Agency for International Development, first used “Green Revolution” on 8 March 1968 in Washington DC.
- The occasion was his address to the Society for International Development, titled The Green Revolution: Accomplishments and Apprehensions.
- Mexico was the stimulus. Its food shortage set off the wheat breeding led by Norman Ernest Borlaug, who received the Nobel Peace Prize in 1970.
- Borlaug’s team crossed the best wheat genes available by conventional cross-breeding, and the Japanese dwarf Norin 10 supplied the short stem.
- By 1956 Mexico was feeding itself. Yields reached 7,000 kg per hectare in 1961, some 2½ times what older wheats gave.
- Borlaug himself called the achievement a “temporary success” when he accepted the prize.
- Rice followed. The work centred on the International Rice Research Institute in the Philippines, whose semi-dwarf IR8 spread through South-East Asia in the late 1960s. Taiwan had also done early work on rice, and Japan gave the dwarf wheat parent.
How It Reached India
- Mankombu Sambasivan Swaminathan (1925–2023, Bharat Ratna 2024) pressed for the new wheats, and Borlaug toured India’s wheat regions from 1 to 25 March 1963.
- Borlaug had already forecast that India could double its wheat output within a decade.
- Trial: India received 100 kg each of four dwarf and semi-dwarf varieties. Grown at Delhi, Ludhiana, Pusa and Kanpur, they gave over 4,000 kg per hectare, about four times the local yield.
- Scale-up: 18,000 tonnes of Mexican seed were imported in 1966.
- The harvest of 1967-68 was about a quarter above that of 1966-67, a rise larger than the whole gain of the preceding 16 plan years.
| Programme | Began | Coverage | Purpose |
|---|---|---|---|
| Intensive Agricultural District Programme (IADP) | 1960-61 | 7 districts, later 15 | The “package” of credit, inputs and know-how, as a demonstration |
| Intensive Agricultural Area Programme (IAAP) | 1964-65 | 114 districts | A lighter version of the package over a wider area |
| High Yielding Varieties Programme (HYVP) | Kharif 1966 | National, in phases | The starting point of the Green Revolution proper |
- The seven IADP districts: Ludhiana (Punjab), Aligarh (Uttar Pradesh), Shahabad (Bihar), Raipur (now Chhattisgarh), West Godavari (Andhra Pradesh), Thanjavur (Tamil Nadu) and Pali (Rajasthan).
- Four grew mainly rice, two wheat and one millets.
- About 64% of the extra foodgrain output in these districts came from capital and knowledge (seed, fertilizer, pesticide) and the rest from land and labour.
Basis: The Components
- The package had twelve parts, and each leaned on the others. HYVs respond to fertilizer, attract pests and weeds, need assured water, and ripen fast enough to demand quick harvesting and machinery.
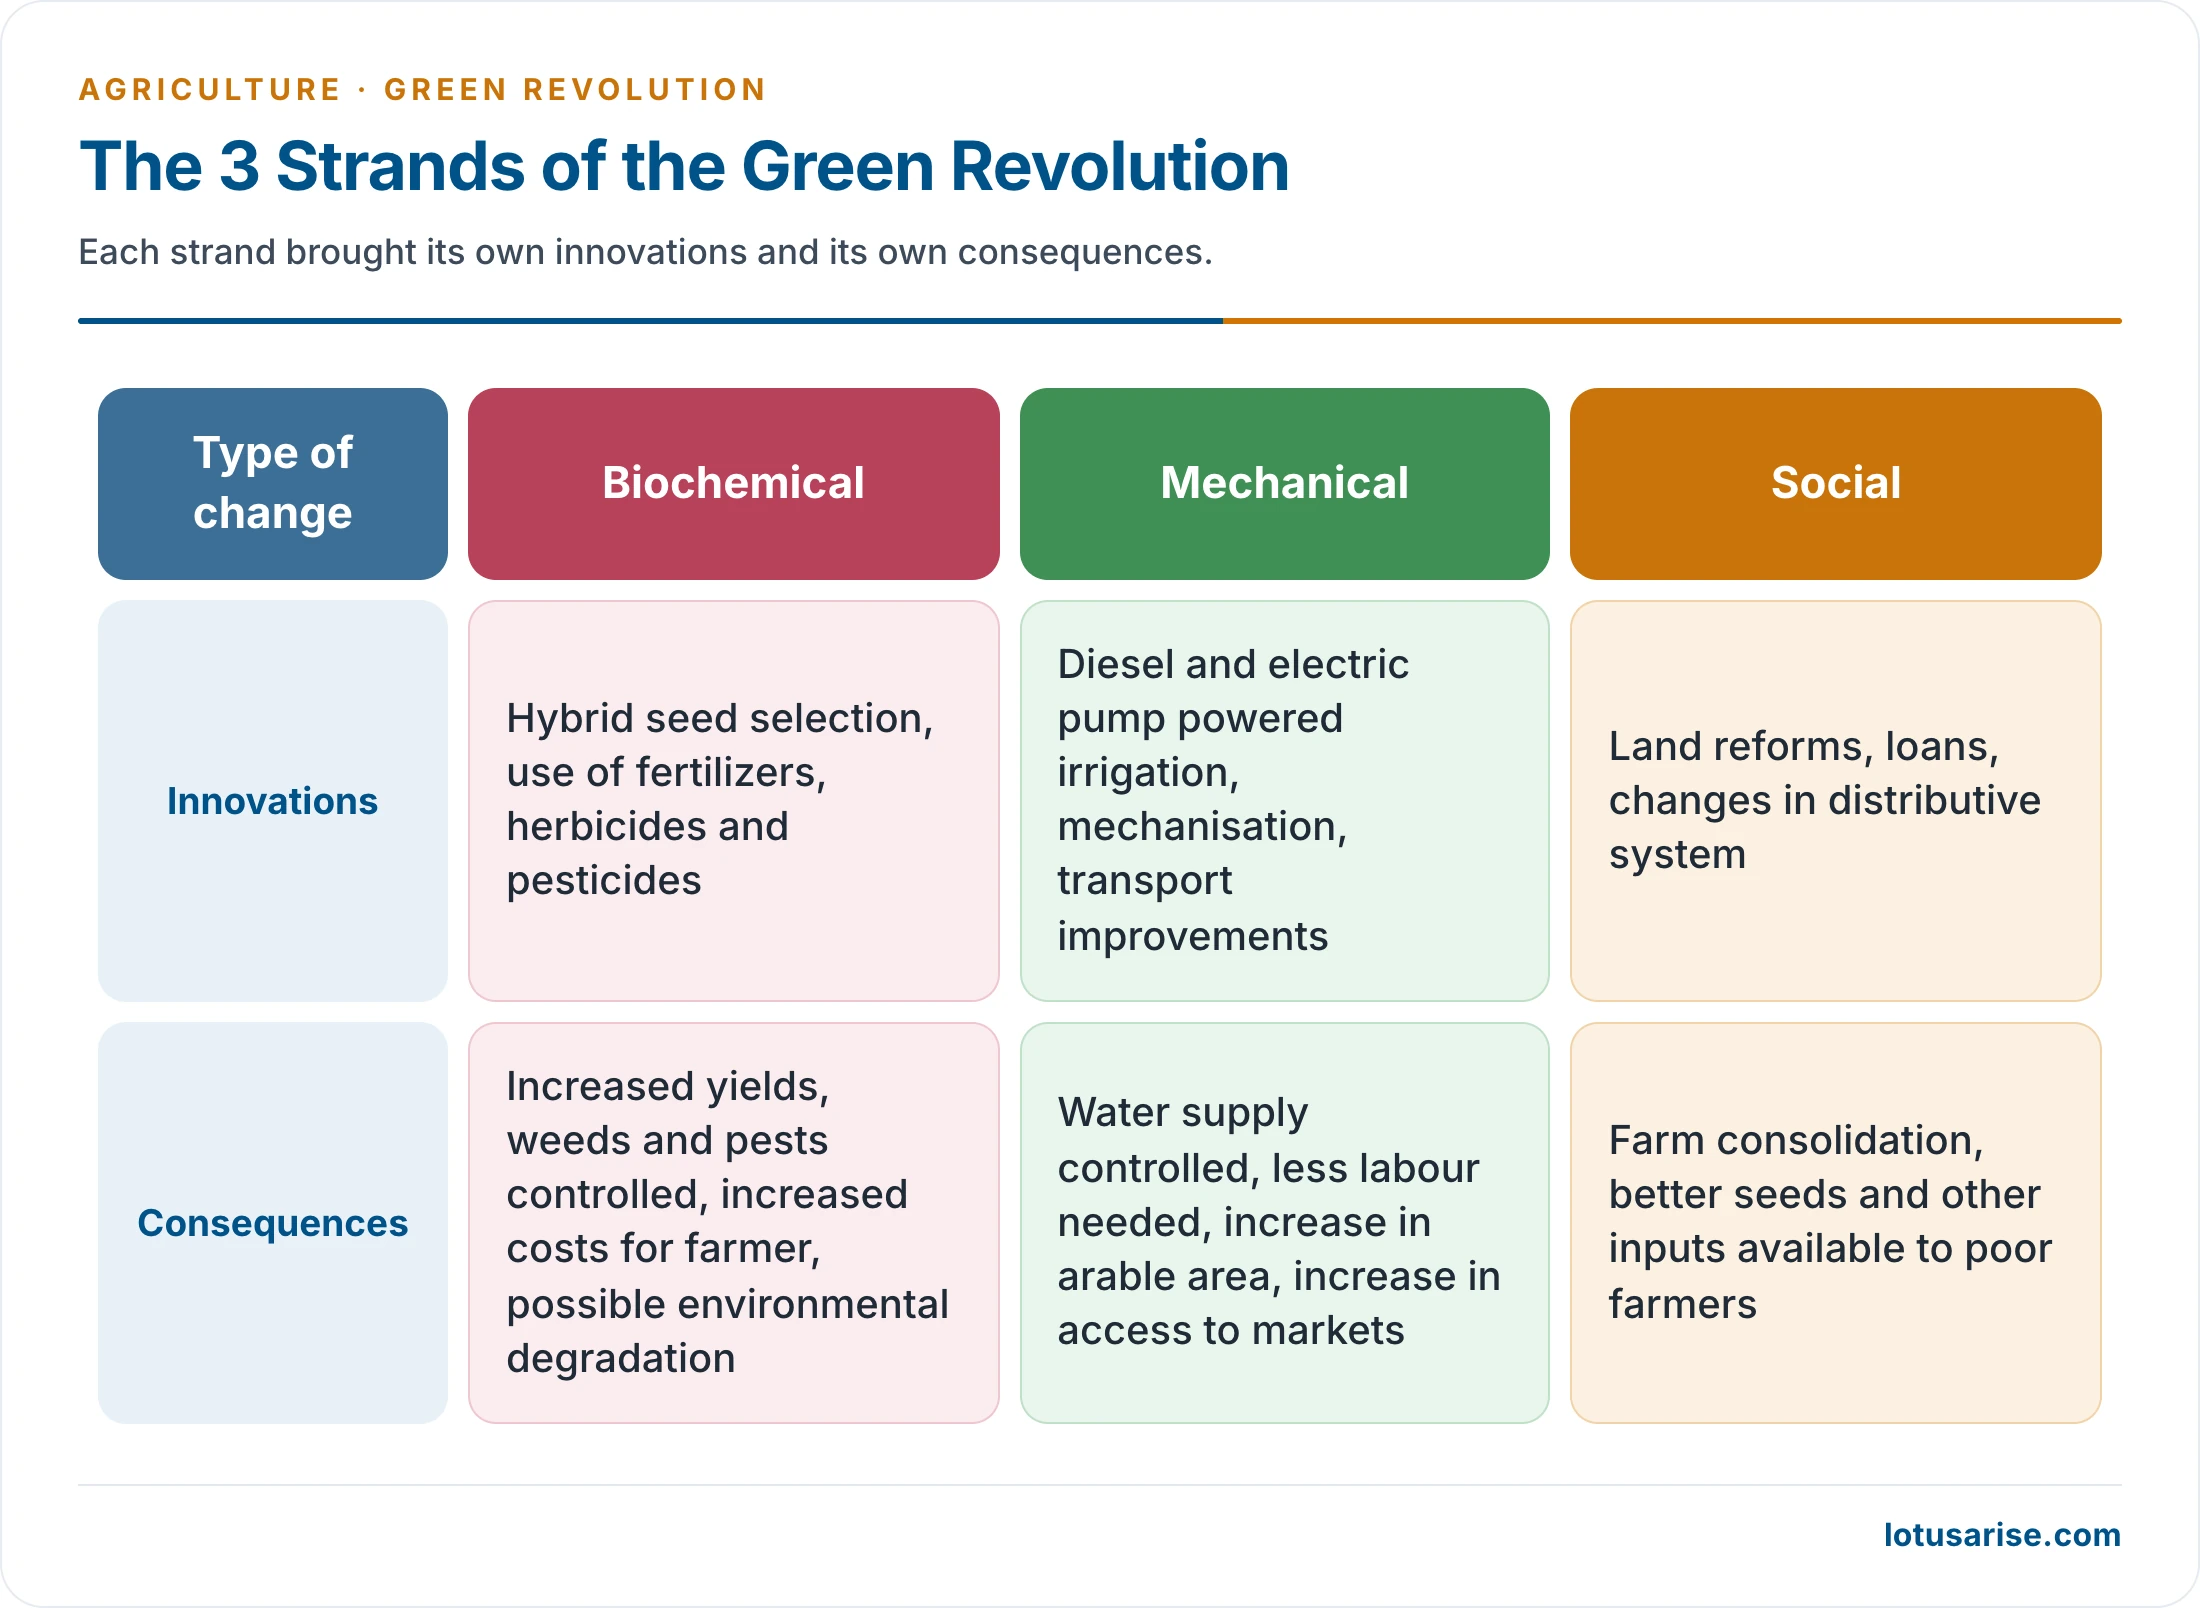
- 1. High Yielding Varieties (HYVs): the single most important input. Wheat HYVs came in the 1960s and rice HYVs in 1969-70.
- These are conventionally bred dwarf varieties, and they yield two to three times a normal crop.
- Dense canopy and broad leaves aid photosynthesis, and short stems carry a heavy fertilizer load and resist wind.
- They are tender, and they need more water, fertilizer, pest and weed control, and careful soil preparation.
- A short growing period frees the land for another crop, which raises cropping intensity.
- A steady supply depends on the chain of breeder, foundation and certified seeds.
- 2. Irrigation: the second input, since assured water stabilises as well as raises output.
- Net irrigated area was only 24.66 million hectares in 1960-61, and gross irrigated area 27.98 million hectares. Gross irrigated area reached about 122.29 million hectares by 2022-23.
- B. B. Vohra favoured ground water and called this the Ground Water Revolution, because a pumpset gives the farmer push-button control.
- 3. Chemical fertilizers: Indian soils are short of nitrogen, so NPK use spread quickly.
- The recommended N:P:K ratio is 4:2:1. Actual use is heavily tilted to nitrogen, at 11.8:4.6:1 in 2022-23.
- Consumption shifted from southern India, the leader in 1970, to Punjab, Haryana and Uttar Pradesh.
- 4. Insecticides, pesticides and weedicides: monoculture invites pests, so surveillance became part of crop production, beginning with wheat diseases in 1966-67.
- Older ministry figures put over 30 million hectares under pest and disease attack, with an annual loss of 5–25% of output.
- Punjab, Haryana, Andhra Pradesh and Tamil Nadu used over 60% of the country’s pesticides in 2013-14.
- 5. Command Area Development Programme (CADP): launched in 1974-75 to close the gap between irrigation potential created and used.
- On-farm development: field channels, ploughing, levelling, bunding, soil survey, land shaping, field drains, farm roads and warabandi, the rotation that gives each holding its turn of water.
- Off-farm development: roads, rural connectivity, marketing, transport and communication.
- It began with 60 projects and a culturable command of about 15 million hectares, reached 149 projects, and was renamed Command Area Development and Water Management from 1 April 2004.
- Since 2015-16 it has run under Pradhan Mantri Krishi Sinchayee Yojana. A modernisation sub-scheme for piped delivery to the farm gate was approved in April 2025, with an initial outlay of ₹1,600 crore for 2025-26.
- 6. Consolidation of holdings: scattered plots were pooled so that machinery and tube wells could pay.
- 7. Land reforms: abolition of intermediaries and zamindari, tenancy reform and ceilings.
- Half of India was under zamindari in 1947, with 80% of that land held by absentee landlords. Secure owners invest more.
- 8. Rural credit and micro-finance: small farmers cannot buy the package from savings. Banks and cooperatives, including Regional Rural Banks, took over much of the moneylender’s business.
- 9. Rural electrification: the precondition for tube wells and farm machinery.
- India had about 1,300 electrified villages and 6,400 energised pumpsets at Independence. Haryana electrified all its villages in 1970.
- All inhabited census villages stood electrified by 28 April 2018, the last being Leisang in Manipur.
- 10. Rural roads and regulated markets: these link the village to inputs and buyers, ideally with a market within 5 km.
- 11. Farm mechanisation: required to turn land round between crops, and it saves labour at peak seasons.
- 12. Agricultural universities: they carried research to the field, with Punjab, Haryana and Uttar Pradesh as the strongest cases.
- Commercialisation: the Agricultural Prices Commission (January 1965) and the first Minimum Support Price, for wheat in 1966-67, gave farmers a reason to grow more.
Phases and Spread
Phase I (1965-66 to 1980): Wheat in the North-West
- India urgently needed food, and the wheat success in Mexico and other countries, such as Egypt, offered a model.
- The phase was crop-specific and region-specific. Punjab already had the infrastructure, and Haryana and western Uttar Pradesh could extend irrigation from next door. The tract was also fairly free of natural hazards.
- It began with IADP and IAAP as experiments, and its main thrust was the HYVP, launched in the first of the Annual Plans (1966–69).
- The Command Area Development Programme of 1974-75 gave it fresh emphasis.
- Output: foodgrains stood at 50.83 million tonnes in 1950-51, 72.35 in 1965-66 and 129.59 in 1980-81.
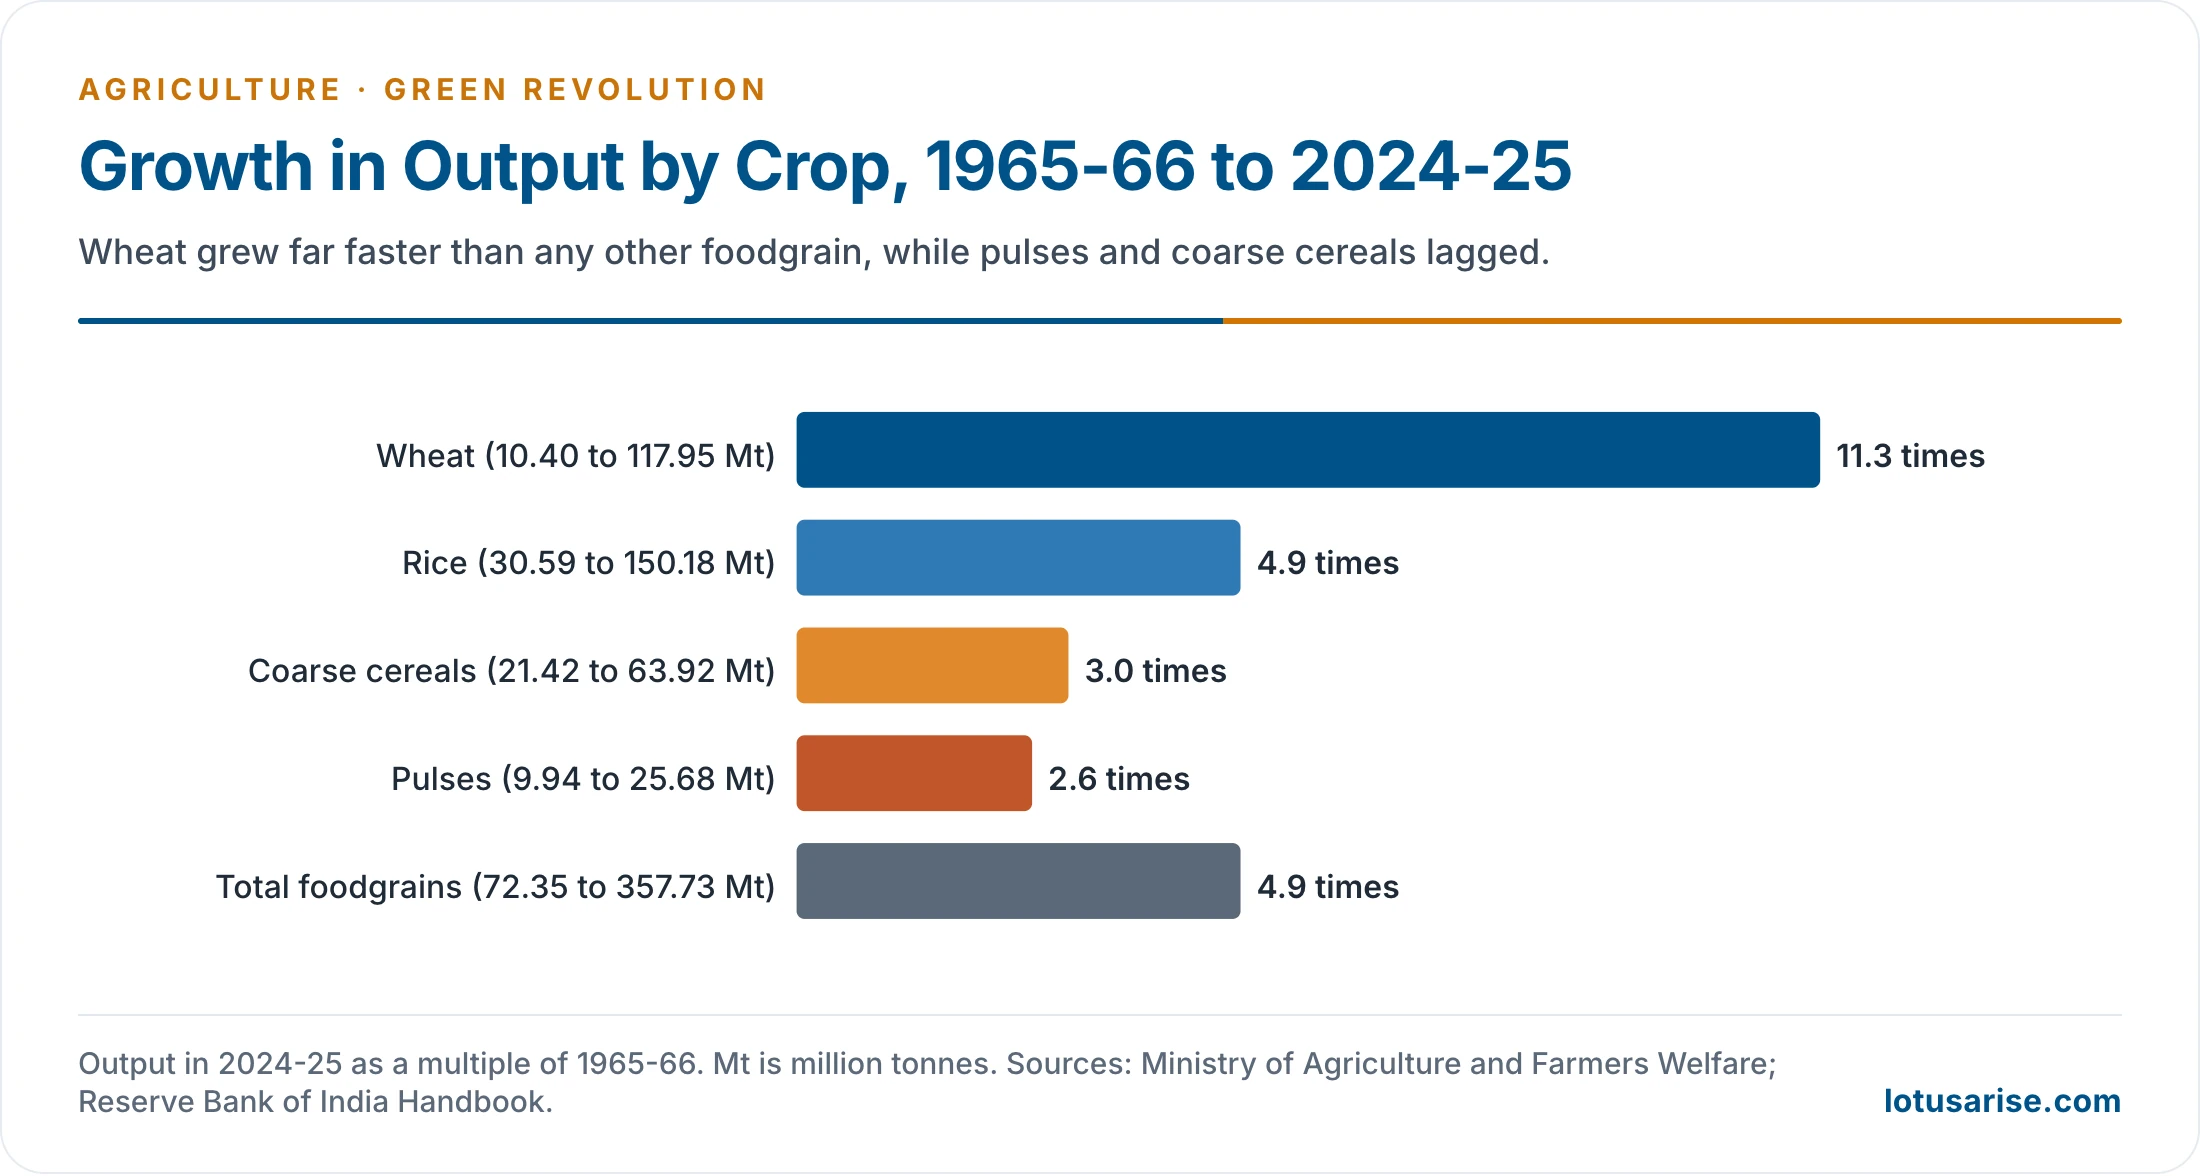
- Wheat rose from 10.40 million tonnes in 1965-66 to 23.83 in 1970-71, about 2.3 times in five years. This is why the movement is often called a wheat revolution.
- India gained self-sufficiency in foodgrains, and it left the begging-bowl image behind. Malnutrition, famine, poverty and starvation eased.
Phase II (1980 to 1991): Rice in the Wet East and South
- The Sixth and Seventh Plans targeted wet agriculture, mainly rice, since rice had grown only about 1.75 times in Phase I (30.59 to 53.63 million tonnes).
- Target regions had over 100 cm of rainfall: West Bengal, Bihar, eastern Uttar Pradesh, Assam and the coastal plains.
- Success was partial.
- The Krishna–Godavari delta and the Cauvery basin did best.
- West Bengal raised its productivity, and Bhojpur in Bihar also gained.
- Institutional factors held rice back, such as tenancy and land reforms that came too late in Uttar Pradesh, West Bengal and Bihar.
- A traditional outlook among farmers was a further limit.
Phase III (1991 to 2003): Dry Land
- The Eighth and Ninth Plans turned to dry-land farming, with HYVs in cotton, oilseeds, pulses and millets. The result was again partial.
- Watershed work was meant to lift the sub-humid and semi-arid regions, a line later consolidated in the Integrated Watershed Management Programme (2009-10).
- Results stood out only in the Narmada–Tapi doab, the Tungabhadra basin and the Bhima–Krishna basin.
From Rainbow Revolution to Inclusive Growth
- After the Ninth Plan, the ecological damage in the core areas forced a shift towards balanced growth based on agro-ecology, conservation and sustainability (Tenth Plan).
- The Rainbow Revolution names this drive across the whole farm sector. The National Agriculture Policy of July 2000 is closely tied to the idea.
| Revolution | Sector | Timing in the older account |
|---|---|---|
| White | Milk | 1970s |
| Yellow | Oilseeds | 1980s |
| Blue | Fish | 1980s |
| Grey | Fertilizers | 1980s |
| Silver | Eggs and poultry | 1980s |
- The Eleventh Plan raised the idea to sustainable farming with inclusive growth.
Diffusion and Core Areas
- Rice spread from its old heartland in West Bengal and Bihar into semi-arid Punjab, Haryana and western Uttar Pradesh, on the strength of irrigation, and into large parts of South India.
- Wheat spread to eastern Uttar Pradesh, Madhya Pradesh, Rajasthan, Gujarat, Bihar and West Bengal, mostly in the 1970s.
- Most benefited: Punjab, Haryana and western Uttar Pradesh for wheat, and the coastal rice tracts of Andhra Pradesh, Telangana and Tamil Nadu.
- Least touched: Assam, Bihar, West Bengal and Odisha, along with the arid and semi-arid west and south.
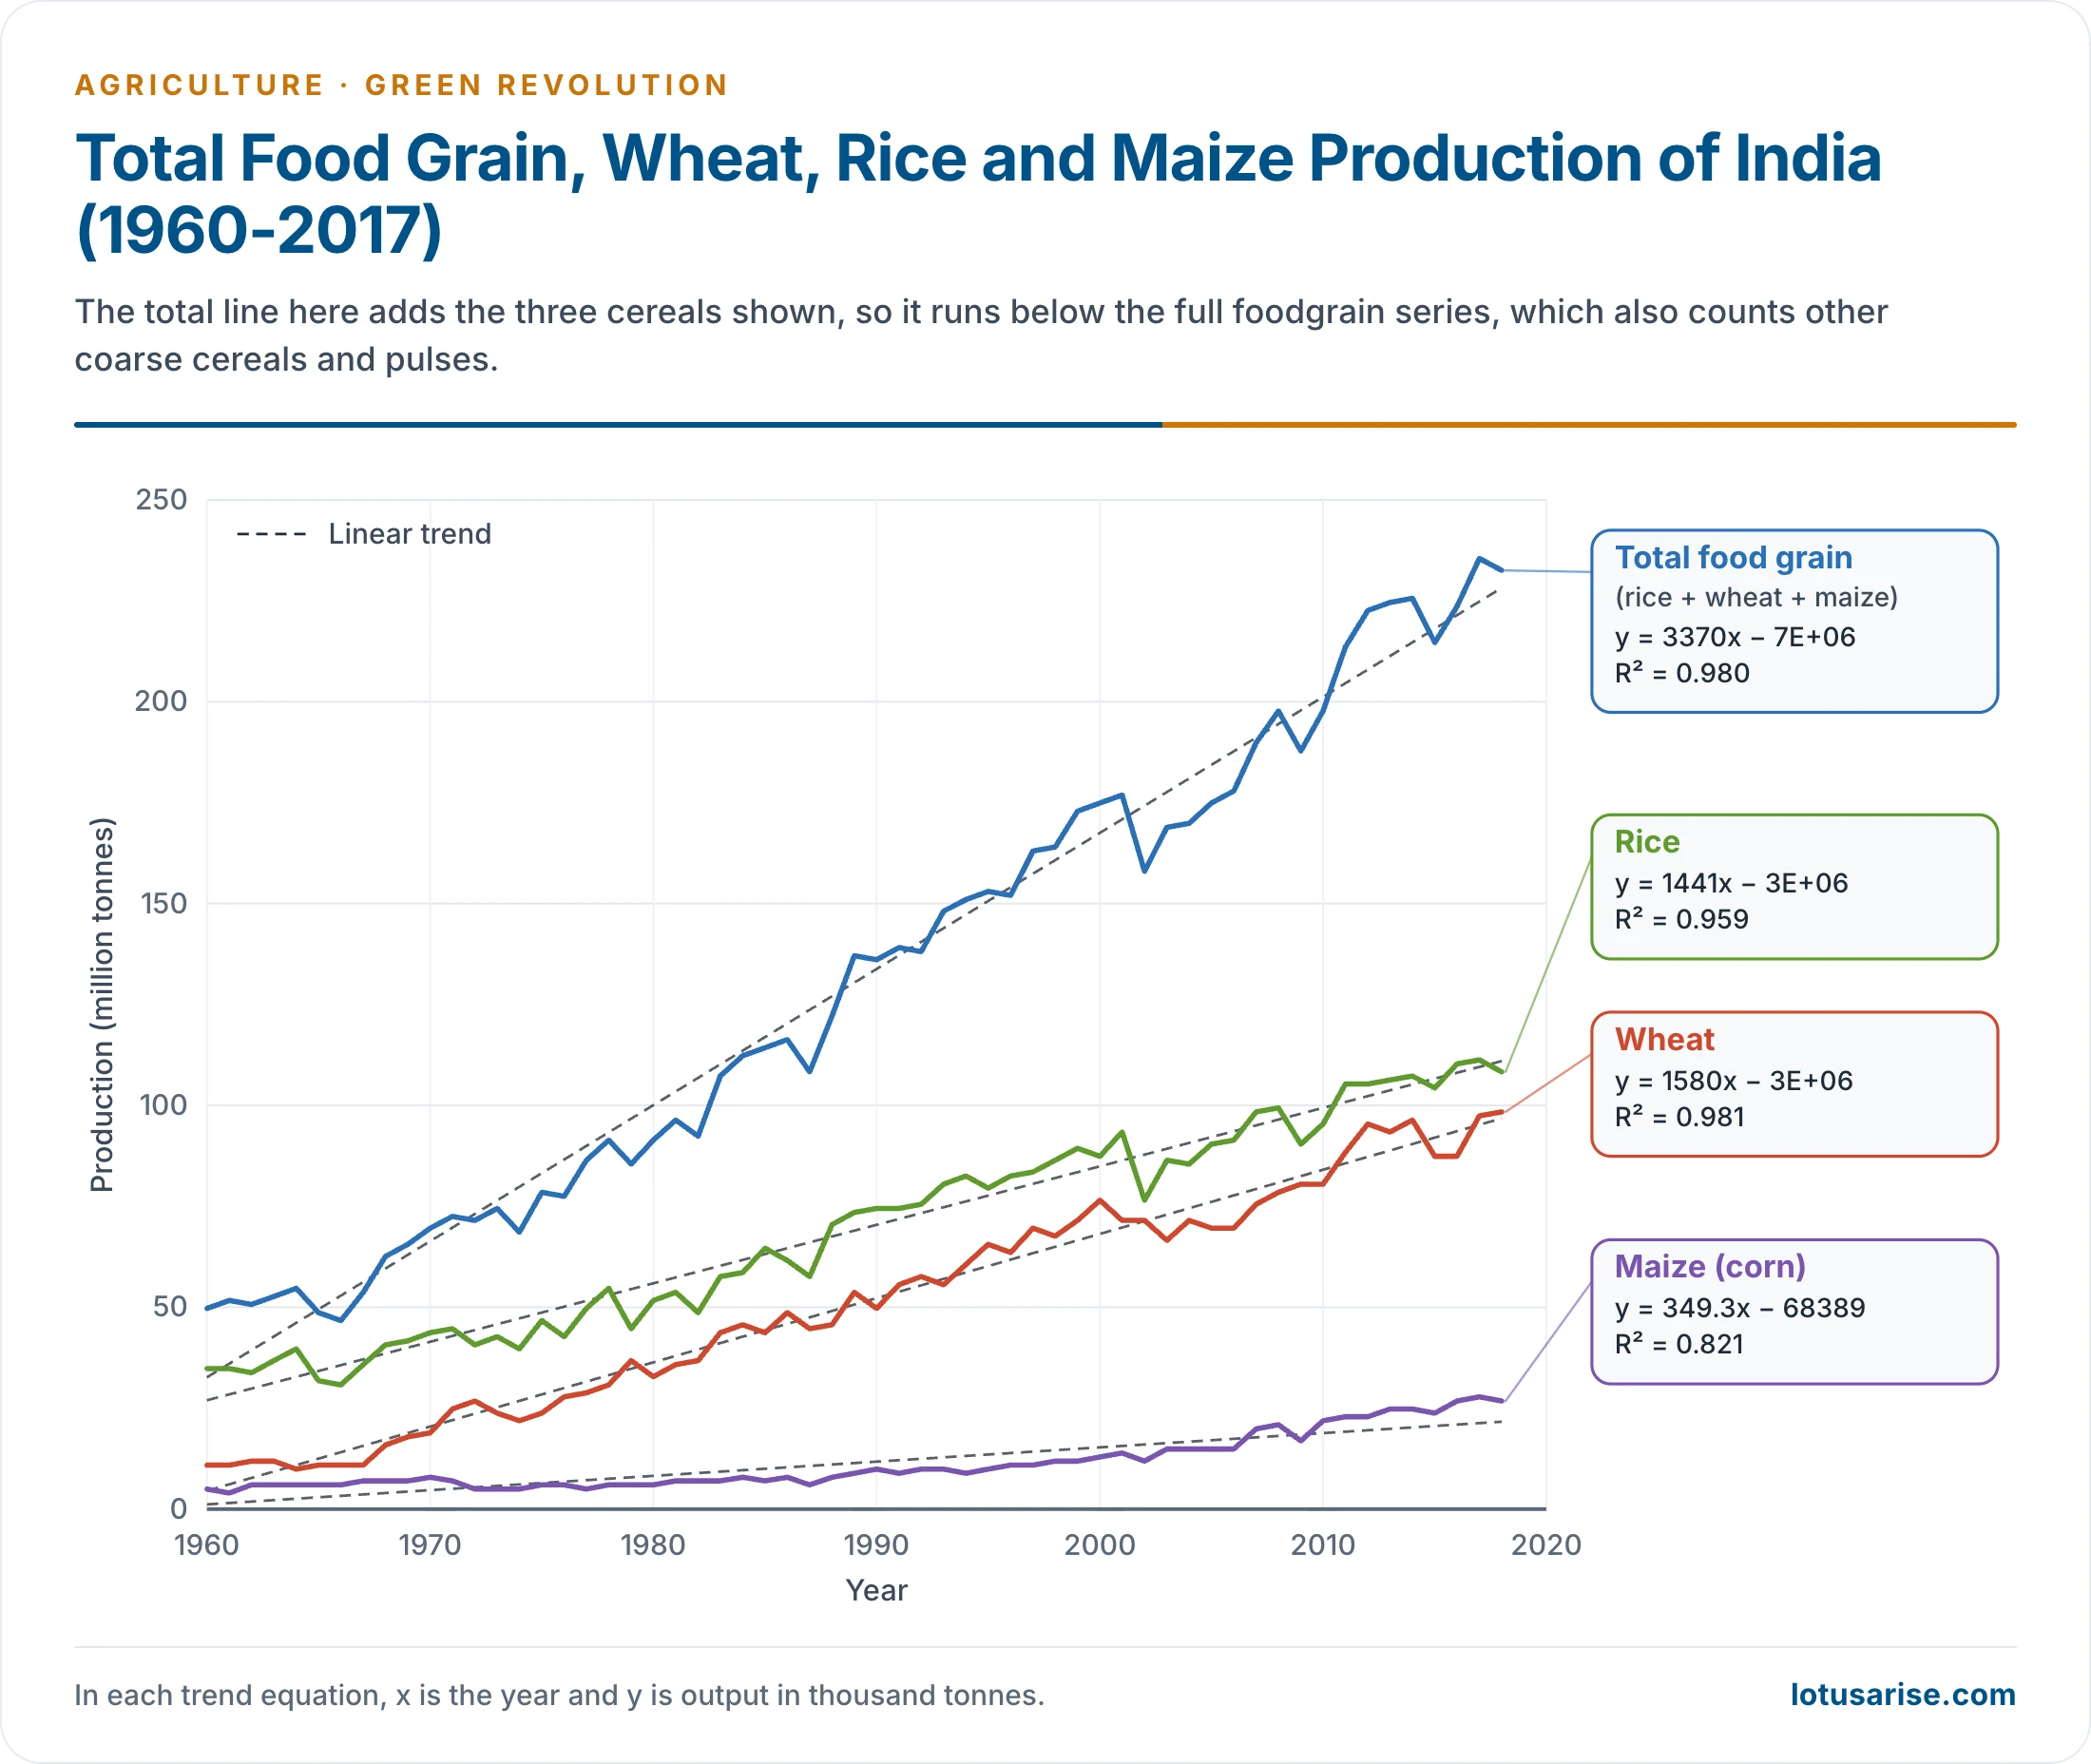
- This chart stops at 2017, so the table below carries the record forward. Its total line adds only rice, wheat and maize, so it runs below the total foodgrains in the table, which also counts other coarse cereals and pulses.
| Crop (million tonnes) | 1950-51 | 1965-66 | 1980-81 | 2015-16 | 2024-25 | 2025-26 (third estimate) |
|---|---|---|---|---|---|---|
| Rice | 20.58 | 30.59 | 53.63 | 104.41 | 150.18 | 154.02 |
| Wheat | 6.46 | 10.40 | 36.31 | 92.29 | 117.95 | 120.66 |
| Coarse cereals | 15.38 | 21.42 | 29.02 | 38.52 | 63.92 | 74.47 |
| Pulses | 8.41 | 9.94 | 10.63 | 16.32 | 25.68 | 27.41 |
| Total foodgrains | 50.83 | 72.35 | 129.59 | 251.54 | 357.73 | 376.56 |
Gains of the Green Revolution
- Food security: it answered a perennial food crisis and a population explosion, and it removed the threat of mass famine.
- India’s population rose from 43.92 crore in 1961 to 68.33 crore in 1981, and only a jump in yield could feed it. The older round figure was a doubling from 33 to 66 crore in about 25 years.
- Net foodgrain availability rose from about 408 grams per head per day in 1966 to about 511 grams in 2013. The revised financial-year series gives 568.8 grams for 2022-23.
- Less import, more saving: the foreign exchange spent on grain could go to anti-poverty work, such as the Backward Area Development Programme, the Integrated Rural Development Programme (IRDP) and the Tribal Area Development Programme.
- Yield and area (1965-66 to 2013-14): foodgrain yield rose from 629 to 2,095 kg per hectare, rice from 862 to 2,419 kg, and wheat from 827 to 3,059 kg.
- Wheat area grew from 12.57 to 31.3 million hectares.
- Commercial surplus: a marketable surplus appeared, and it commercialised farming and brought in capitalistic farming, chiefly among holders of over 10 hectares.
- Ploughing back: a Punjab Agricultural University study found Ludhiana farmers reinvesting about 55% of their income.
- Rural infrastructure: roads, power and markets, first a precondition, then spread as a result.
- Wages and employment: multiple cropping raised labour demand, and higher wages put cash in rural hands.
- About 15 lakh workers from Bihar, eastern Uttar Pradesh and Odisha found work in Punjab, and by the 2010s many were returning as jobs grew at home.
- G. S. Bhalla and G. K. Chadha traced Punjab’s mechanisation to scarce, costly labour at peak seasons.
- Linkages with industry:
- Forward linkage: farms supply raw material to textile, sugar, vanaspati and other agro-based industries.
- Backward linkage: farms demand tractors, harvesters, threshers, combines, pumpsets, fertilizers and pesticides from industry.
- Agro-processing and food-processing units industrialised tier II and III towns and quickened urbanisation.
- Farm mechanisation, land reform and consolidation went furthest in the Green Revolution areas.
- Changed attitudes: the farmer proved quick to adopt, which ended the myth of tradition-bound cultivators. Wolf Ladejinsky reported that no farmer denied the new methods once the means were at hand.
- Land saved: M. S. Swaminathan counted the sparing of forest and land through higher yields among the largest gains.
- Sudhir Sen defended the name itself, holding the Green Revolution to be a reality and a breathing space for setting the economy in order.
Repercussions
- Vandana Shiva (The Violence of the Green Revolution, 1991) argued that it stayed area-specific and crop-specific, and that the resulting disparities fed ethnic regionalism and consciousness.
- She held “high yielding” to be a misnomer for highly responsive varieties, and held that better mixed cropping and indigenous seed were neglected options.
- The loss of diversity, in her view, bred new pests and diseases.
- Critics answer the case for its gains by pointing out that the social costs outweigh the economic gains for many rural households.
- North-western India’s environment, soil, land and water suffered from chemicals, which makes the model neither far-sighted nor sustainable.
- Fatigue: yields of wheat and rice in Punjab and Haryana have flattened while fertilizer costs climbed.
Economic Repercussions
- Inter-personal disparity: earnings pulled apart, mainly in favour of farmers with 10 hectares or more.
- Francine R. Frankel found this in Ludhiana, West Godavari, Thanjavur, Palghat and Bardhaman, and G. R. Saini in Ferozepur and Muzaffarnagar.
- Bhalla and Chadha found many Punjab holders of under 2 hectares still below the poverty line.
- Only 0.7% of India’s 13.78 crore holdings exceeded 10 hectares in 2010-11.
- Inter-regional disparity: western against eastern Uttar Pradesh is the standard case.
- G. S. Bhalla and Y. K. Alagh (1979): 69 high-productivity districts had 20% of the cultivated area and 36% of output, using 44% of fertilizers, 50% of tractors and 45% of irrigation pumps, with 38% of gross irrigated area.
- Inter-state disparity: Punjab and Bihar drew sharply apart between 1960 and 1990. About 60% of the cropped area stayed largely outside the movement in older estimates, including rainfed, hilly, coastal and dry zones.
- Inter-crop imbalance: wheat took land from coarse cereals, pulses and oilseeds, and cotton, jute, tea and sugarcane gained little. Output of the two main cereals ran into surplus while others stayed short.
- Debt trap: dependence on informal credit pulled labourers and cultivators into a vicious circle of debt.
Social Repercussions
- Rural landlessness: marginal farmers sold land to large farmers at high prices and became agricultural labourers, adding to rural distress and ill-health.
- Unemployment: except in Punjab and partly Haryana, mechanisation displaced labour, and the poor and landless were hit hardest.
- Patriarchy: many accounts link the new prosperity to stronger male dominance, with female discrimination, female foeticide and rising dowry.
Ecological Repercussions
- Soil degradation: unscientific farming caused salinisation and alkalisation, with the white crusts of reh and kallar on the saline and alkaline soils of the plains.
- Waterlogging: over-irrigation left wet tracts in Punjab, Haryana, Rajasthan and western Uttar Pradesh, which also breed the mosquitoes behind malaria, dengue and chikungunya.
- Toxicity: excess chemicals poison the soil and kill the micro-organisms that keep it fertile.
- Water pollution: run-off degrades rivers, tanks, reservoirs and ground water.
- Eutrophication: enrichment of a water body by nutrients such as nitrogen and phosphorus produces a bloom of a few plants.
- Water hyacinth in tanks and ponds is the familiar case. It shuts out sunlight and oxygen from the lower layers, and the pond ecosystem dies.
- Deforestation: forests were cleared in Punjab, the Tarai and the Bhabar for farmland.
- Punjab’s forest cover is about 3.7% of its area, and Haryana’s about 3.65% (2023). Uttar Pradesh stood just above 5% in older counts.
- Disrupted farm ecology: monoculture (wheat above all), pesticides, fertilizers and weedicides upset natural pest control.
- Ground water depletion: rice in semi-arid tracts leans on tube wells, and water tables in the north-west have fallen by up to a metre a year.
- The ground water stage of extraction in 2025 was 156.36% in Punjab, 136.75% in Haryana and 70.00% in Uttar Pradesh.
- M. K. Sekhon and Manjeet Kaur warned of this, and of soil damage, in a study of Punjab.
- Noise: tractors, harvesters, threshers and crushers disturb rural quiet.
- Health hazards: residues enter food through fruit and vegetables. The Indian Council of Medical Research reported traces of lead, zinc and copper in milk and vegetables.
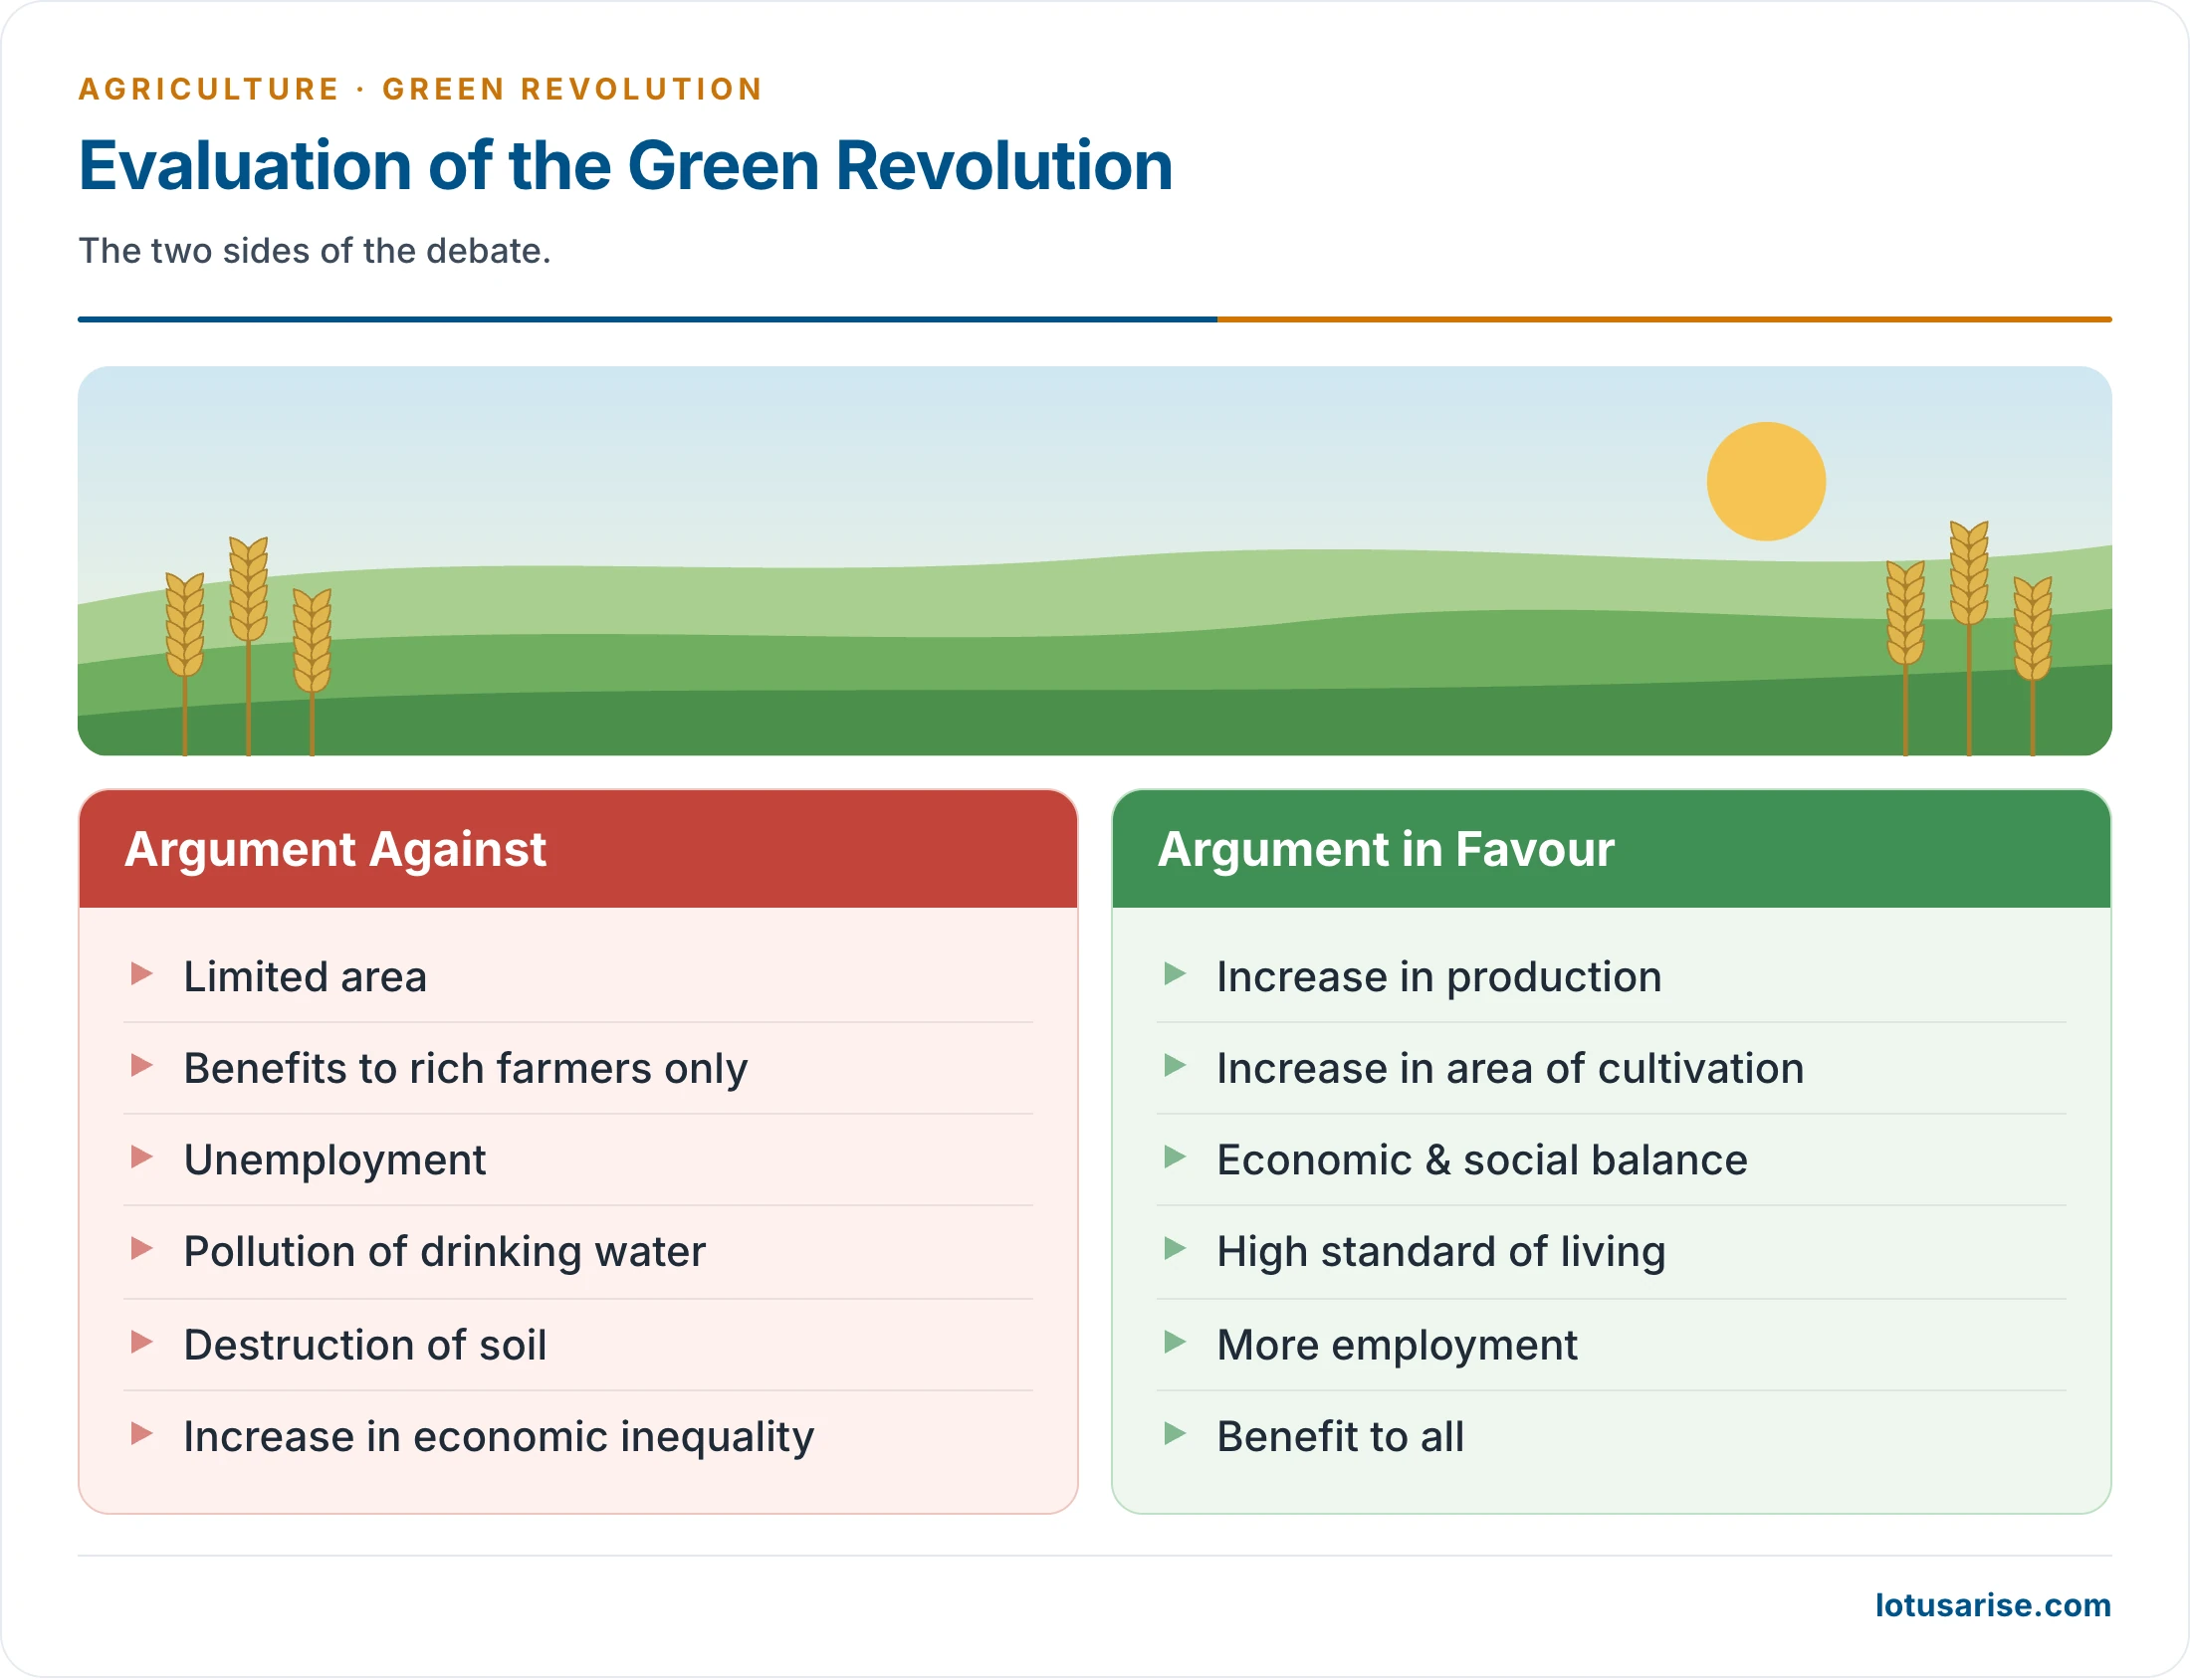
- On this chart, “Benefit To All” and “Economic & Social Balance” are claims of the movement’s supporters. The evidence above shows gains going mainly to large farmers in irrigated tracts.
Second Green Revolution
- Why it is needed: the first revolution has reached a plateau, while population, nutrition needs and soil damage press harder.
- It also left out pulses, oilseeds, fruit and vegetables, poultry, meat and fish, and rainfed, hilly, coastal and arid zones.
- What differs: the first wave chased foodgrain output, often at ecological cost. The second aims at sustainable agriculture, in the sense of the Brundtland Commission (1987): meeting today’s needs while leaving later generations free to meet their own.
- Constraint: almost all cultivable land is already in use, so growth must come from productivity on existing fields, new technology, and better soil and water care.
Strategies
| Strategy | Core idea | Note |
|---|---|---|
| Micro-irrigation | Water delivered straight to the root zone by emitters | A task force set a potential of 69 million hectares against 1.3 million then; over 115 lakh hectares came under the Per Drop More Crop scheme by July 2026 |
| Organic farming | Replaces synthetic chemicals | Driven by consumer demand for safe food |
| Precision farming | Site-specific inputs through information technology | Higher returns, less energy, less damage |
| Green agriculture | Integrated pest, nutrient and natural resource management | Allows minimum essential chemicals; widespread in China |
| Eco-agriculture | Farm growth and biodiversity in one landscape | Joins modern science and local knowledge |
| White agriculture | Food made with micro-organisms, chiefly fungi | Began in China in 1986; “white” refers to the coats of the technicians |
- Soil health and rainfed farming now form the core of the National Mission for Sustainable Agriculture.
- Other needs: research that reaches the field, stronger marketing, soil health, water conservation, affordable credit, crop and life insurance, and public-private partnership.
- Food security for the poor rests on three prongs: higher farm income and wages, more off-farm and non-farm work, and a strong public distribution system.
Government Steps
- Eleventh Plan (2007–12) framework:
- Double the growth of irrigated area, and improve water management, rainwater harvesting and watershed work.
- Reclaim degraded land and improve soil quality.
- Close the knowledge gap through extension and information technology.
- Diversify into fruit, vegetables, flowers, herbs, spices, medicinal plants, bamboo and biodiesel, with safeguards for food security.
- Provide affordable credit, better markets and renewed attention to land reform.
- Focus on pulses and hybrids, area-specific seed, and rainfed and drought-prone crops.
- Bringing Green Revolution to Eastern India (BGREI): begun in 2010-11 under Rashtriya Krishi Vikas Yojana, for rice-based systems in Assam, Bihar, Chhattisgarh, Jharkhand, Odisha, eastern Uttar Pradesh and West Bengal.
- Rice output there reached 58.4 million tonnes in 2012-13, against a mean of 48.8 million over the five years before 2011-12.
- PM Dhan-Dhaanya Krishi Yojana: launched on 11 October 2025 for 100 low-performing districts, chosen on productivity, cropping intensity and credit, with an annual outlay of ₹24,000 crore for six years.
Evergreen Revolution
- The goal of food sufficiency has been met, and the need now is a sustainable farming pattern.
- A much wider area can still be brought in, and the movement transformed into an evergreen revolution, M. S. Swaminathan’s phrase for productivity in perpetuity without ecological harm.
- Small holdings, neglected regions and overlooked crops form the agenda.
Previous Year Questions
2016“India has paid heavily for the achievement of the Green Revolution in the form of economic, social and ecological cost.” Discuss.2014“In spite of various negative impacts of the Green Revolution, there is a demand for a New Green Revolution.” Elaborate.2012Write about Prospects of Rainbow Revolution in India.2002Critically evaluate the dual impacts of green revolution in India.1997Discuss the impact of green revolution on the agricultural production in India.1992What is meant by Green Revolution? Explain its successes and failures.





Thank You
Thank You so much for such a comprehensive explanation. Um.. In the demerits it has been written that green revolution entrenched patriarchy, how?
Average wage of 7% of male labour was increased in compared to the women workforce and sometime they were unpaid too, which might be one of the reason of such Patriarchal strengthening and which lead to gender parity.
Ultimate …terse,and lucid..
useful
good info