

- A fertilizer is a soil amendment applied to promote plant growth. Demand for it rose sharply with the Green Revolution and its high-yielding variety (HYV) seeds.
- Why Indian soils need it: thousands of years of cropping have exhausted soil fertility and lowered productivity. Manure and fertilizers restore the capacity for good yields.
- HYV seeds, fertilizers and irrigation, with technology, form the trio behind India’s unprecedented growth in farm output.
- Fertilizer use is often called a barometer of agricultural prosperity. About 70% of the growth in farm production has been credited to its wider application.
Benefits and Types
Benefits of Fertilizer
- It raises farm output through more intensive cropping under multiple-cropping programmes.
- HYV seeds perform well only with fertilizers. Their short, sturdy stems can carry heavy doses.
- Different soils call for different nutrients:
- Deccan and lateritic soils need more phosphorus and potassium.
- Alluvial soil needs more nitrogen.
- Sugarcane lands of Maharashtra and Karnataka need more potassium.
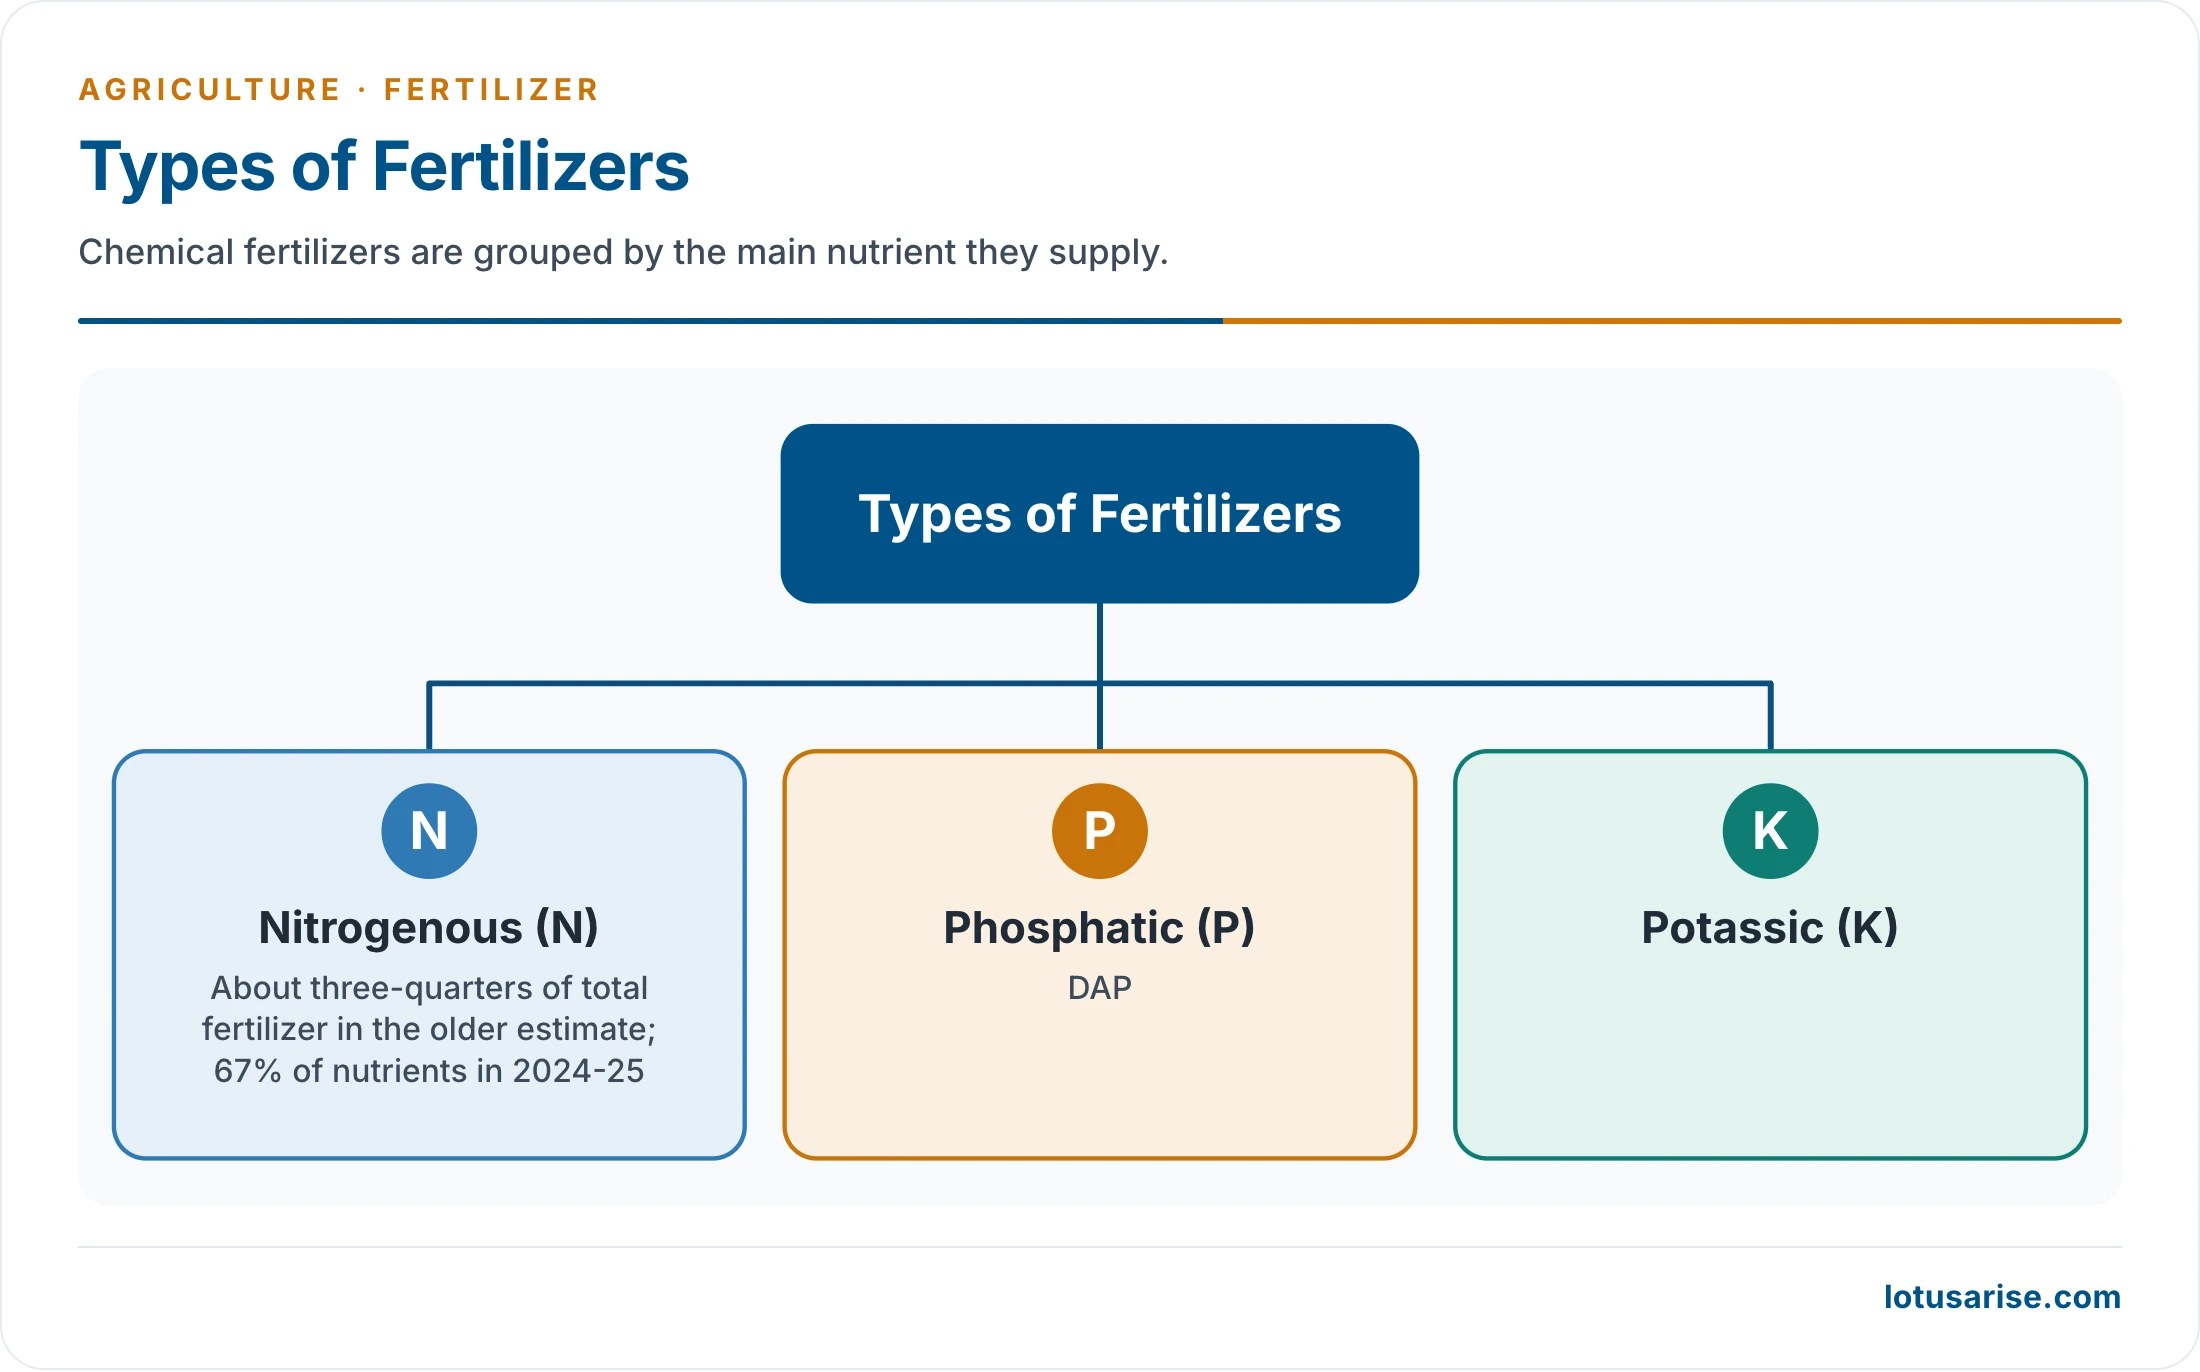
- In 2024-25, nitrogen was 67% of all nutrients consumed, against an older estimate of about three-quarters.
Production and Consumption
Trends
- Rank: India has ranked third among producers, behind China and the USA, and second among consumers, behind China.
- Production of all fertilizers rose from 1,059 thousand tonnes in 1970-71 to 16,092 thousand tonnes in 2013-14, more than 15 times in four and a half decades. It reached 20,711 thousand tonnes in 2022-23.
- Consumption and imports rose as well, and imports remain large:
| Year | N (thousand tonnes) | P | K | Total | Kg per hectare of gross cropped area |
|---|---|---|---|---|---|
| 2001-02 | 11,310 | 4,382 | 1,667 | 17,360 | 92.33 |
| 2010-11 | 16,558 | 8,050 | 3,514 | 28,122 | 142.52 |
| 2020-21 | 20,404 | 8,978 | 3,154 | 32,536 | 137.15 |
| 2023-24 | 20,456 | 8,307 | 1,879 | 30,642 | 139.69 |
| 2024-25 | 22,148 | 8,396 | 2,384 | 32,928 | 150.11 |
- Product mix (2025-26): urea 396.60 lakh tonnes, DAP 100.80, MOP 22.56 and NPKS complexes 150.37, as reported to the Rajya Sabha in July 2026.
Regional Pattern
- All-India use was long quoted at 165 kg per hectare of NPK, a figure measured on arable land and permanent crops (2010). State differences are huge.
- Total consumption:
- In 2011-12, Uttar Pradesh led (4,207 thousand tonnes), and Andhra Pradesh and Maharashtra took more than 3,000 thousand tonnes each.
- In 2024-25, Uttar Pradesh (5,564), Maharashtra (3,274) and Madhya Pradesh (3,203) were the leaders.
- North-eastern India depends least on chemical fertilizers.
| Rank (2011-12) | State | Consumption |
|---|---|---|
| 1 | Andhra Pradesh (undivided) | 266 kg/ha |
| 2 | Punjab | 243 kg/ha |
| 3 | Tamil Nadu | 227 kg/ha |
| 4 | Haryana | 224 kg/ha |
| 5 | North-eastern States (Nagaland, Arunachal Pradesh) | Lowest, about 3–5 kg/ha |
- Among Union Territories, Puducherry topped this list at 674 kg/ha.
Per Hectare Consumption of Fertilizers
- India has progressed a great deal in making and using fertilizers, yet it still lags several countries in use per hectare.
- Pakistan, China and Bangladesh used more than India in the 2010 comparison.
- Most European countries, Egypt, Chile, Japan and New Zealand used much larger amounts.
- The latest table (2022, per hectare of arable land and permanent crops) has shifted:
| Country | Kg/ha, 2010 | Kg/ha, 2022 |
|---|---|---|
| China | 400.3 | 350.4 |
| Bangladesh | 224.0 | 324.2 |
| Egypt | 368.7 | 407.4 |
| Japan | 212.5 | 186.7 |
| Pakistan | 184.7 | 141.1 |
| India | 165.8 | 177.6 |
- So Pakistan now uses less than India on this measure.
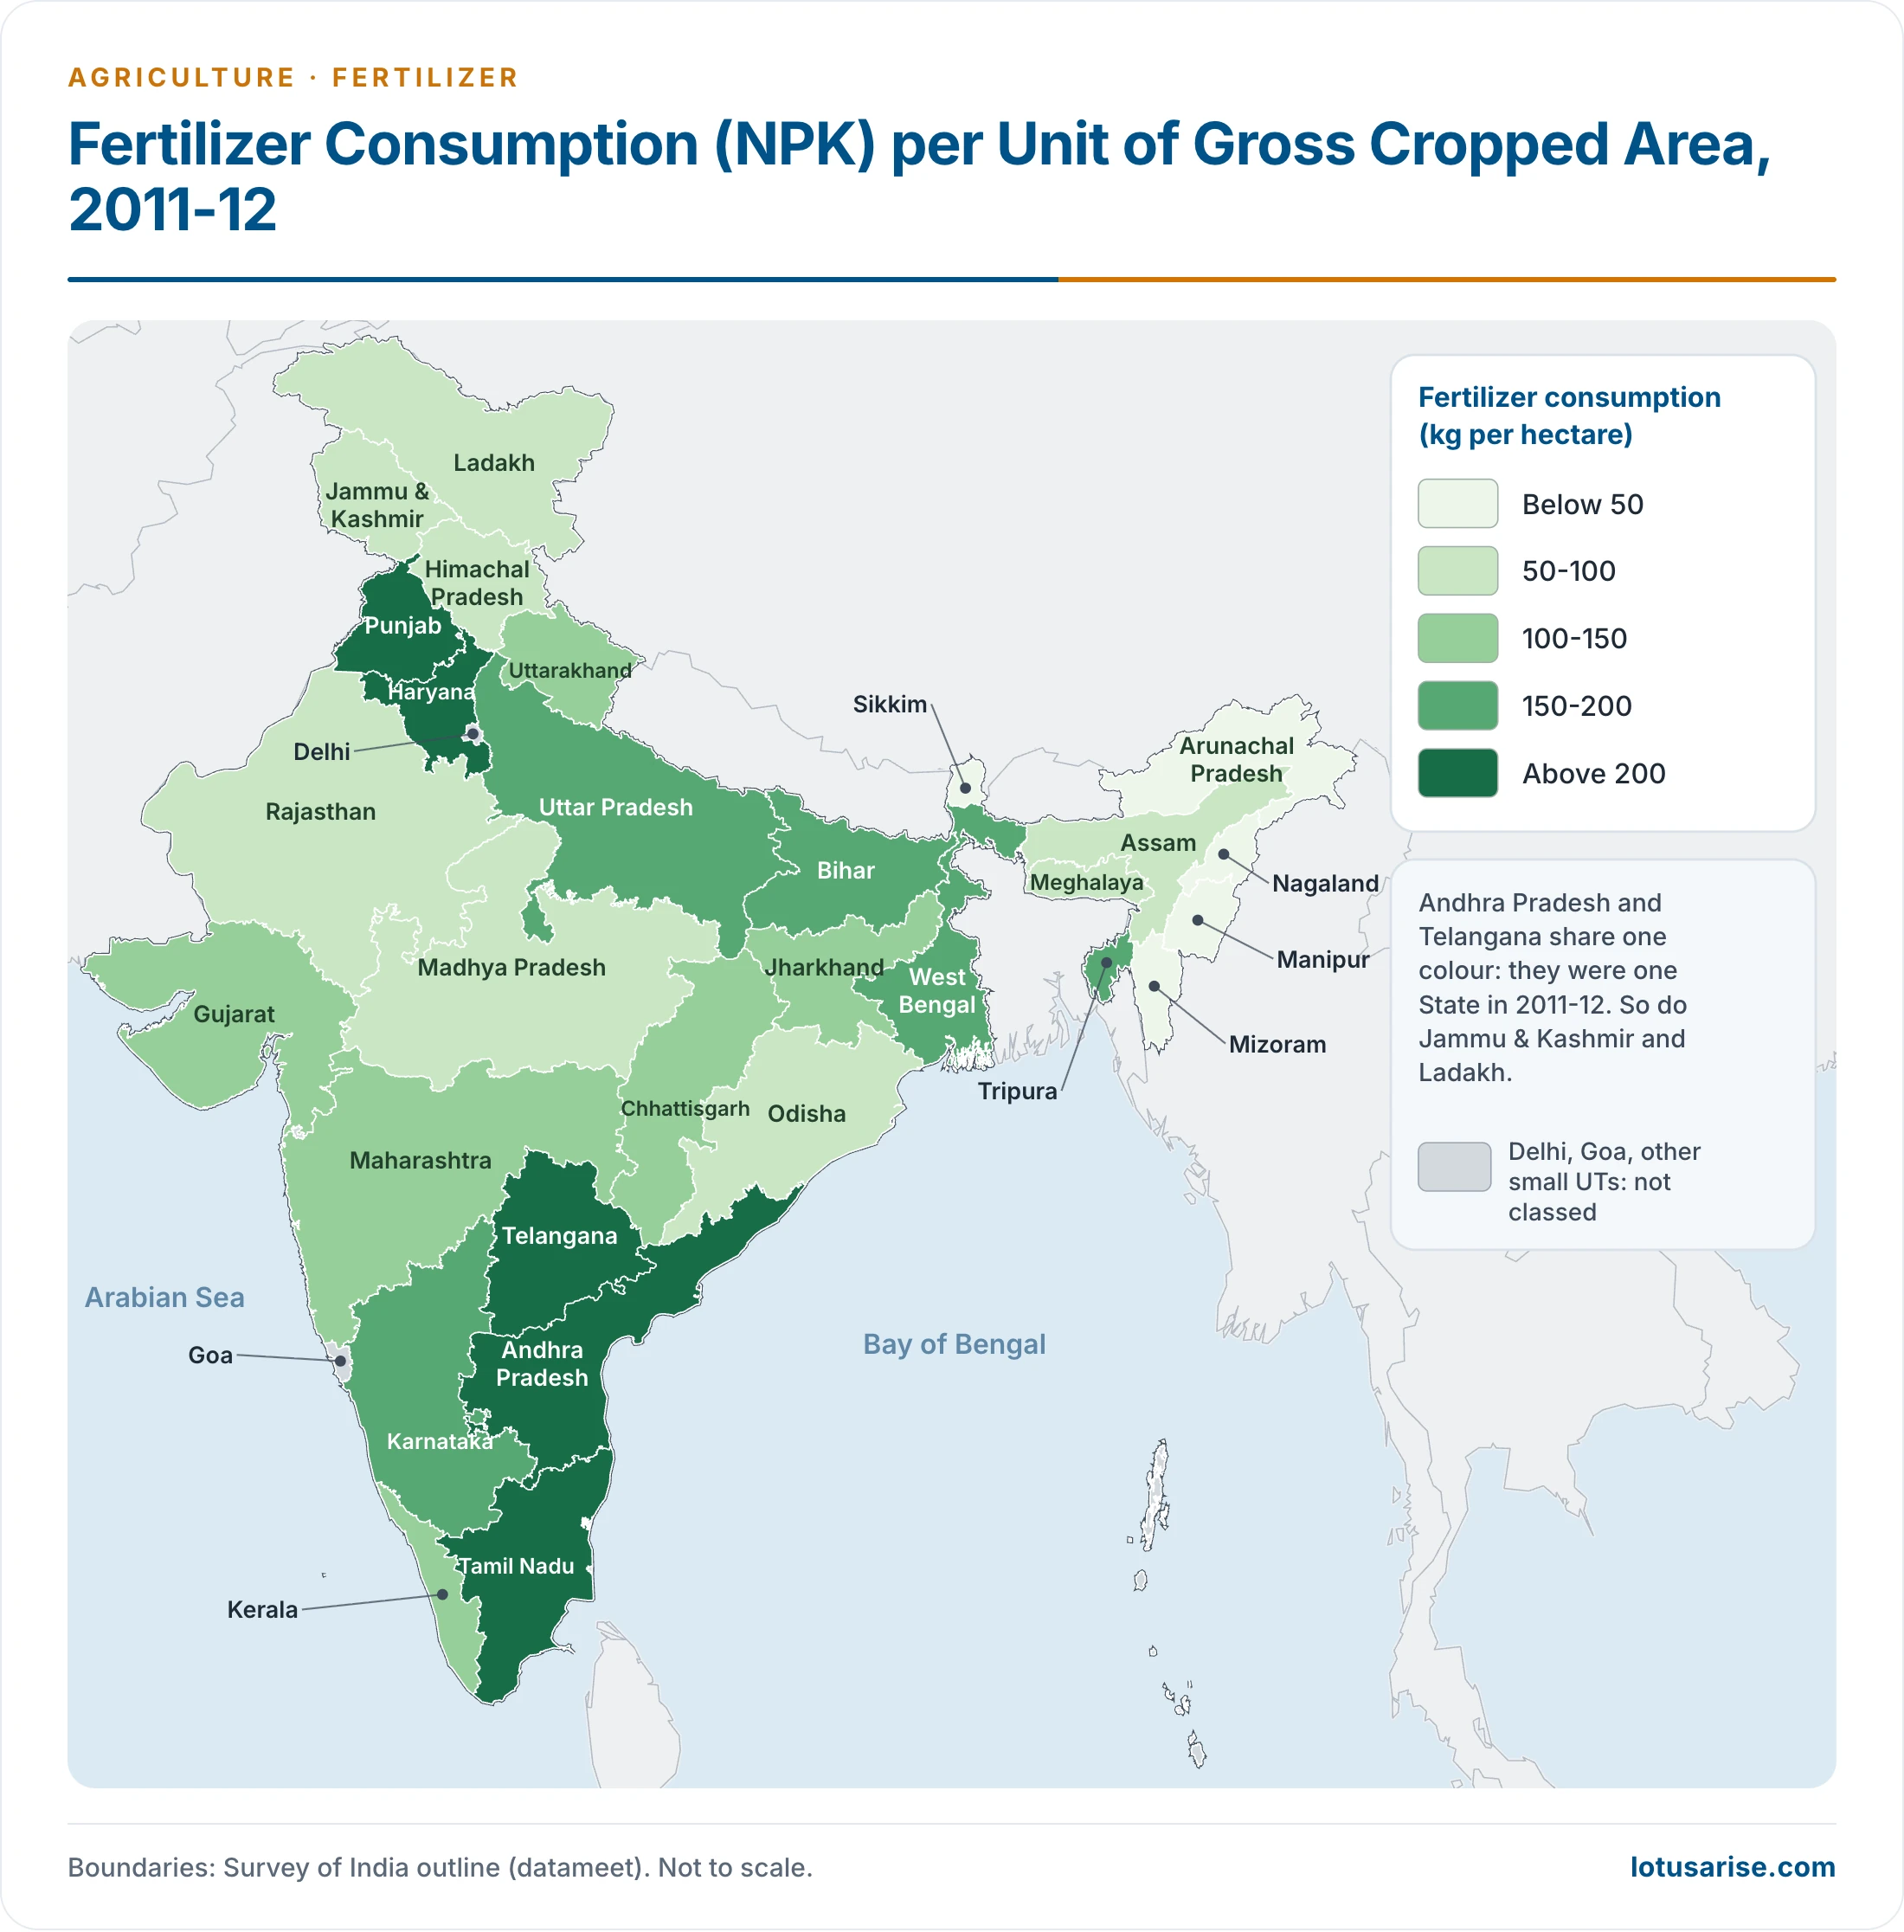
- This map shows 2011-12, before Telangana was formed. The 2024-25 national level is in the table above.
Problems in the Fertilizer Sector
- Low consumption by world standards (165 kg/ha) reflects:
- Lack of awareness among farmers.
- Weak distribution and short supply.
- Poor irrigation facilities, which lead to under-application.
- High prices, beyond the reach of poor farmers.
- Wide imbalance runs through every dimension of use:
- Type of nutrient: different regions use different fertilizers on the same crop. Given land-use patterns, the Hanumantha Rao Committee treated 4:2:1 as the ideal NPK ratio. The real ratio is much wider.
| Year | N:P:K |
|---|---|
| Ideal | 4 : 2 : 1 |
| 1990-91 | 6.0 : 2.4 : 1 |
| 1993-94, after P and K prices were freed | 9.7 : 2.9 : 1 |
| 2009-10 | 4.3 : 2 : 1 |
| 2012-13 | 8.2 : 3.2 : 1 |
| 2024-25 | 9.3 : 3.5 : 1 |
- Season: needs vary with season, and rainfall makes them more uncertain. Rabi takes more than kharif, largely because of the monsoon’s uncertainty.
- Crop: crops differ in nutrient needs. Use is high on rice, wheat and sugarcane with HYV seed and irrigation, and low on pulses, coarse grains and oilseeds.
- Soil: soils differ too. Good carbon and organic matter reduce the need for fertilizer. Sikkim has moved to organic farming to cut chemical use.
- Region: Punjab, Andhra Pradesh, Haryana and Uttar Pradesh use heavily. Within States, use gathers in the few districts with strong irrigation and HYV seed.
- Urea bias: high subsidy drives high production and use of urea, which stays outside the Nutrient Based Subsidy scheme.
- Neglected nutrients: soil also needs sulphur, zinc and calcium among its sixteen nutrients. NPK-centred monoculture is depleting micronutrients.
- Dung as fuel: cow dung gives the best manure, but much of it is burnt as kitchen fuel in dung cakes, as firewood shrinks and rural fuel demand grows.
- Pollution: nitrate runs into soil and water, and causes eutrophication (algal bloom).
- Yield response: where consumption is already high, crop productivity has not risen in step with fertilizer use.
- Import dependence:
- India makes about 80% of its urea at home, and depends largely on imports for potassic and phosphatic fertilizers.
- Potash has no domestic production in the official series, so it comes entirely from imports.
- Product imbalance: the old pattern was urea 57%, DAP 17% and MOP 6%. In 2025-26, urea was 59%, DAP 15%, MOP 3% and NPKS complexes 22% of product sold.
- Investment policy: the New Investment Policy 2012 was notified to raise domestic capacity and reduce import dependence. It concerned the urea sector, and the National Investment Policy for Urea 2026 now follows it.
- Subsidy: the Nutrient Based Subsidy (NBS) scheme, from 2010, pays a fixed subsidy on P and K fertilizers according to nutrient content, with extra support for secondary and micronutrients.
- Companies set the retail price, and farmers paid 61–75% of delivered cost in 2014.
- The total was Rs 67,971 crore in 2013-14 (revised estimate).
- It is budgeted at Rs 1,70,799 crore for 2026-27 (urea Rs 1,16,799 crore, others Rs 54,000 crore), after a revised Rs 1,86,460 crore in 2025-26.
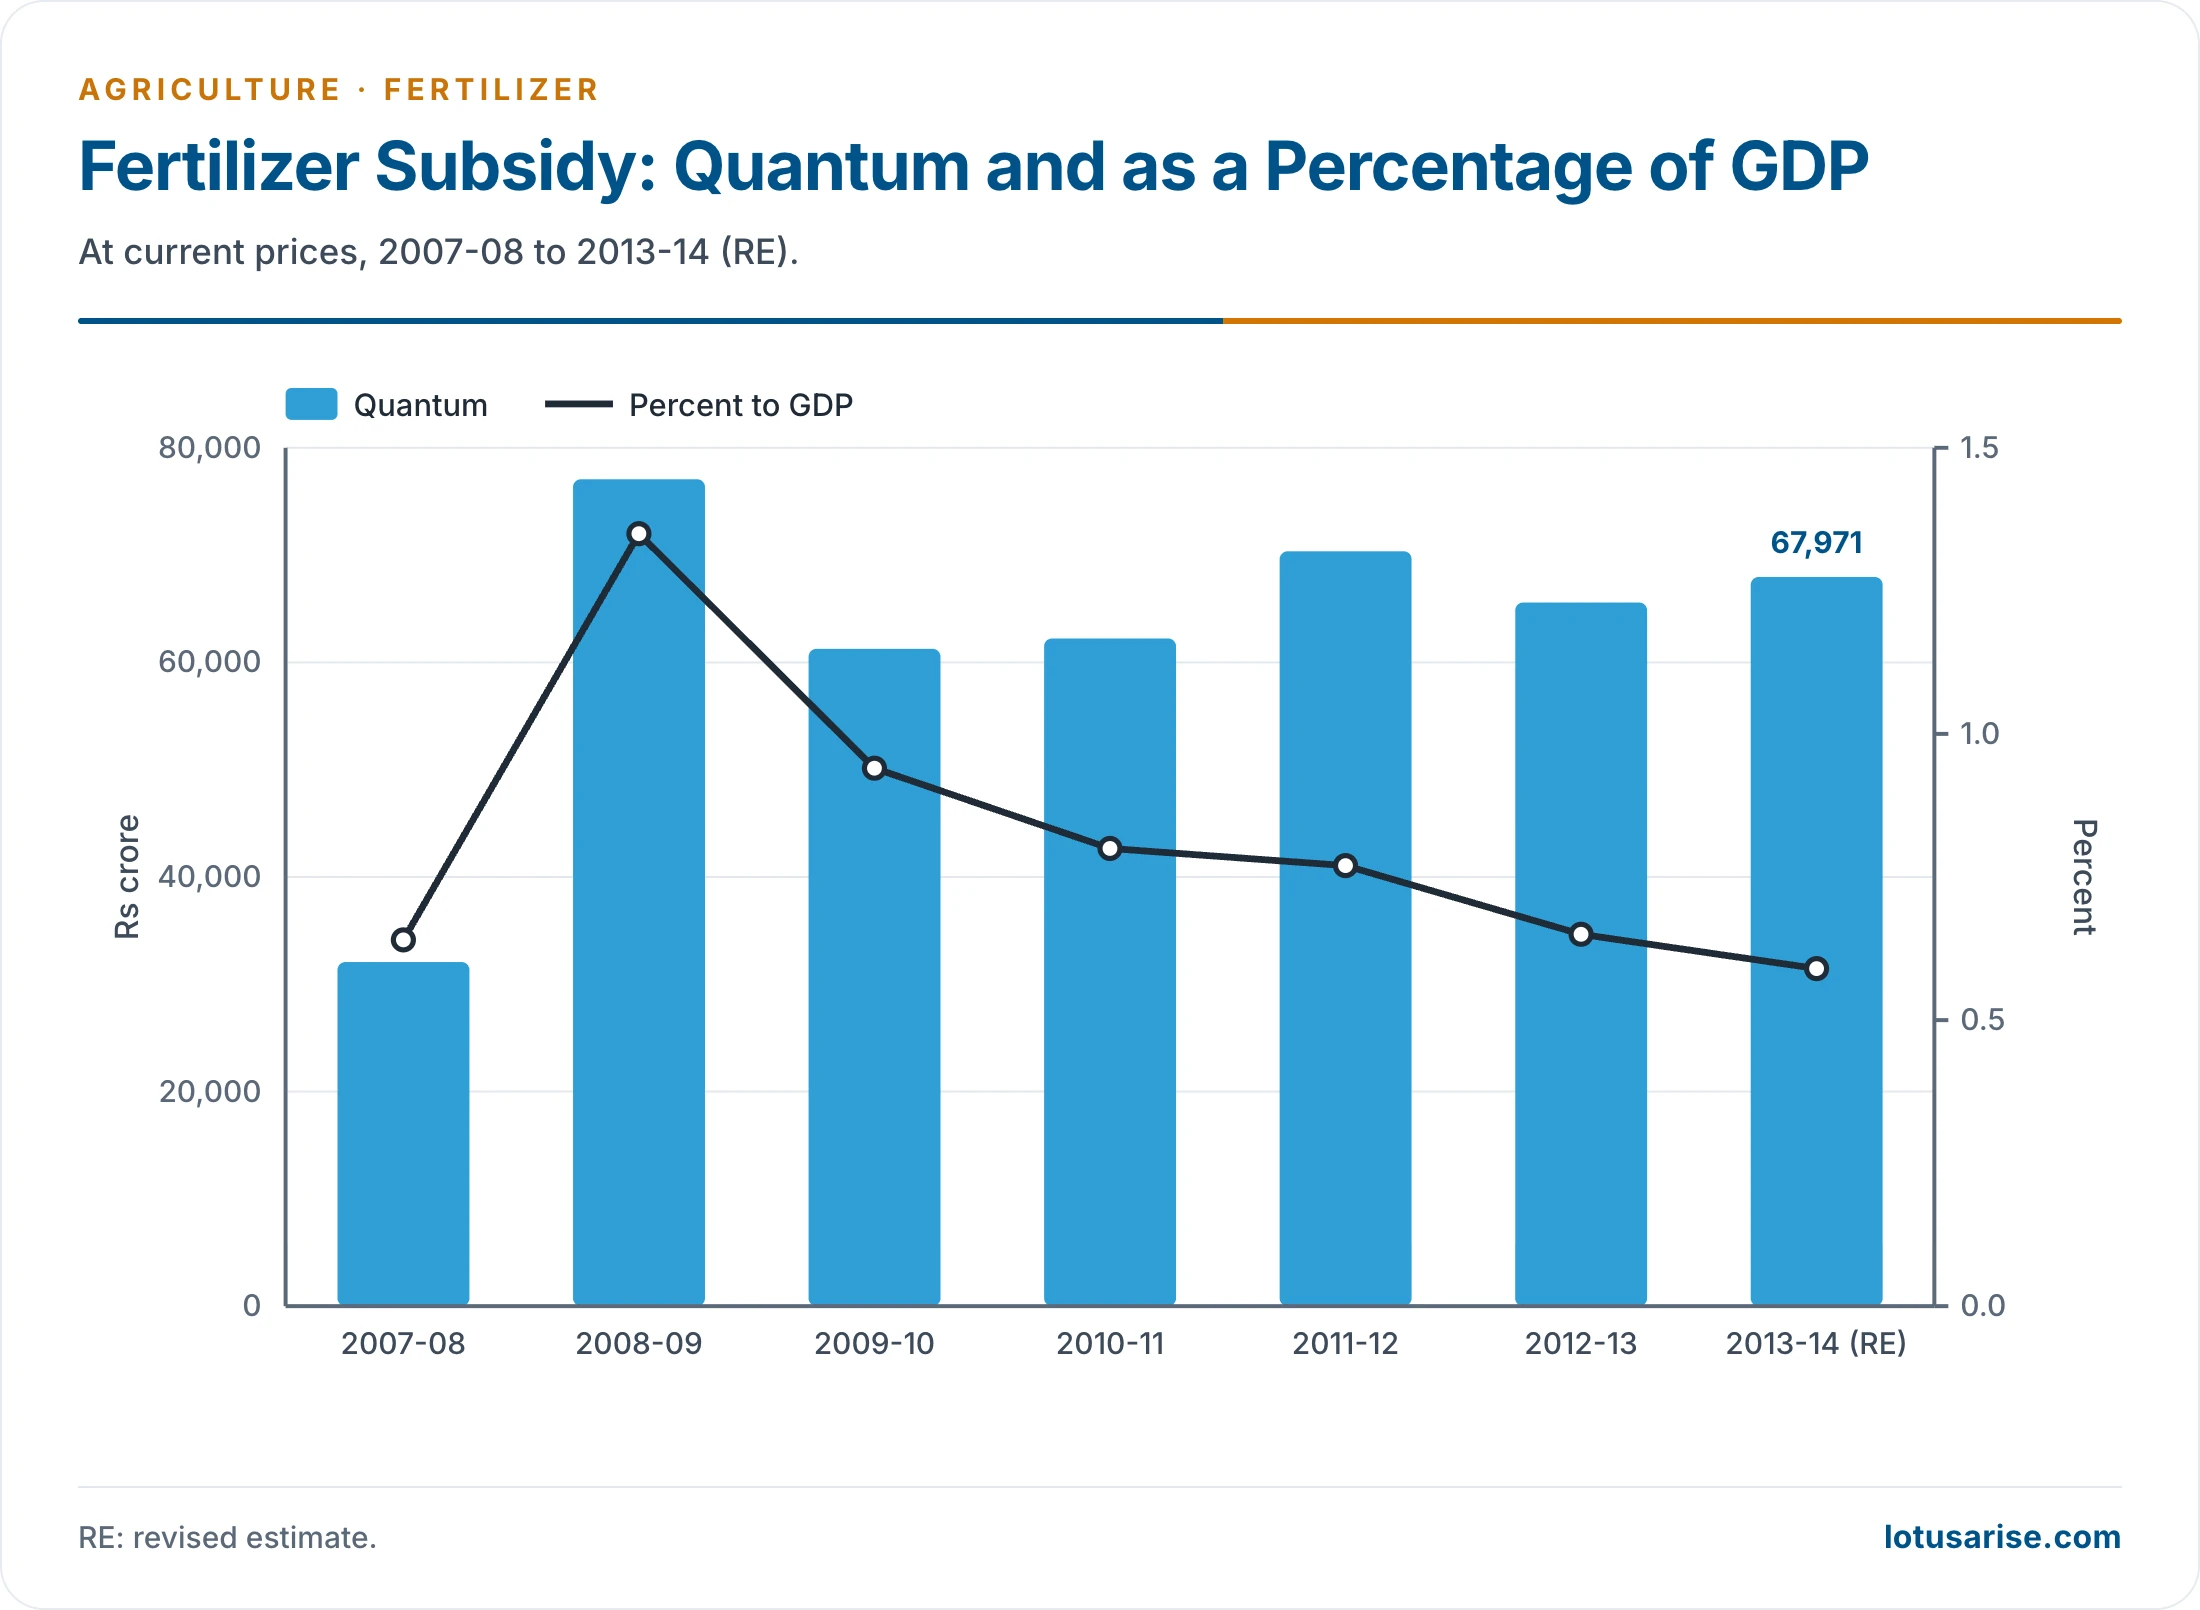
- This chart stops at 2013-14. The figures above carry the series forward.
Steps for Improvement
- Rural and urban compost has huge potential, and would solve waste disposal and supply manure at once.
- Incentives: heavy subsidy on chemical fertilizer has driven a tremendous rise in consumption.
- Quality control:
- About 52 quality control laboratories were set up at first. The count rose to 74 by 2009-10 and 84 by December 2024.
- The Central Fertiliser Quality Control and Training Institute, Faridabad, has regional centres at Navi Mumbai, Kalyani (near Kolkata) and Chennai.
- The Fertiliser (Control) Order, 1985, issued under the Essential Commodities Act, 1955, regulates trade, price, quality and distribution.
- It prohibits making, importing or selling any fertilizer below the set standard.
- Soil testing: the Soil Health Card scheme was launched on 19 February 2015 at Suratgarh, Rajasthan.
- The card shows soil fertility and recommends fertilizers by soil and crop.
- 100 mobile testing labs and about 14 crore cards in three years were the first targets. 26.09 crore cards had been issued by July 2026.
- Its theme is “Swasth Dhara, Khet Hara”.
- Mrida Parikshak scheme:
- A digital mobile soil test kit.
- It tests parameters such as pH, NPK and micronutrients.
- Farmers get the results by SMS.
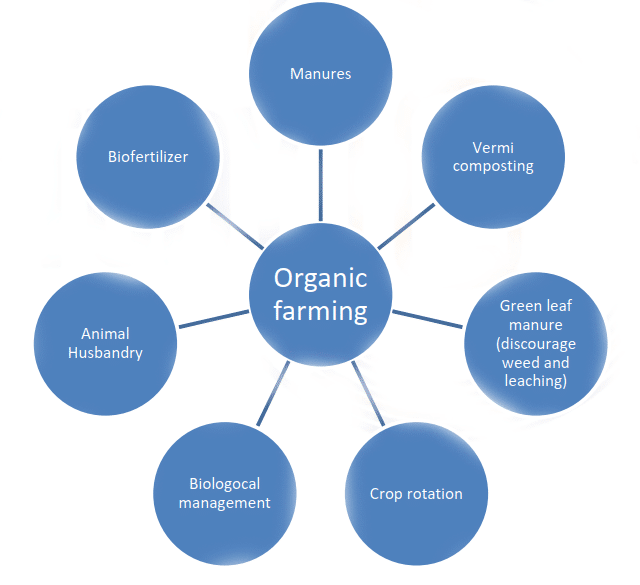
- Organic sources: cattle dung, urban compost, sewage sludge and green manure should be promoted.
- Biofertilizers: microorganisms that fix atmospheric nitrogen or make other nutrients, especially phosphate, more soluble. Examples are blue-green algae and Rhizobium.
- Cheap imports: sourcing from low-cost suppliers such as Ukraine, with subsidies to lift use in low-consumption areas.
- Equitable distribution to reduce regional, seasonal and crop disparity.
- Training and demonstration on balanced use.
- Bringing urea under NBS: the 2010 scheme covers only phosphate and potash, and extending it to urea is the standing proposal.
- Direct benefit transfer: subsidy is now paid to companies against point-of-sale records. Subsidised fertilizers carry a single “Bharat” brand under One Nation One Fertiliser.
- Neem-coated urea, compulsory for domestic urea since the New Urea Policy 2015.
- Fertigation: applying fertilizer through irrigation water.
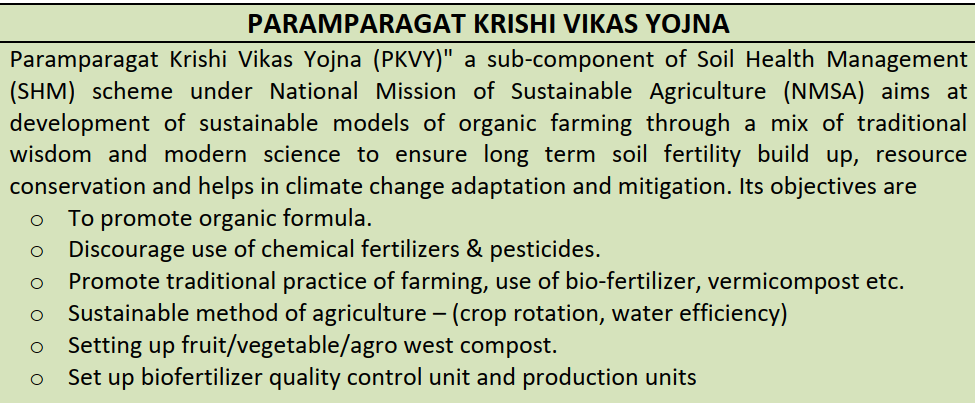
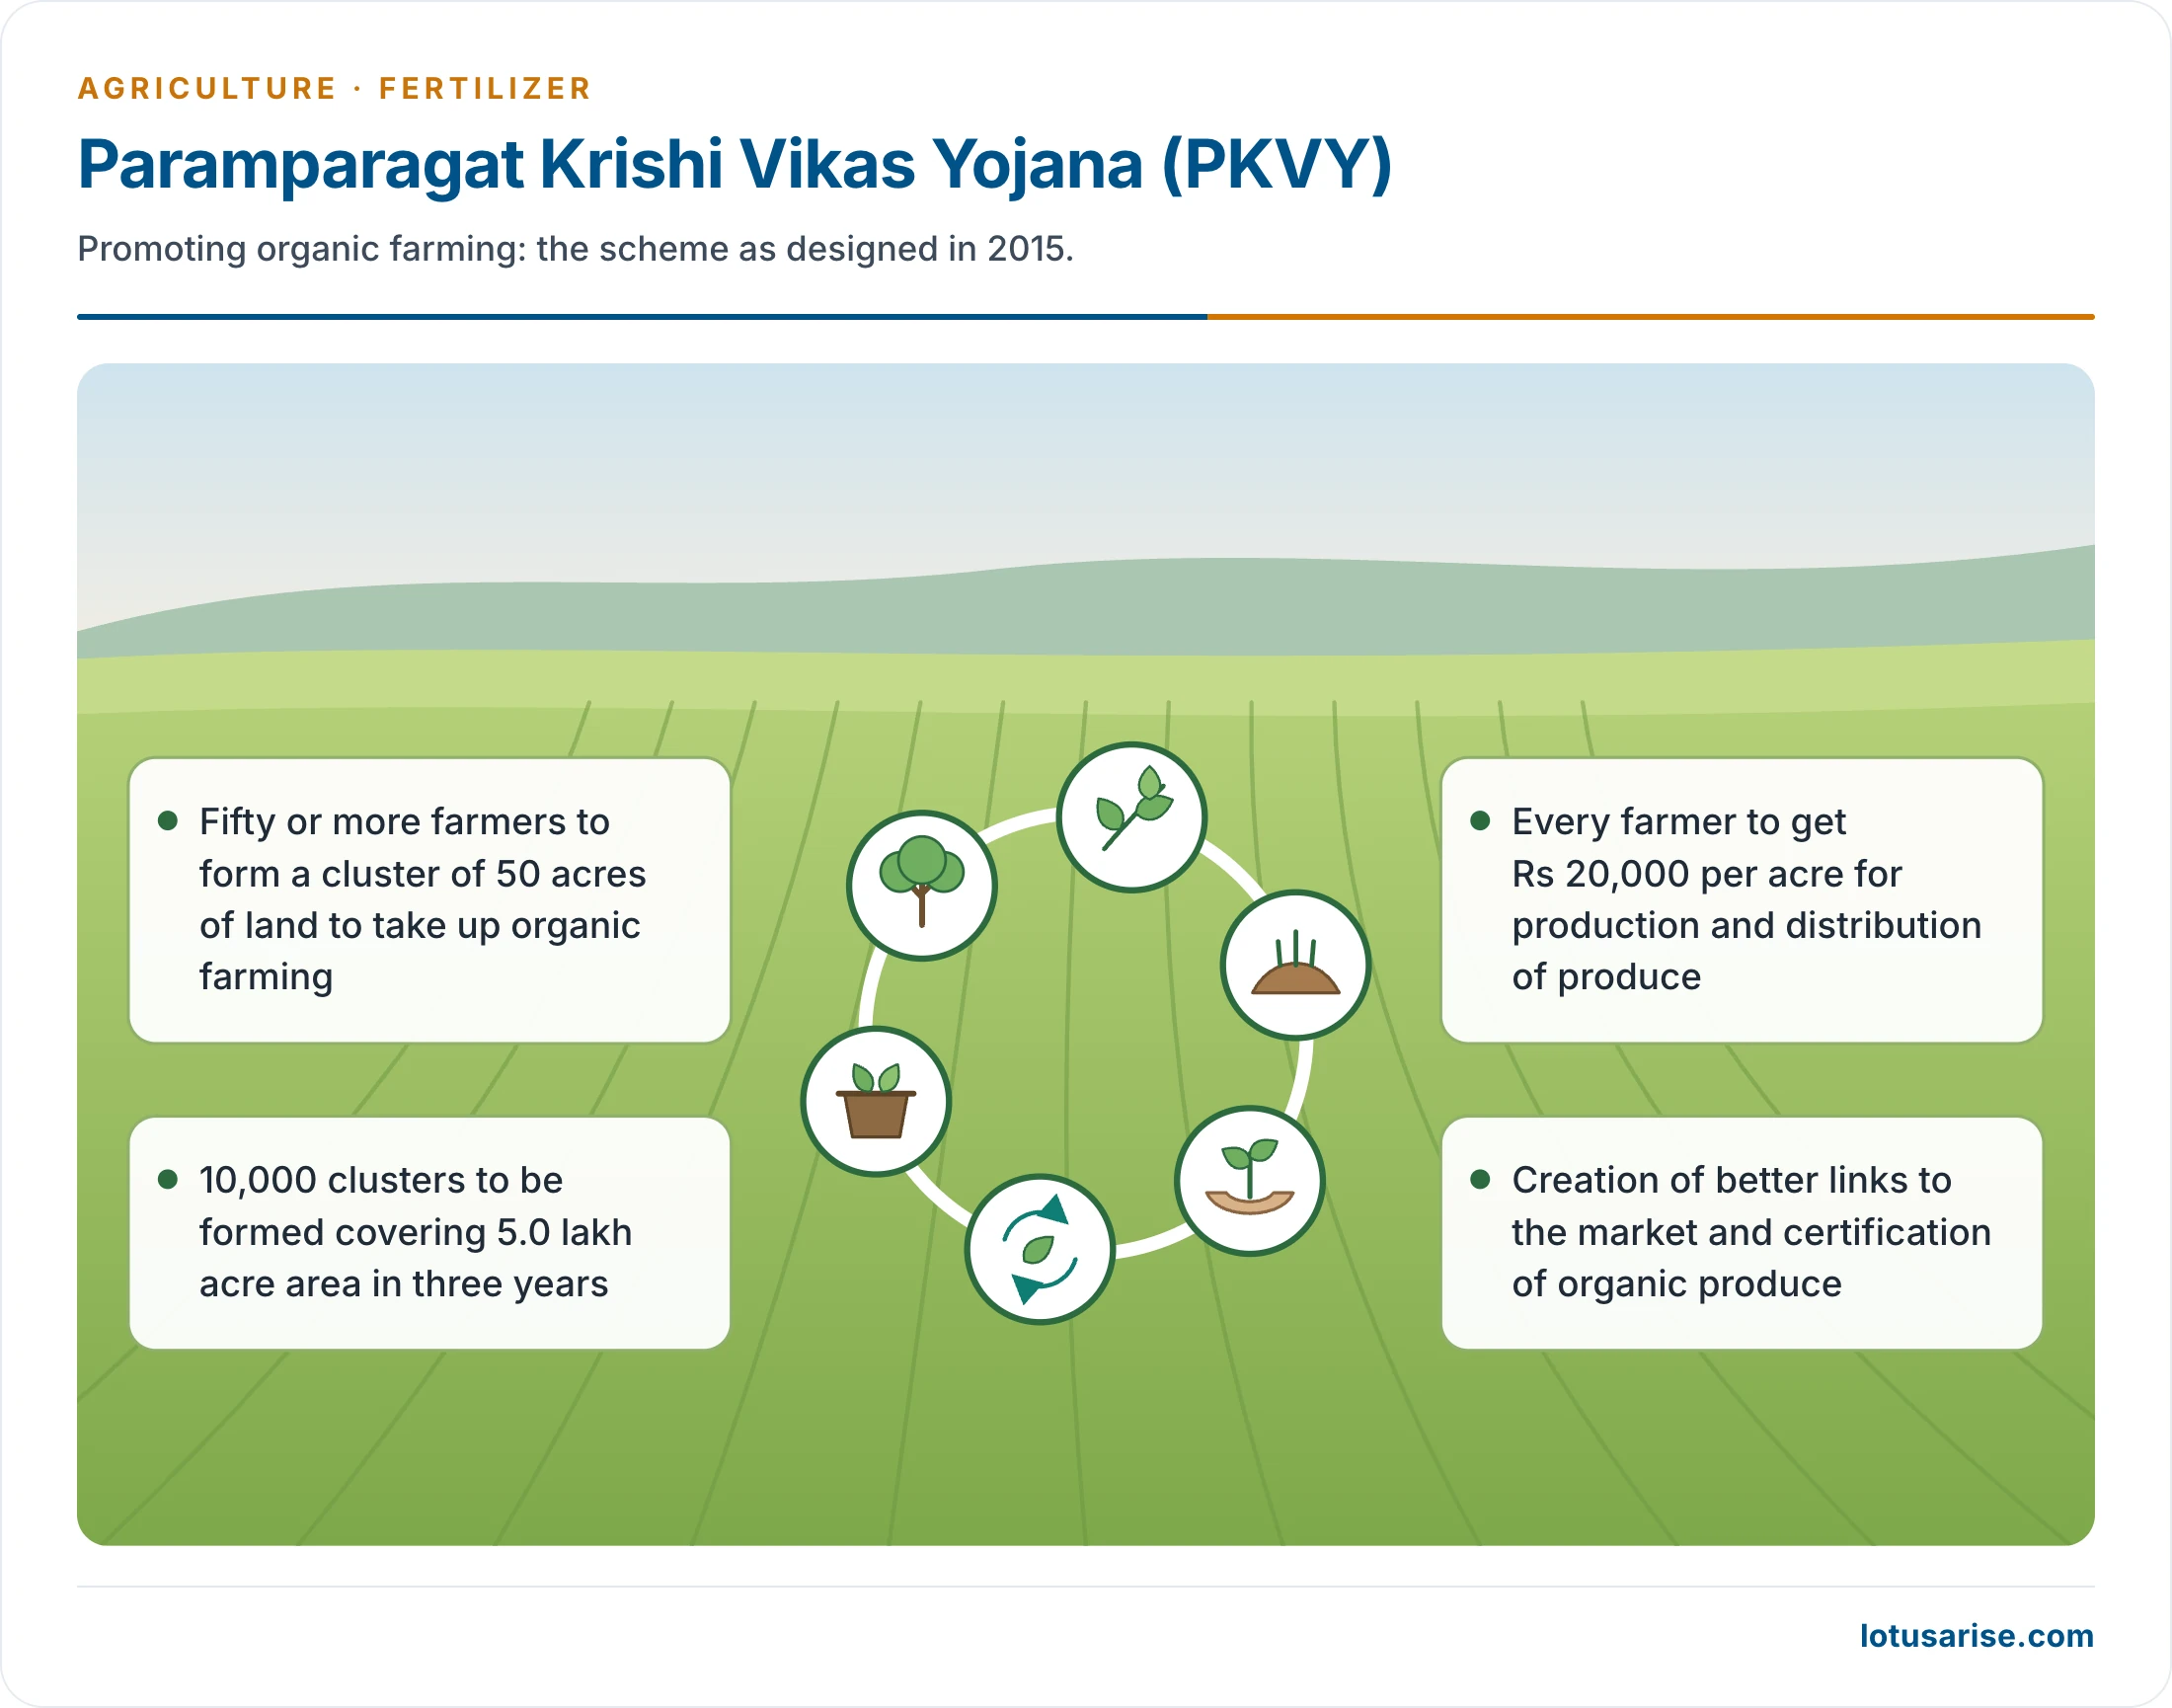
- These two charts give the original 2015 design of Paramparagat Krishi Vikas Yojana. Assistance is now Rs 31,500 per hectare over three years, including Rs 15,000 by direct transfer for organic inputs, for holdings up to 2 hectares. By June 2026 it had covered 18.93 lakh hectares and 33.63 lakh farmers. In the first chart, read “organic farming” and “agro-waste compost”.

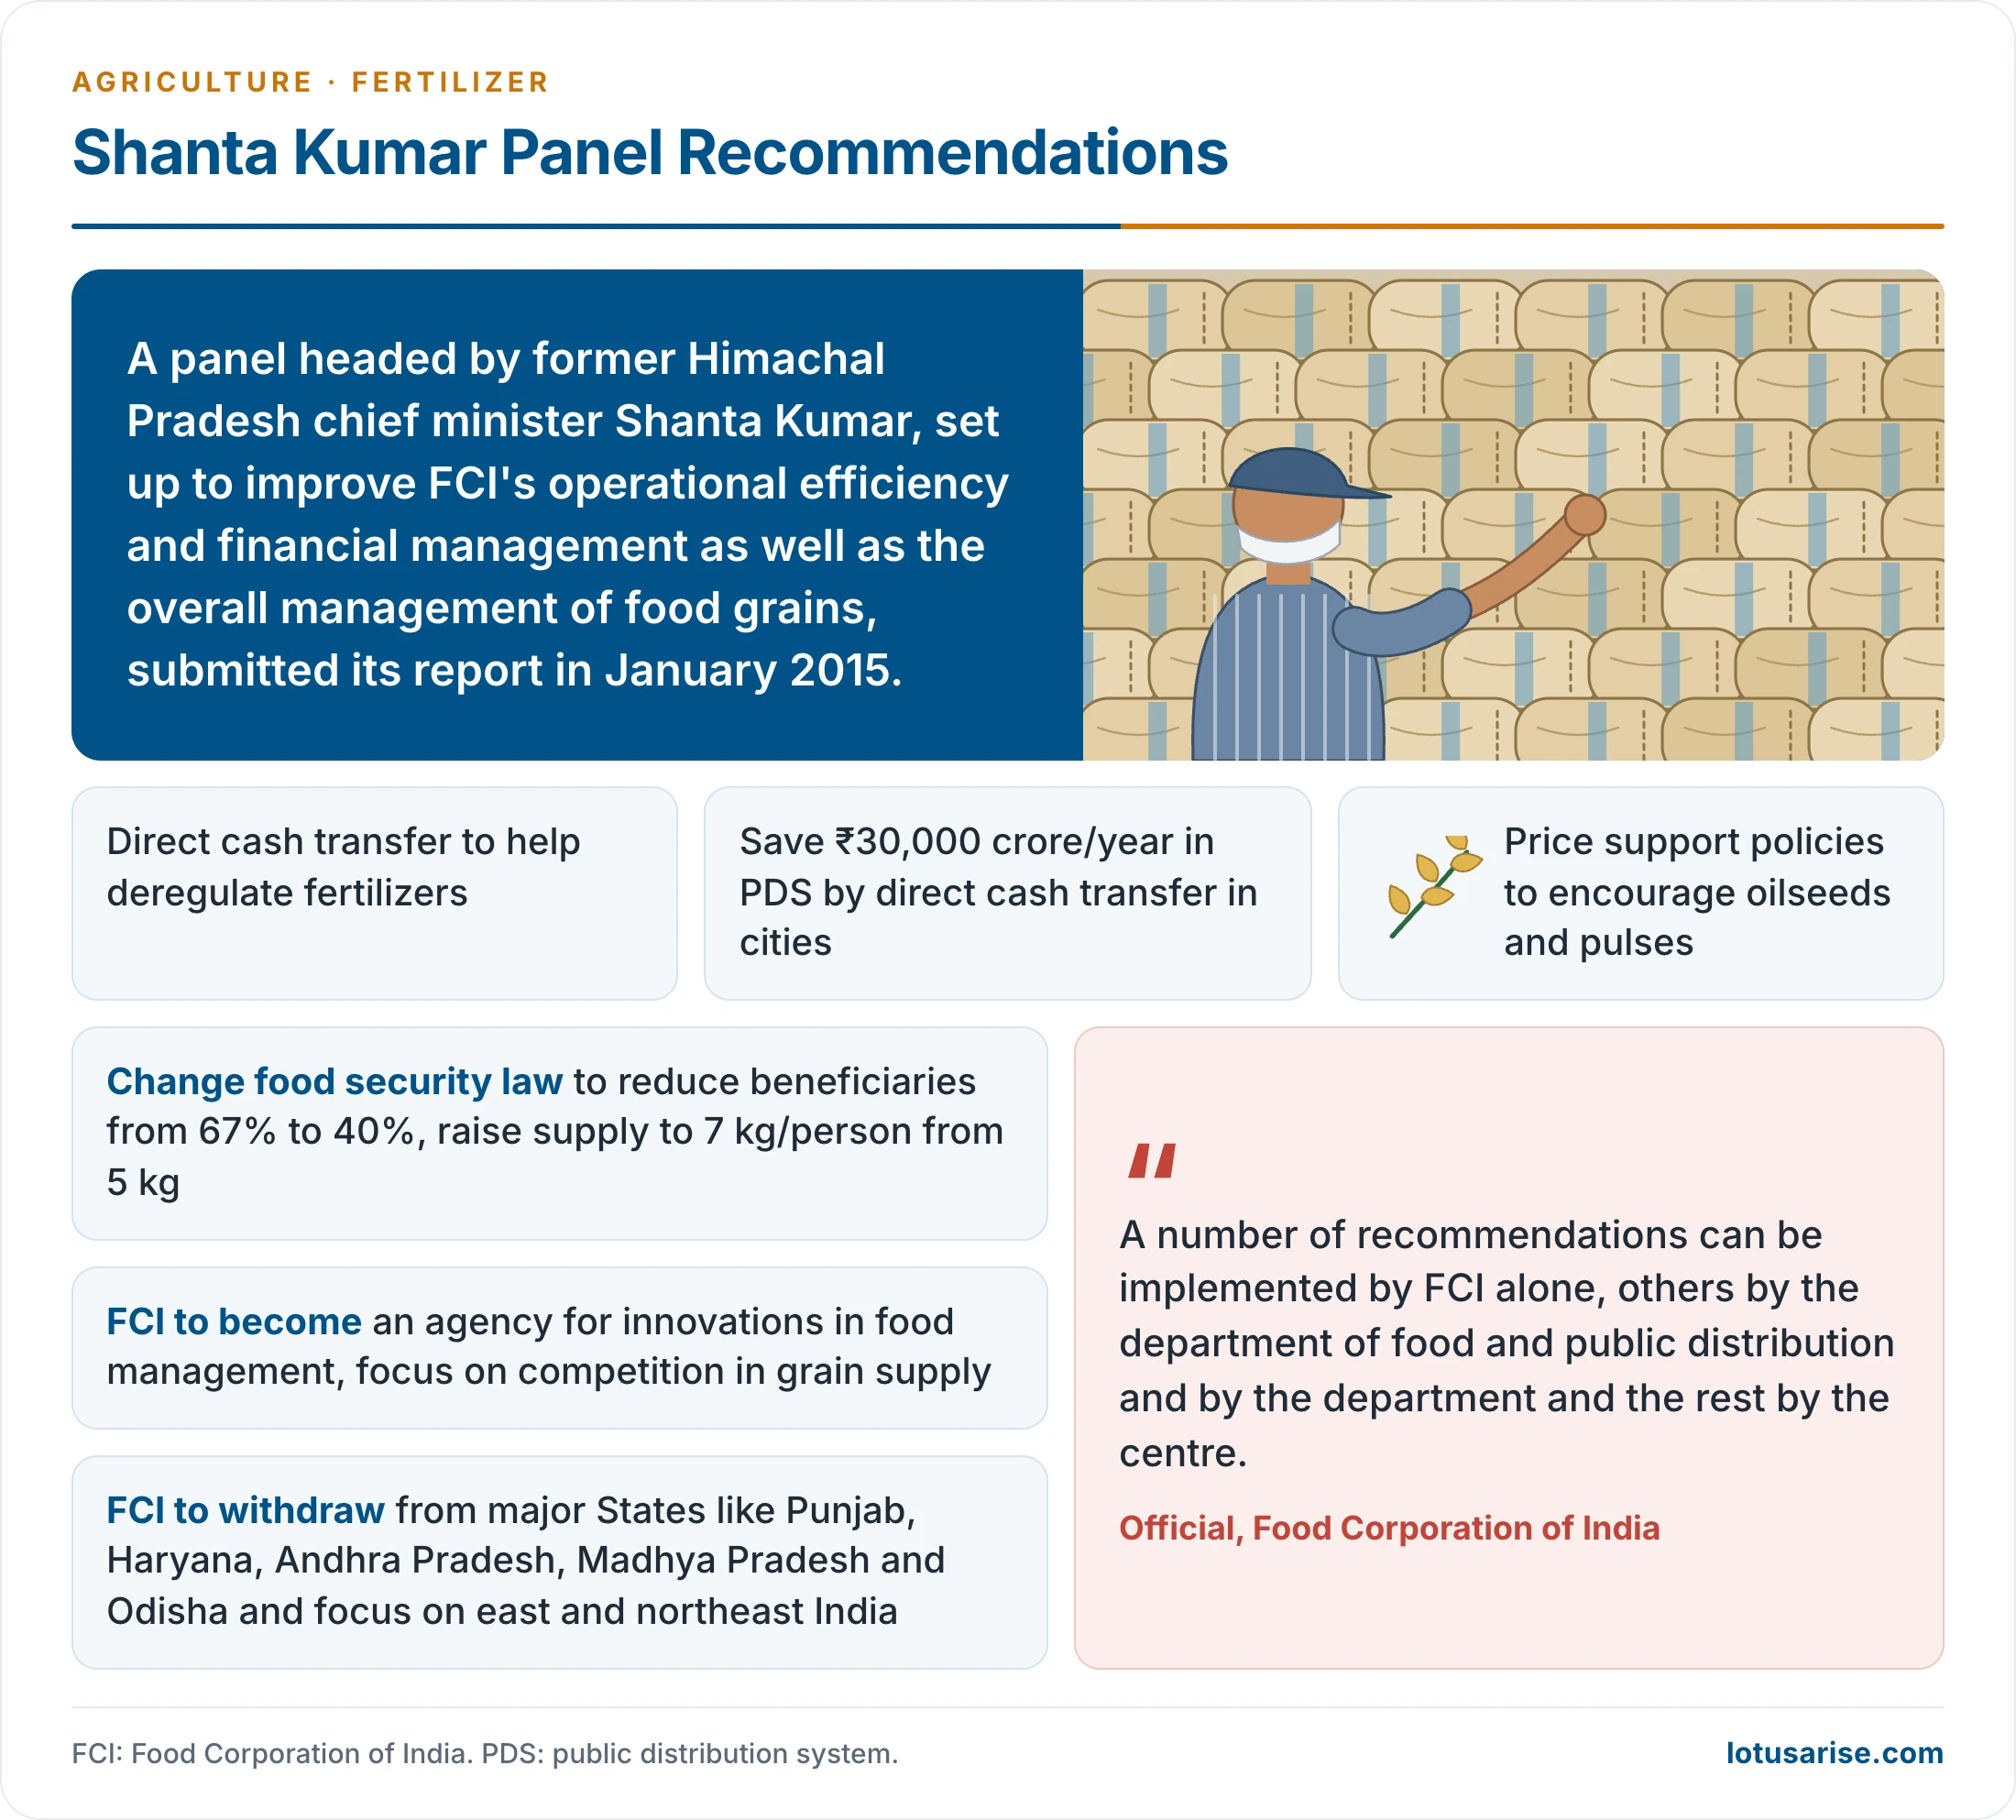
- The Shanta Kumar Committee on restructuring the Food Corporation of India reported in January 2015. Its fertilizer proposal was to deregulate the sector and pay farmers direct cash support, at about Rs 7,000 per hectare.
Vermicompost
- Vermicomposting is the breakdown of organic matter by earthworms. It yields a water-soluble, nutrient-rich, moist organic fertilizer.
- It improves soil aeration and enriches the soil with microorganisms.
- It helps root growth.
- It is easy and affordable to produce.

Neem-Coated Urea and Its Benefits
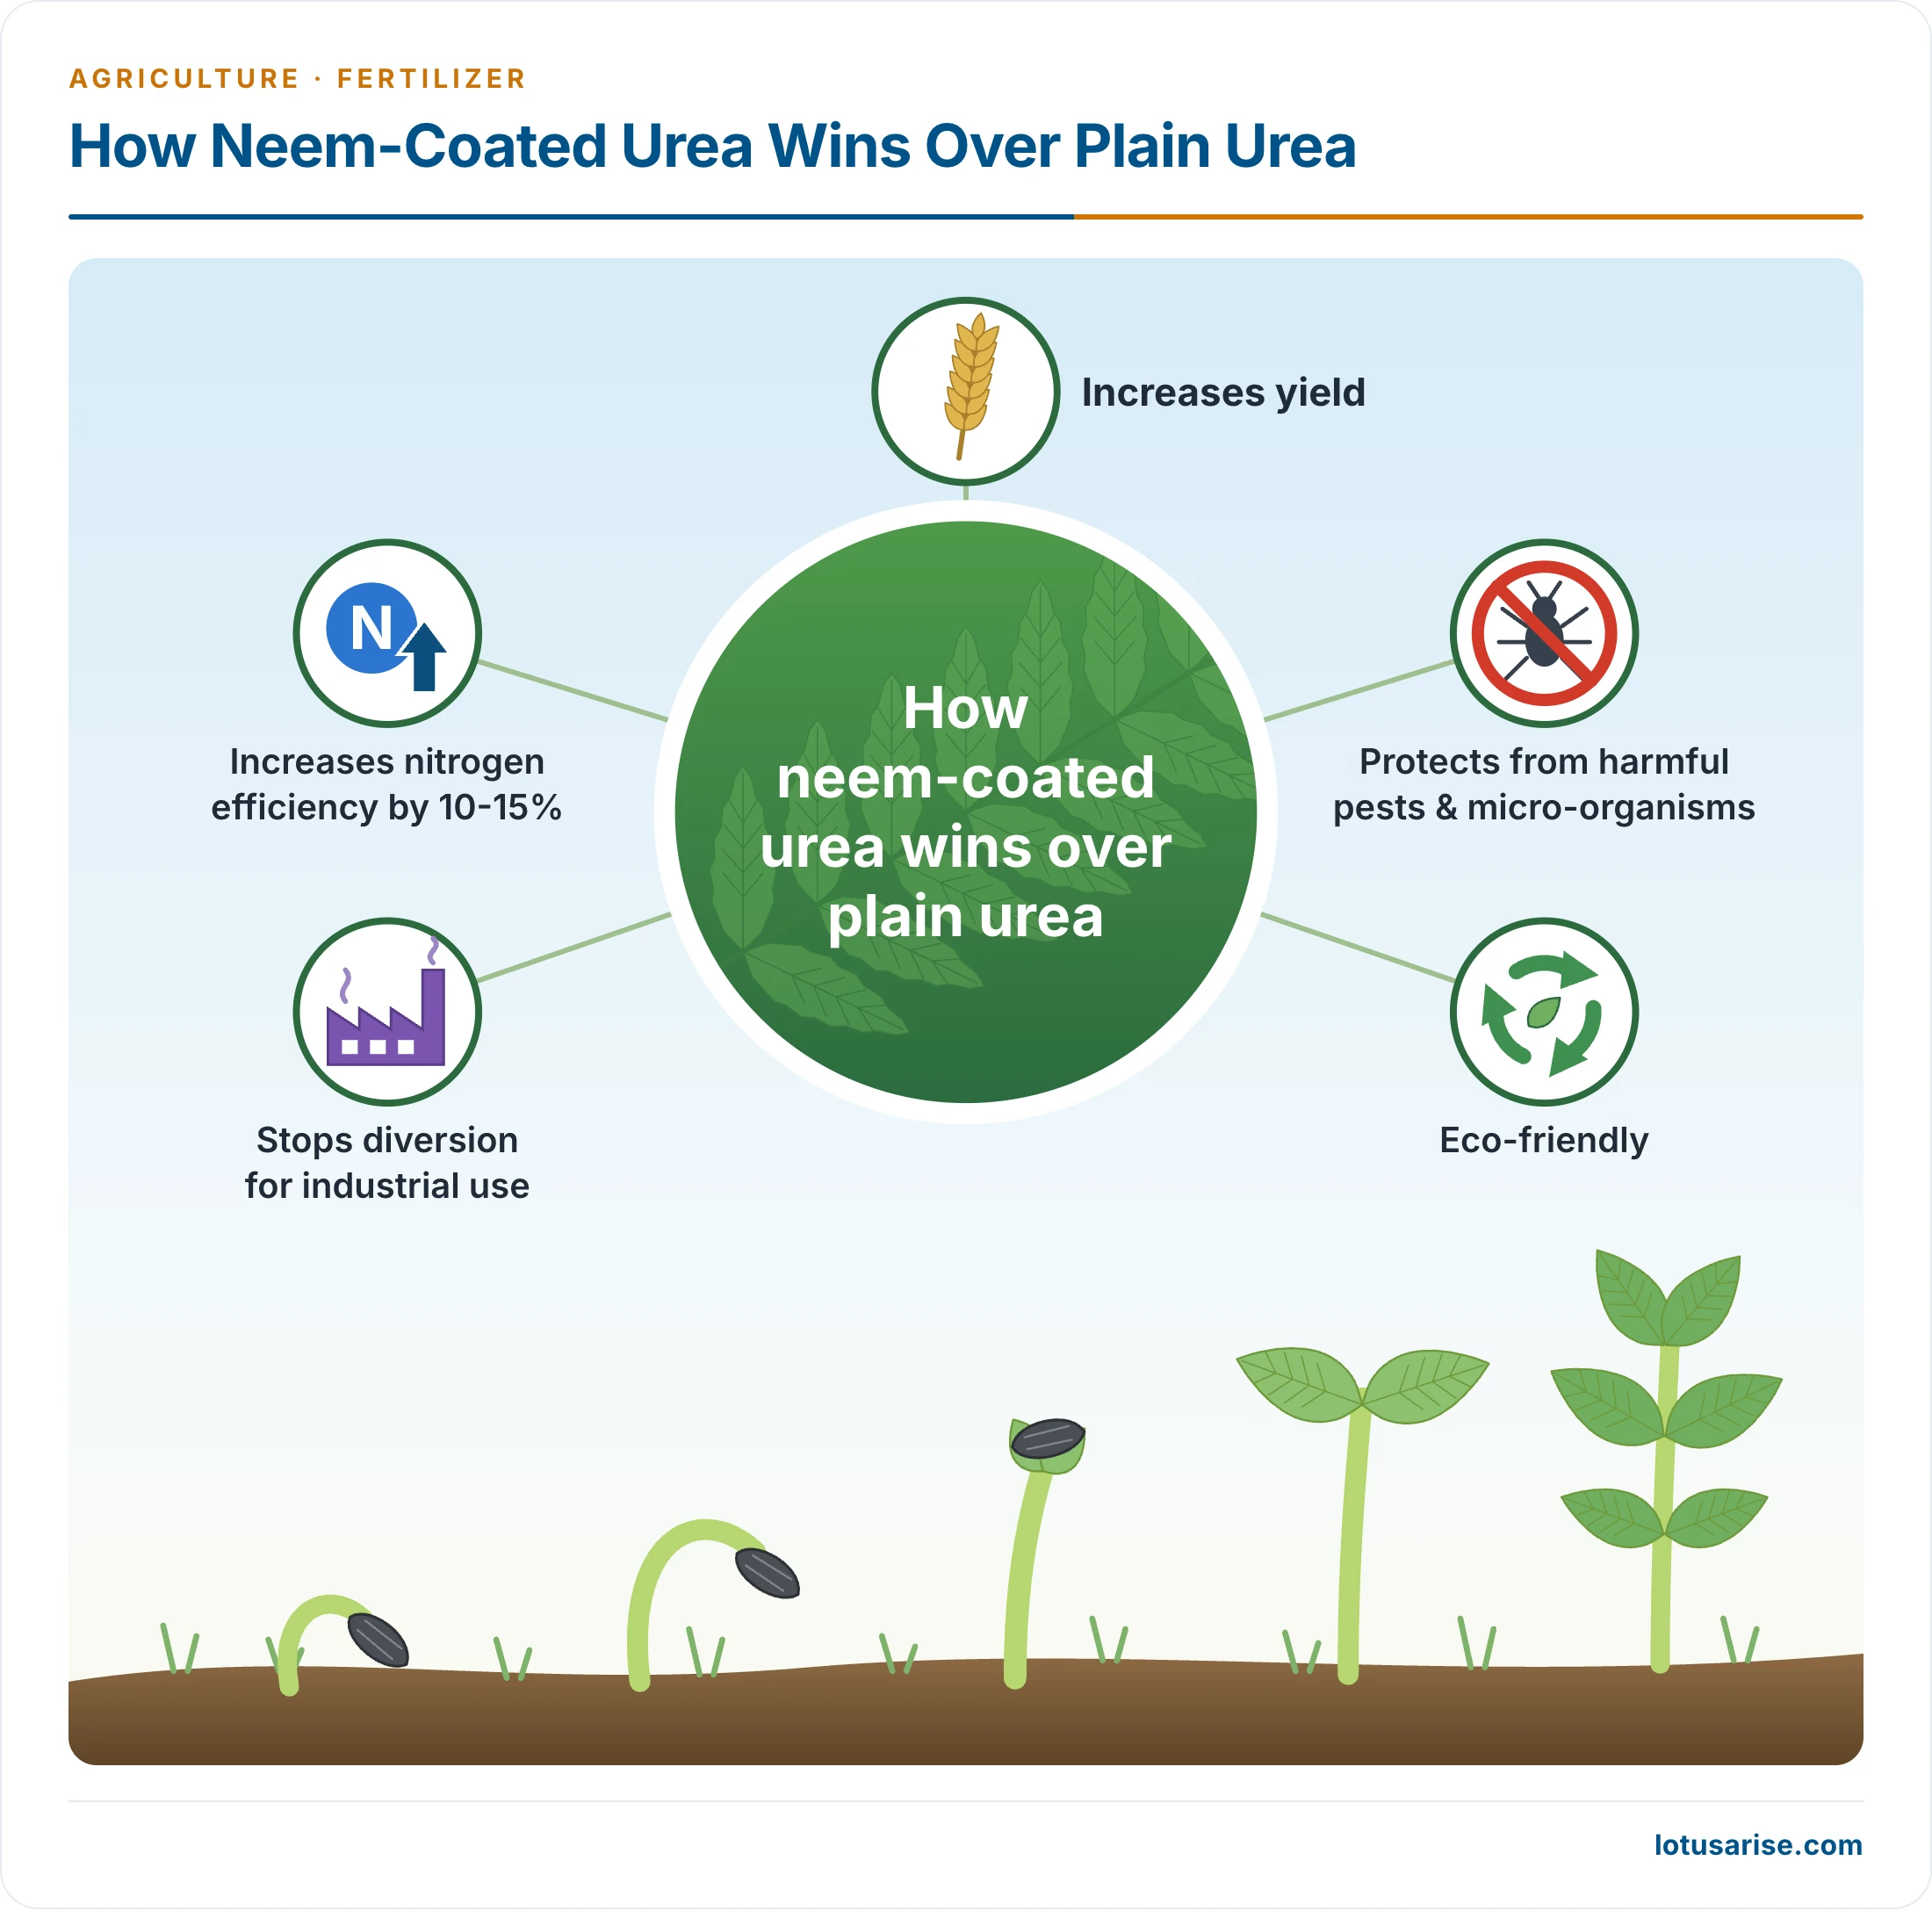
- Coating urea with neem oil or neem cake is a proven natural alternative to chemical inhibitors, because neem slows the release of urea in soil.
- Higher yield: gradual release lets plants take up more nutrient from less urea.
- Cleaner ground water: it limits contamination from leached urea.
- Pest check: neem works as a natural insecticide.
- Rural income: collecting neem seed creates rural work, which helps raise farm incomes.
- Stops diversion: the coating checks leakage of heavily subsidised urea to the chemical industry and to uses such as adulterated milk.
- Less eutrophication.
- Plain urea and neem-coated urea compared:
- A layer of neem over the plain granule supports soil fertility and higher output.
- The coating dissolves slowly, so the crop takes nitrogen according to need.
- With plain urea, much of the nitrogen is lost, washed away in water or escaping to the air as gas, and goes unused.
Previous Year Questions
2026Explain the global supply chain for the fertilizer industry in India. How do international prices of key inputs affect domestic production?2023Discuss the significance of organic farming for sustainable agricultural development in India.2019Discuss the use of chemical fertilizers, pesticides and insecticides in agriculture and its impact on human health.





Thanks
Best website
THANK YOU SO MUCH SUCH A GREAT NOTES. Kash aisa hindi medium walo ke liye bhi hota.
I believe there is a typo in ECA year. It is written ECA 1953. I t should be Essential Commodities Act of 1955