

- Pollution is an undesirable change in the physical, chemical or biological characteristics of air, water or land that harms human health, living organisms, property or the processes of nature.
- India’s Environment (Protection) Act, 1986 calls an environmental pollutant any solid, liquid or gaseous substance present in a concentration that may be, or tends to be, injurious to the environment. Environmental pollution is simply the presence of such a pollutant.
- The test is harm, not mere presence. Every environment can dilute, disperse and break down some waste. Pollution begins where the input exceeds this assimilative capacity.
- Pollution is the most visible form of compositional degradation: the constituents of air, water and soil change, while environmental degradation also includes the structural loss of forests, land and species.
- Geographically, pollution is a problem of sources, pathways and receptors: where pollutants are released, how wind, water and food chains carry them, and who or what receives the dose. That makes it local (a drain), regional (the Indo-Gangetic smog) and global (persistent pesticides in Arctic seals) at once.
Pollution: Concepts and Classification

Pollutant, contaminant and the dose
- A contaminant is a substance present where it does not belong; it becomes a pollutant only when it causes harm.
- Concentration and exposure decide harm. Nitrogen and phosphorus are nutrients in a field but pollutants in a lake; ozone protects life in the stratosphere but injures lungs and crops at ground level.
- Threshold and non-threshold pollutants:
- most have a threshold below which no measurable harm occurs, the basis of air and water standards;
- carcinogens and fine particles show no safe threshold, which is why the WHO keeps lowering its guideline values.
Classification of pollutants
| Basis | Classes | Examples |
|---|---|---|
| Origin | Natural; anthropogenic | Volcanic SO₂, pollen; vehicle exhaust |
| Formation | Primary (emitted directly); secondary (formed in the environment) | SO₂, CO, soot; ozone, sulphate aerosol, PAN |
| Persistence | Biodegradable; slowly degradable; non-degradable | Sewage; DDT, plastics; lead, mercury |
| Source geometry | Point; line; area (non-point) | Chimney, outfall; highway; farm runoff, city dust |
| Medium | Air, water, soil, noise, thermal, radioactive |
- Eugene P. Odum grouped pollutants by how ecosystems handle them:
- biodegradable pollutants (domestic sewage, food waste) are broken down by decomposers, so the remedy is treatment and dilution;
- non-degradable pollutants (heavy metals, many synthetic organics) are not, so they accumulate, and the remedy is control at source.
- Point sources are easy to locate, license and monitor. Non-point sources are diffuse, weather-driven and the hardest to control.
Pollution at the global scale
- Many pollutants cross borders, so a local discharge becomes a regional or planetary problem:
- acid deposition downwind of industrial belts (Scandinavia from Britain and Central Europe in the 1970s);
- ozone-depleting substances and greenhouse gases, part of the global ecological changes of the Anthropocene;
- persistent organic pollutants and mercury, carried by air to the poles;
- plastics and nutrients reaching the oceans, as in marine pollution;
- winter haze spread over the whole Indo-Gangetic Plain and across national borders.
- Global measures therefore rest on treaties: Montreal (1987), Basel (1989), Rotterdam (1998), Stockholm (2001), Minamata (2013) and the climate regime, together with technology transfer, finance and national laws that tackle sources.
Air Pollution
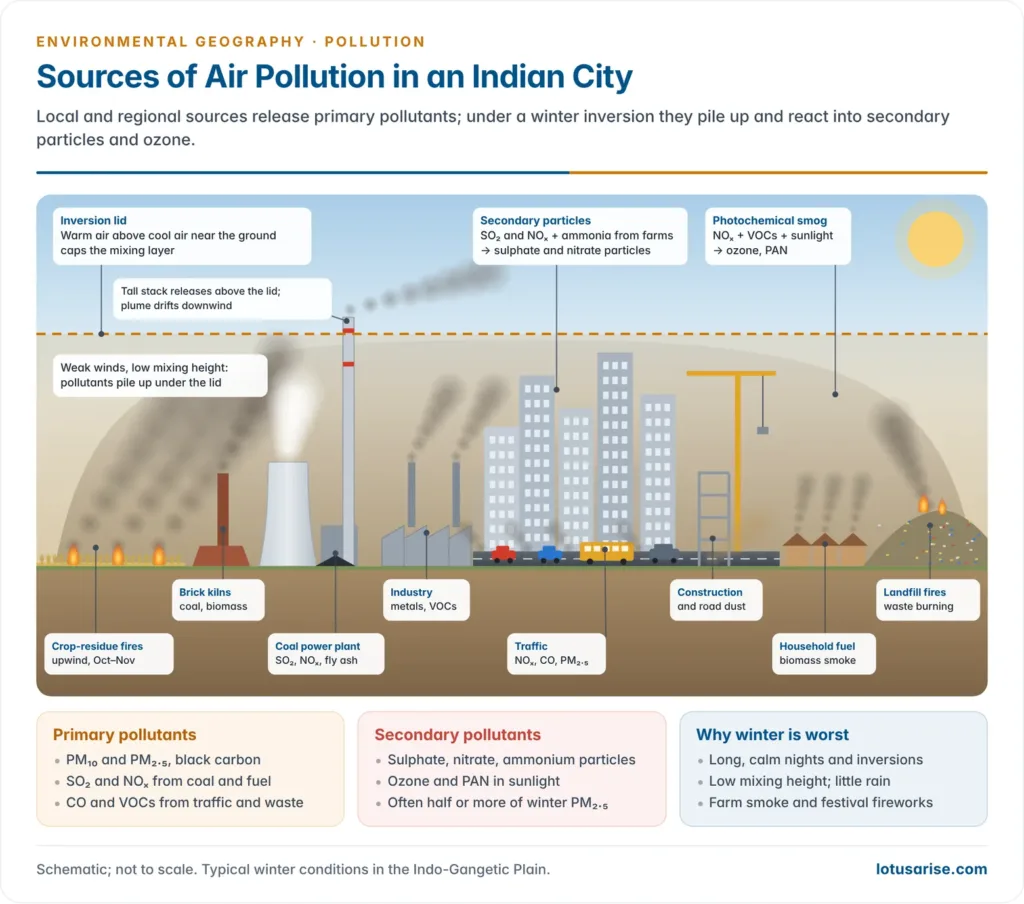
Sources
- Natural: volcanoes, dust storms, forest fires, sea spray, pollen, and methane from wetlands.
- Anthropogenic:
- Stationary sources: coal-fired power stations, smelters, refineries, cement, brick kilns;
- Mobile sources: vehicles, diesel generators, ships and aircraft;
- Area sources: road and construction dust, open waste burning, crop-residue fires, household fuels;
- Indoor sources: biomass and coal stoves, kerosene lamps, tobacco smoke, building materials.
- Household air pollution from solid cooking fuel remains a leading exposure in rural India; it falls hardest on women and children who spend hours beside the chulha.
Major air pollutants and their effects
| Pollutant | Main sources | Effects |
|---|---|---|
| PM₁₀ and PM₂.₅ | Combustion, dust, secondary aerosols | Penetrate lungs (PM₂.₅ reaches the blood); heart and lung disease, cancer; haze |
| Sulphur dioxide (SO₂) | Coal and oil burning, smelters | Respiratory irritation; acid rain; sulphate aerosol |
| Nitrogen oxides (NOₓ) | Vehicles, power plants | Lung damage; ozone and nitrate formation; acid rain |
| Carbon monoxide (CO) | Incomplete combustion | Binds haemoglobin; headache, death in closed rooms |
| Ground-level ozone (O₃) | Secondary: NOₓ + VOCs + sunlight | Lung inflammation; crop yield loss |
| Lead (Pb) | Formerly leaded petrol; smelters, batteries | Neurotoxic, especially to children |
| Ammonia (NH₃) | Fertiliser, livestock | Forms ammonium sulphate and nitrate particles |
| Benzene, benzo(a)pyrene | Fuel evaporation, incomplete combustion | Carcinogenic |
- Fine particles (PM₂.₅) carry the largest health burden. Air pollution was linked to about 7.9 million deaths worldwide in 2023, and to more than 2 million in India (State of Global Air, 2025).
- Secondary pollutants form in the air:
- SO₂ and NOₓ oxidise to sulphate and nitrate particles, which combine with ammonia from farms;
- nitrogen oxides and volatile organic compounds (VOCs) react in sunlight to form ozone, peroxyacetyl nitrate (PAN) and aldehydes.
- Hence a large share of a city’s PM₂.₅ is formed regionally and not emitted inside it.
Smog, acid deposition and the urban atmosphere
| Basis | Classical (London) smog | Photochemical (Los Angeles) smog |
|---|---|---|
| Ingredients | Smoke, SO₂, fog | NOₓ, VOCs, ozone, PAN |
| Conditions | Cold, damp, calm winter; inversion | Warm, sunny, still; inversion |
| Chemistry | Reducing | Oxidising |
| Classic case | London, December 1952 | Los Angeles basin, from the 1940s |
| Indian parallel | Delhi winter haze | Summer ozone peaks in large cities |
- The Great Smog of London (December 1952) killed about 4,000 people within days; later estimates are far higher. It led to Britain’s Clean Air Act of 1956.
- Temperature inversions decide whether pollutants disperse or pile up. A temperature inversion caps the mixing layer, so emissions accumulate in a shallow layer near the ground.
- Cities build their own pollution dome under the heat island, and a regional wind stretches it into an urban plume many kilometres downwind.
- Acid deposition:
- rain is naturally slightly acidic (about pH 5.6) from dissolved CO₂; rain below that is acid rain, from sulphuric and nitric acids;
- it reaches the ground as wet deposition (rain, snow, fog) or dry deposition (gases and particles);
- it acidifies lakes and forest soils, mobilises toxic aluminium and corrodes buildings; the marble of the Taj Mahal is protected by the Taj Trapezium Zone.
- Ozone depletion (from CFCs and halons) and global warming (from greenhouse gases) are air pollution at the planetary scale.
Air quality standards and the AQI
- India’s National Ambient Air Quality Standards (NAAQS), 2009 cover 12 pollutants. They are still the legal benchmark, and they are far looser than the WHO Air Quality Guidelines (2021).
| Pollutant | NAAQS annual | NAAQS 24-hour | WHO 2021 annual |
|---|---|---|---|
| PM₂.₅ (µg/m³) | 40 | 60 | 5 |
| PM₁₀ (µg/m³) | 60 | 100 | 15 |
| NO₂ (µg/m³) | 40 (30 in ecologically sensitive areas) | 80 | 10 |
| SO₂ (µg/m³) | 50 (20 in ecologically sensitive areas) | 80 | 40 (24-hour only) |
| O₃ (µg/m³) | 100 (8-hour) | 180 (1-hour) | 100 (8-hour) |
| CO (mg/m³) | 2 (8-hour) | 4 (1-hour) | |
| Lead (µg/m³) | 0.5 | 1.0 | |
| NH₃ (µg/m³) | 100 | 400 |
- The other four NAAQS parameters are annual limits for benzene (5 µg/m³), benzo(a)pyrene (1 ng/m³), arsenic (6 ng/m³) and nickel (20 ng/m³).
- The National Air Quality Index (AQI), launched in 2014, turns eight pollutants into one number and colour band:
| AQI | Category | Likely health impact |
|---|---|---|
| 0–50 | Good | Minimal |
| 51–100 | Satisfactory | Minor discomfort to sensitive people |
| 101–200 | Moderate | Discomfort to people with lung or heart disease |
| 201–300 | Poor | Discomfort to most on prolonged exposure |
| 301–400 | Very poor | Respiratory illness on prolonged exposure |
| 401–500 | Severe | Affects healthy people; serious for the ill |
Air pollution in India
- India is among the most polluted countries. In 2025 its average PM₂.₅ was 48.9 µg/m³, almost ten times the WHO guideline. Loni (Ghaziabad) was the world’s most polluted city, and New Delhi the most polluted capital for the eighth year running (IQAir, 2025).
- Urbanisation creates air pollution through:
- rising vehicle numbers and congestion;
- construction and road dust;
- industry and power plants on the urban fringe;
- open burning of garbage and landfill fires;
- the heat island and built-up canyons that trap emissions.
Why North Indian cities are more polluted than South Indian cities
| Factor | North India (Indo-Gangetic Plain) | South India (peninsula) |
|---|---|---|
| Location | Landlocked plain enclosed by the Himalaya; air stagnates | Narrow peninsula; sea breezes ventilate coastal cities |
| Winter weather | Cold, calm nights; strong inversions; mixing height falls to a few hundred metres | Warm; deeper mixing layer; little inversion |
| Winds | Weak north-westerlies carry farm smoke and Thar dust down the plain | Steady monsoon and trade winds disperse pollutants |
| Rain | Dry October–February; little washout | North-east monsoon rain over Tamil Nadu in winter |
| Emissions | Crop-residue fires, coal plants, brick kilns, dense traffic, biomass fuel | Fewer farm fires; cleaner fuel mix |
| Soil and dust | Fine alluvial and desert dust | Rocky, vegetated surfaces |
- Winter western disturbances bring calm, moist, foggy spells behind them. Fog droplets absorb gases and grow into secondary particles, which turns haze into smog.
- The contrast is meteorological as much as emission-driven. Bengaluru, Chennai and Hyderabad emit heavily too, but ventilation keeps their annual PM₂.₅ far lower.
Delhi NCR’s particulate problem
- Delhi’s winter AQI regularly enters the “severe” band in November, and PM₂.₅ stays above the NAAQS for most of the year.
- Why it persists:
- Geography and season: a landlocked basin with the Aravallis to the south-west, cold calm air, inversions and low mixing heights;
- Local sources: vehicles, road and construction dust, industry, diesel generators, waste burning and landfill fires (Ghazipur, Bhalswa, Okhla);
- Regional sources: power plants, brick kilns and industries across the NCR, and paddy-stubble smoke from Punjab and Haryana in October–November;
- Festive spikes: firecrackers around Diwali;
- Governance: a single airshed split across Delhi, Uttar Pradesh, Haryana and Rajasthan, weak enforcement, and measures that react to emergencies rather than run all year.
- Responses:
- the Commission for Air Quality Management in NCR and Adjoining Areas Act, 2021 gives one statutory body power over the whole airshed;
- the Graded Response Action Plan (GRAP) tightens curbs in four stages as the AQI rises from “poor” to “severe+”;
- cleaner fuels (CNG, piped gas), the Eastern and Western Peripheral Expressways that divert trucks, the metro and electric buses, and a ban on unapproved fuels in industry.
Crop residue burning and its management
- Combine harvesting leaves loose paddy stubble, and only two to three weeks separate the paddy harvest from wheat sowing. Burning is the cheapest way to clear the field.
- The smoke adds PM₂.₅, CO and black carbon, and destroys soil organic matter, nitrogen and soil microbes.
- Fire counts are falling: Punjab’s farm fires fell from about 71,300 in 2021 to 5,114 in 2025, and Haryana’s to 662 (CAQM). Yet Delhi’s winter air did not improve in proportion, which shows how much of the load is local.
- Management:
- In-situ: Happy Seeder and Super Seeder sowing into stubble, mulching, and the PUSA bio-decomposer that rots stubble in the field;
- Ex-situ: baling straw for biomass power, compressed biogas, co-firing pellets in thermal plants (now mandated), 2G ethanol, cardboard and fodder;
- Crop shift: diversifying away from water-hungry paddy, delayed transplanting under Punjab’s groundwater law (2009), and support prices for alternatives;
- Incentives: subsidised crop-residue machinery, custom hiring centres, and cash support per acre not burnt.
Control of air pollution
- At the source:
- cleaner fuels (LPG under Pradhan Mantri Ujjwala Yojana, CNG, electricity) and fuel switching in industry;
- Bharat Stage VI vehicle and fuel norms, adopted nationwide on 1 April 2020 by skipping BS-V;
- renewable power, efficient kilns (zig-zag brick kilns), and dust control on construction sites.
- End-of-pipe equipment:
| Device | Removes | Principle |
|---|---|---|
| Electrostatic precipitator | Fly ash, dust | Charged plates attract particles |
| Bag (fabric) filter | Fine dust | Filtration through cloth |
| Cyclone separator | Coarse particles | Centrifugal settling |
| Wet scrubber, flue-gas desulphurisation | SO₂, acid gases | Absorption in limestone slurry |
| Catalytic converter | CO, hydrocarbons, NOₓ | Oxidation and reduction on a catalyst |
- Planning: green belts, siting of industry downwind and outside inversion-prone valleys, and transport-oriented urban design.
- Law and programmes: the Air (Prevention and Control of Pollution) Act, 1981, the NAAQS, and the National Clean Air Programme (NCAP).
- NCAP, launched in January 2019, covers 131 non-attainment and million-plus cities. Its first target was a 20–30% cut in particulate levels by 2024 over 2017 levels.
- The target was revised to a 40% cut in PM₁₀, or meeting the national standard of 60 µg/m³, by 2025–26. City funds are tied to measured improvement.
- Results are uneven: of 100 cities with adequate data, 51 met the original target but only 23 the revised one, and most still exceed the PM₁₀ standard (2026 assessment). Dust control dominates spending, while industrial, vehicle and regional sources get less.
Water Pollution
Sources
- Domestic sewage: organic matter, nutrients, pathogens, detergents. It is the largest single source in India.
- Industrial effluents: heavy metals (chromium from tanneries, mercury from chlor-alkali plants), dyes, acids, oils, and organic chemicals from pulp, sugar, distillery and pharmaceutical units.
- Agricultural runoff: nitrate and phosphate from fertilisers, pesticides, and animal waste; a classic non-point source.
- Mining: acid mine drainage, metals and silt; the effects of mining and large dams extend far downstream.
- Thermal discharge from power plants, landfill leachate, and religious and cultural loads such as idol immersion.
Measuring water quality
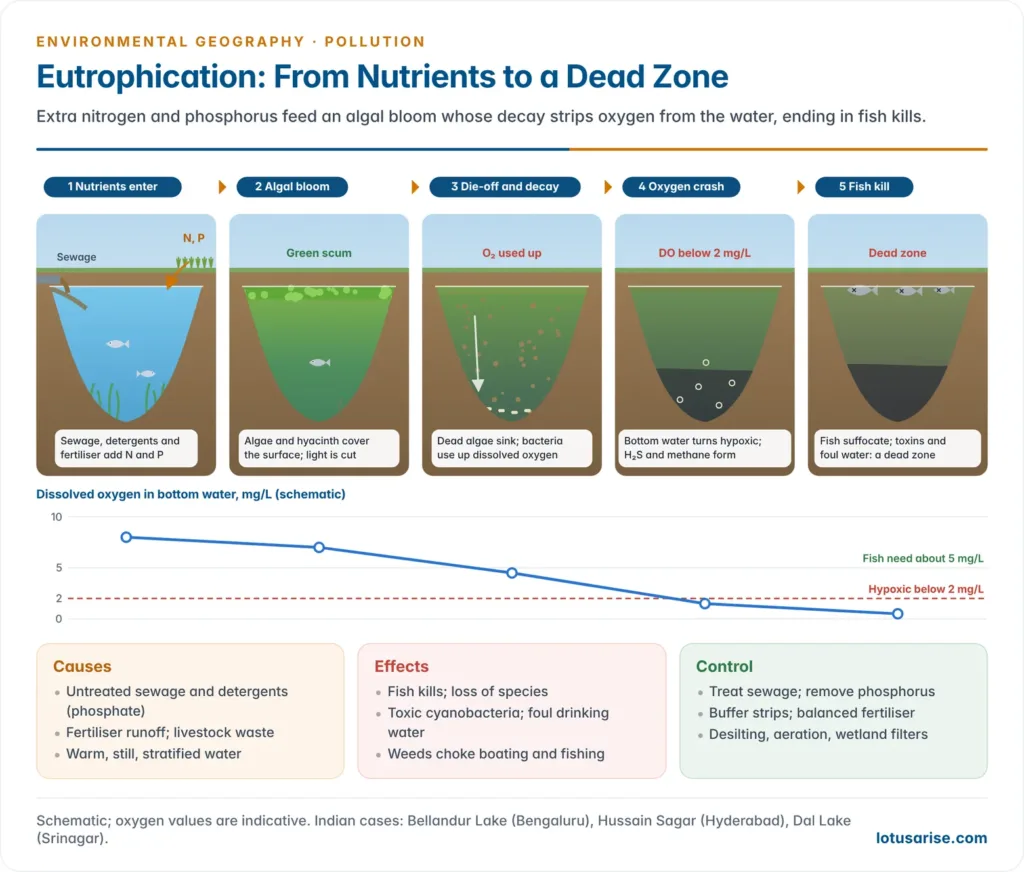
- Dissolved oxygen (DO): the oxygen available to aquatic life. Fish suffer below about 4–5 mg/L; water below 2 mg/L is hypoxic.
- Biochemical oxygen demand (BOD): the oxygen microbes need to decompose the organic matter in a sample. It is measured over five days at 20 °C, or three days at 27 °C in Indian practice.
- High BOD means heavy organic pollution. Untreated sewage runs to a few hundred mg/L, while clean river water stays below 3 mg/L.
- Chemical oxygen demand (COD): the oxygen needed to oxidise all organic matter chemically. It is always higher than BOD, and the COD:BOD ratio shows how much is non-biodegradable, typical of industrial waste.
- Faecal coliform: an indicator of sewage and pathogens.
- CPCB criteria for outdoor bathing: DO at least 5 mg/L, BOD at most 3 mg/L, faecal coliform below 2,500 MPN per 100 mL, and pH 6.5–8.5.
Eutrophication
- Eutrophication is the over-enrichment of a water body with nutrients, chiefly nitrogen and phosphorus, which drives excessive plant and algal growth.
- Natural eutrophication is the slow ageing of a lake over centuries as sediment and nutrients fill it.
- Cultural (anthropogenic) eutrophication compresses this into years through sewage, detergents and fertiliser runoff.
- The sequence:
- Nutrients enter from sewage and farms;
- Algal blooms and floating weeds (water hyacinth) cover the surface and shade out submerged plants;
- The bloom dies, and bacterial decomposition consumes dissolved oxygen;
- Bottom water becomes hypoxic or anoxic; hydrogen sulphide and methane form;
- Fish kills, loss of species and foul water follow. Some blooms (cyanobacteria) release toxins.
- Indian cases:
- Bellandur Lake, Bengaluru, frothed and caught fire repeatedly in 2015–2018 under untreated sewage and detergents;
- Hussain Sagar (Hyderabad), Dal Lake (Srinagar) and the Yamuna’s toxic foam at Kalindi Kunj every winter;
- nutrient loads also feed the coastal dead zones described under marine pollution.
Groundwater contamination
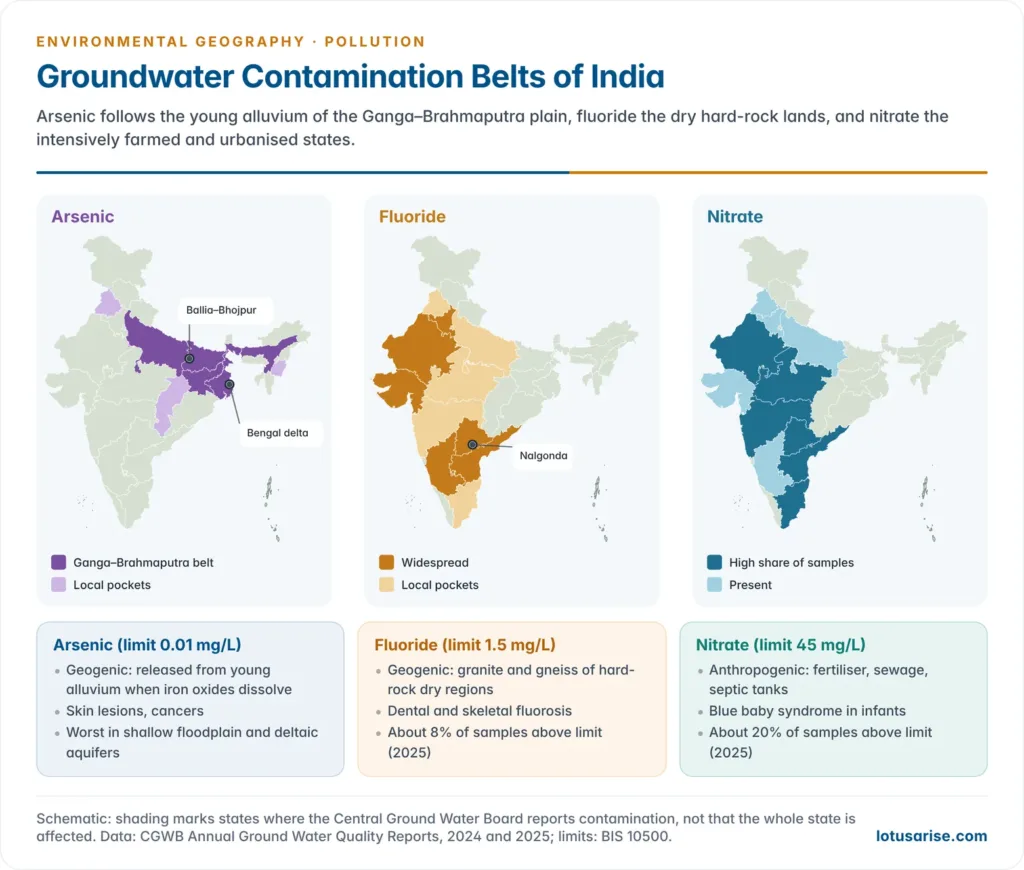
- Groundwater supplies most of India’s drinking water and irrigation, and it is polluted from two directions:
- geogenic contaminants dissolved from rocks and sediments: arsenic, fluoride, uranium, iron, salinity;
- anthropogenic contaminants leached from the surface: nitrate, pesticides, heavy metals and pathogens.
- Extent: in 2025, 28.3% of samples tested by the Central Ground Water Board exceeded at least one drinking-water limit.
| Contaminant | Share of samples above limit | Main belts | Health effect |
|---|---|---|---|
| Nitrate (above 45 mg/L) | About 20% | Rajasthan, Tamil Nadu, Maharashtra, Telangana, Andhra Pradesh, Madhya Pradesh, Punjab | Methaemoglobinaemia (“blue baby syndrome”) |
| Fluoride (above 1.5 mg/L) | About 8% | Rajasthan, Gujarat, Haryana, Telangana, Andhra Pradesh, Karnataka | Dental and skeletal fluorosis |
| Salinity (EC) | About 7% | Rajasthan, Delhi, Haryana, Gujarat | Unfit for drinking and irrigation |
| Uranium (above 30 ppb) | About 7–8% | Punjab, Haryana, Delhi, Rajasthan | Kidney damage |
| Arsenic (above 0.01 mg/L) | Patchy but severe | Ganga–Brahmaputra plain: West Bengal, Bihar, Uttar Pradesh, Jharkhand, Assam; parts of Punjab | Skin lesions, cancer |
- Arsenic is released from Holocene alluvium when iron oxides dissolve under reducing conditions, so it is worst in young deltaic and floodplain aquifers. It was first identified in West Bengal in the early 1980s.
- Fluoride comes from granite and gneiss and is concentrated by evaporation in semi-arid hard-rock areas. Nalgonda in Telangana is the classic fluorosis district.
- Nitrate marks intensive farming and sewage. Heavy urea use in the Green Revolution belt and septic tanks in cities both raise it.
- Urban groundwater is a fast-growing public-health problem:
- septic tanks, leaking sewers and unlined drains seep into shallow aquifers;
- landfill leachate carries metals and organics (Ghazipur in Delhi, Deonar in Mumbai);
- industrial units inject effluent into borewells to evade inspection;
- over-pumping draws in saline or deeper contaminated water, and coastal cities such as Chennai face seawater intrusion;
- the result: diarrhoeal disease, hepatitis, fluorosis, and higher costs for treatment and tanker water.
Water pollution in India
- The sewage gap: India generated about 72,368 million litres a day (MLD) of sewage against an installed treatment capacity of 31,841 MLD; only about 28% was actually treated (CPCB, 2021).
- Polluted river stretches: 296 stretches failed the bathing criteria in 2025, down from 311 in 2022. Maharashtra had the most (54). Priority I stretches carry BOD above 30 mg/L.
- Hotspots: the Yamuna below Delhi, the Ganga at Kanpur (tanneries), the Sabarmati below Ahmedabad, the Mithi in Mumbai, and the Musi in Hyderabad.
- Responses: the Water (Prevention and Control of Pollution) Act, 1974, which an amendment in 2024 shifted from jail terms to penalties for many offences; the Namami Gange programme (2014); and the AMRUT sewerage component in cities.
- Marine pollution has its own pathways and law. About 80% of it comes from land, through rivers, outfalls and the air, so cleaning rivers is the main step towards cleaner seas.
Control of water pollution
- Treat sewage in sewage treatment plants: primary (settling), secondary (biological: activated sludge, trickling filters), tertiary (nutrient removal, disinfection). Reuse the treated water for industry and parks.
- Industrial effluents: effluent treatment plants, common effluent treatment plants (CETPs) for small-unit clusters, and zero liquid discharge in water-hungry sectors such as textiles and distilleries.
- Low-cost options: waste-stabilisation ponds, constructed wetlands, and bioremediation of drains. The East Kolkata Wetlands, a Ramsar site, treat much of the city’s sewage through fisheries.
- Non-point control: balanced fertiliser use, buffer strips along streams, and integrated pest management.
- Groundwater: community arsenic and fluoride removal plants, a shift to safe surface sources (the Jal Jeevan Mission), recharge, and regulation of over-extraction.
Soil, Noise, Thermal and Radioactive Pollution
Soil pollution
- Soil pollution is a form of chemical land degradation: the build-up of toxic substances in soil to levels that harm organisms, crops and people through the food chain or groundwater.
- Sources: industrial effluents and sludge, mining waste, fly ash, municipal and electronic waste, pesticides and excess fertiliser, and irrigation with untreated sewage.
- Effects: loss of soil microbes and fertility, toxic metals in crops (cadmium in rice, lead in vegetables), groundwater contamination, and salinisation from poor-quality water.
- Areas vulnerable to soil pollution in India:
| Type of area | Examples | Main pollutants |
|---|---|---|
| Industrial clusters | Vapi and Ankleshwar (Gujarat), Patancheru (Telangana), Kanpur tanneries, Ratlam | Chromium, solvents, dyes |
| Mining belts | Sukinda chromite (Odisha), Jharia coalfield, Singrauli, Bellary | Hexavalent chromium, mercury, fly ash, acid drainage |
| Intensive farming belts | Punjab’s Malwa region, Haryana, western Uttar Pradesh | Pesticide residues, nitrate, cadmium from phosphate fertiliser |
| Peri-urban sewage-farmed land | Around Delhi, Kanpur, Hyderabad (Musi) | Pathogens, heavy metals |
| Waste and e-waste sites | Landfills of big cities; Seelampur (Delhi), Moradabad | Lead, cadmium, mercury, dioxins |
- The Central Pollution Control Board’s Comprehensive Environmental Pollution Index (2009) rated 43 of 88 industrial clusters critically polluted, most with combined air, water and land contamination.
- Remedies: treatment at source, secure landfills, phytoremediation (plants that take up metals), bioremediation, liming of acid sites, soil testing and balanced fertilisation.
Noise pollution
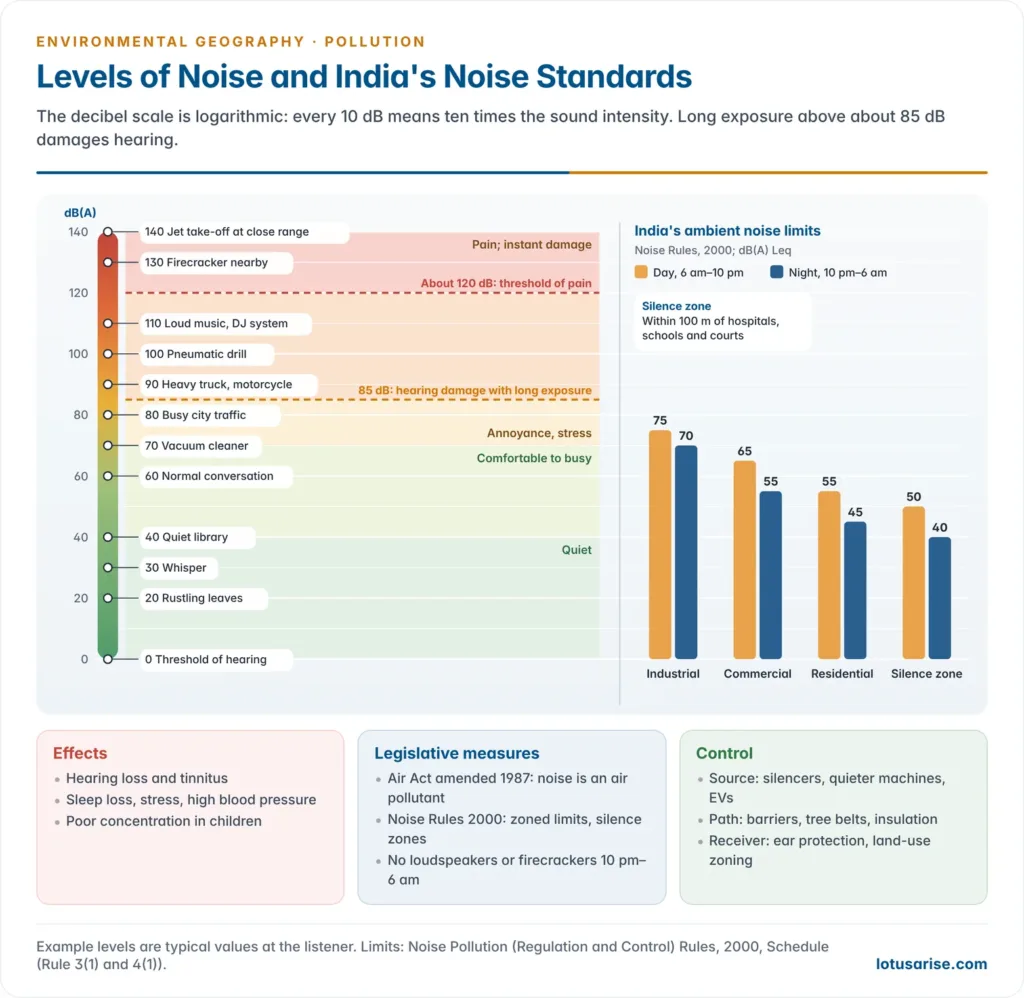
- Noise is unwanted or harmful sound. It is measured in decibels (dB), usually A-weighted, dB(A), to match the ear’s sensitivity.
- The scale is logarithmic: a rise of 10 dB is a tenfold rise in sound intensity and sounds roughly twice as loud.
- Standards use Leq, the equivalent continuous sound level averaged over a period.
- Levels of noise:
| Level dB(A) | Typical source | Effect |
|---|---|---|
| 0–30 | Threshold of hearing; rustling leaves, whisper | Quiet |
| 40–60 | Library, normal conversation | Comfortable |
| 70–85 | Busy traffic, vacuum cleaner, heavy truck | Annoyance; hearing risk with long exposure above 85 |
| 90–110 | Pneumatic drill, factory floor, loud music | Hearing damage within hours |
| 120–140 | Firecrackers at close range, jet take-off | Pain threshold; immediate damage |
- Effects:
- Auditory: temporary threshold shift, then permanent noise-induced hearing loss, and tinnitus;
- Non-auditory: disturbed sleep, stress, high blood pressure and heart disease, poor concentration and learning in children;
- Wildlife: masking of bird calls and of the acoustic signals whales use at sea.
- Ambient noise standards under the Noise Pollution (Regulation and Control) Rules, 2000:
| Area | Day (6 am–10 pm), dB(A) Leq | Night (10 pm–6 am), dB(A) Leq |
|---|---|---|
| Industrial | 75 | 70 |
| Commercial | 65 | 55 |
| Residential | 55 | 45 |
| Silence zone | 50 | 40 |
- Legislative measures:
- The Air (Prevention and Control of Pollution) Amendment Act, 1987 brought noise within the definition of an air pollutant.
- The Noise Rules, 2000, framed under the Environment (Protection) Act, 1986:
- make states classify industrial, commercial, residential and silence zones;
- declare silence zones within 100 m of hospitals, educational institutions and courts;
- ban loudspeakers and public-address systems at night, except in closed premises; states may relax this until midnight on a limited number of festive days a year.
- Firecrackers have noise limits at source under the Environment (Protection) Rules, and the Supreme Court (2005) barred bursting them between 10 pm and 6 am.
- The Motor Vehicles Act and rules limit horn and engine noise, and factory law limits exposure at the workplace.
- Control: reduce noise at source (silencers, quieter machines, electric vehicles), block its path (noise barriers, tree belts, insulation), protect receivers (ear protection), and plan land use by keeping hospitals and schools away from highways and airports.
Thermal pollution
- Thermal pollution is the raising of water temperature by heated discharge, mainly cooling water from thermal and nuclear power plants and industries.
- Effects:
- warm water holds less dissolved oxygen while raising the metabolic demand of fish;
- it alters spawning and migration, favours heat-tolerant algae, and causes thermal shock when plants start or stop;
- near coastal outfalls it adds to coral and seagrass stress.
- Control: cooling towers and cooling ponds, reuse of waste heat (cogeneration), and discharge standards for temperature rise.
Radioactive pollution
- Radioactive pollution is the release of ionising radiation from radionuclides.
- Natural sources: cosmic rays, radon gas, and radioactive minerals such as the monazite sands of the Kerala coast, where Karunagappally has high background radiation.
- Human sources: nuclear weapons testing, the nuclear fuel cycle (uranium mining, reactors, reprocessing), medical and industrial isotopes.
- Effects: cell and DNA damage, cancers (thyroid cancer from iodine-131, bone cancer from strontium-90), genetic effects, and long-term contamination of land.
- Accidents: Chernobyl (Ukraine, 26 April 1986) left an exclusion zone of about 30 km; Fukushima Daiichi (Japan, 11 March 2011) followed an earthquake and tsunami.
- Control: reactor safety and regulation (the Atomic Energy Regulatory Board in India), deep geological storage of high-level waste, and monitoring of mining areas such as Jaduguda in Jharkhand.
Persistent Toxins and Wastes
Chlorinated hydrocarbons and persistent organic pollutants
- Chlorinated hydrocarbons (CHCs) are synthetic organic compounds of carbon, hydrogen and chlorine. They include the organochlorine insecticides DDT, aldrin, dieldrin, endrin, chlordane, heptachlor, endosulfan and lindane (BHC), and industrial chemicals such as PCBs and the by-products dioxins and furans.
- Characteristics that make them a serious threat to ecosystems:
- Persistence: the carbon–chlorine bond resists breakdown by sunlight, water and microbes, so DDT lasts for years to decades in soil and sediment;
- Fat solubility, low water solubility: they leave water for the fatty tissues of organisms and are excreted very slowly;
- Bioaccumulation: the concentration in an organism rises over its lifetime as intake exceeds loss;
- Biomagnification: the concentration multiplies at each trophic level, so top predators and humans receive the highest doses;
- Broad-spectrum toxicity: they kill non-target insects, pollinators, fish and the natural enemies of pests, and pests evolve resistance;
- Long-range transport: they evaporate in warm regions and condense in cold ones (the “grasshopper effect”), so they reach the Arctic and the Himalaya far from any use;
- Endocrine disruption: they mimic hormones, causing reproductive failure, birth defects and cancers;
- Synergy: mixtures act together, and residues in milk, eggs and human breast milk persist across generations.
- Classic evidence:
- Rachel Carson’s Silent Spring (1962) documented the death of birds and fish from DDT spraying and launched the modern environmental movement;
- DDE, a breakdown product of DDT, interferes with calcium deposition, causing eggshell thinning and the collapse of peregrine falcon, bald eagle, osprey and brown pelican populations;
- Endosulfan in Kasaragod, Kerala: aerial spraying of cashew plantations for over two decades was linked to birth defects and chronic illness in surrounding villages. The Supreme Court imposed a ban in 2011, the year endosulfan was listed under the Stockholm Convention.
Bioaccumulation and biomagnification
- Bioaccumulation is the build-up of a pollutant within one organism, from water and food, faster than the body can remove it.
- Biomagnification (biological magnification) is the increase in concentration from one trophic level to the next along a food chain, because each consumer eats many prey and stores the pollutant in its fat. Since most energy is lost between trophic levels, each level must eat many times its own mass, and the residue stays behind.
- The classic case: in a Long Island estuary, George M. Woodwell, Charles F. Wurster and Peter A. Isaacson (1967) found DDT at about 0.04 ppm in plankton, a few tenths to about 2 ppm in fish, and 3–25 ppm in fish-eating birds, with up to 75 ppm in a ring-billed gull. Over the chain the concentration rises millions of times above that in the water.
- Heavy metals biomagnify too:
- mercury, converted to methylmercury by bacteria, caused Minamata disease in Japan (identified 1956);
- cadmium from mining waste in the Jinzu river basin caused itai-itai disease.
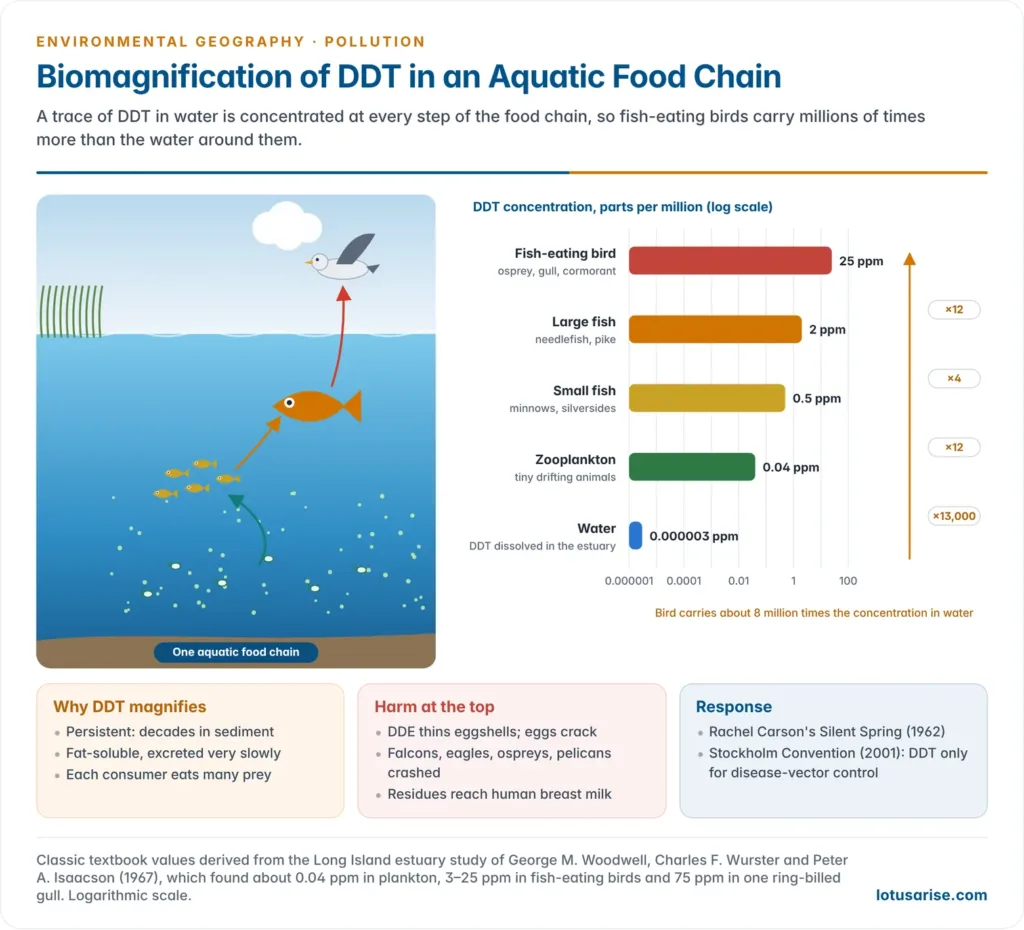
- The Stockholm Convention on Persistent Organic Pollutants (adopted 2001, in force 2004) targets these chemicals:
- it began with the “dirty dozen”: eight pesticides (aldrin, chlordane, DDT, dieldrin, endrin, heptachlor, mirex, toxaphene), two industrial chemicals (PCBs, hexachlorobenzene) and two by-products (dioxins, furans);
- Annex A lists chemicals for elimination, Annex B for restriction, and Annex C for unintentional releases;
- 37 chemicals are now listed, the latest being chlorpyrifos, medium-chain chlorinated paraffins and long-chain perfluorocarboxylic acids (2025);
- DDT is still allowed for disease-vector control, which matters to India, a producer and user for malaria control;
- India ratified it in 2006, choosing that new listings do not bind it until it ratifies each one.
- Three sister treaties govern hazardous wastes and chemicals: Basel (transboundary waste), Rotterdam (prior informed consent in trade) and Minamata (mercury).
Solid waste
- Municipal solid waste (MSW) is the everyday waste of homes, markets, offices and streets. India generates about 1.85 lakh tonnes a day (CPCB, 2023–24).
- About half is wet, biodegradable organic matter; the rest is paper, plastic, glass, metal, textiles and inert dust.
- Environmental challenges in metropolitan regions:
- Legacy landfills that rise like hills: Ghazipur, Bhalswa and Okhla in Delhi; Deonar in Mumbai; Perungudi in Chennai;
- methane emissions and spontaneous landfill fires that add to winter smog;
- leachate that contaminates groundwater and soil;
- open burning of waste, clogged drains that worsen urban floods, and plastics that reach rivers and the sea;
- land scarcity for new sites, and the health risks borne by an informal workforce of waste pickers;
- weak segregation, which spoils the organic fraction for compost and the dry fraction for recycling.
- The waste stream swells with rising incomes, packaging and “use and throw” consumption.
- Rules:
- the Solid Waste Management Rules, 2016 extended rules beyond municipalities to census towns, villages and bulk generators, and made segregation at source mandatory;
- the Solid Waste Management Rules, 2026, in force from 1 April 2026, replace them:
- mandatory four-stream segregation: wet, dry, sanitary and special-care waste;
- bulk waste generators (20,000 m² of floor area, 40,000 litres of water a day, or 100 kg of waste a day) must process wet waste on site or buy Extended Bulk Waste Generator Responsibility certificates;
- landfills only for non-recyclable and inert residue, with higher fees for unsegregated waste;
- time-bound biomining of legacy dumpsites;
- the Environment (Construction and Demolition) Waste Management Rules, 2025 also apply from April 2026.
- Efforts: the Swachh Bharat Mission (Urban) 2.0 (2021) aims at garbage-free cities; materials recovery facilities, composting, biomethanation and waste-to-energy are spreading. Indore, with strict segregation and wet-waste biogas, is the model city.
Plastic waste
- India generated about 4.13 million tonnes of plastic waste in 2022–23. Much of it is single-use packaging, which is light, cheap and hard to collect.
- Problems: clogged drains and urban flooding, cattle deaths, toxic smoke when burnt, microplastics in soil and water, and marine litter.
- Plastic Waste Management Rules, 2016 and their amendments:
- minimum carry-bag thickness raised to 75 microns (September 2021) and 120 microns (December 2022);
- a ban on identified single-use plastic items from 1 July 2022;
- extended producer responsibility (EPR) guidelines (2022), with collection, recycling and recycled-content targets tracked on a central portal;
- the 2026 amendment sets recycled-content targets by category (rigid packaging from 30% in 2025–26 to 60% by 2028–29) and allows shortfalls to be carried forward. Critics say it weakens enforcement where fake EPR certificates are already a problem.
E-waste
- E-waste is discarded electrical and electronic equipment: phones, computers, appliances, solar panels and batteries.
- It contains lead, mercury, cadmium, brominated flame retardants, and valuable metals such as gold, copper and rare earths.
- Scale: India generated about 1.75 million tonnes in 2023–24, up about 73% in five years; about 43% was recycled through formal channels. The world generated about 62 million tonnes in 2022, and only 22.3% was documented as recycled (Global E-waste Monitor, 2024).
- The informal sector dismantles most of it by acid baths and open burning, in clusters such as Seelampur (Delhi) and Moradabad (Uttar Pradesh), poisoning workers, soil and water.
- E-Waste (Management) Rules, 2022 (in force 1 April 2023) put the burden on producers through EPR targets met by registered recyclers. They cover 106 equipment items and bring in solar panels and cells.
Hazardous and industrial waste
- Industrial waste is diverse: fly ash from coal power, slag from steel plants, red mud from alumina refineries, phosphogypsum from fertiliser plants, sludge, spent chemicals and hazardous residues.
- Hazardous waste is toxic, corrosive, flammable, reactive or infectious, and is governed by the Hazardous and Other Wastes Rules, 2016, the Bio-Medical Waste Management Rules, 2016 and the Battery Waste Management Rules, 2022.
- Potentials:
- fly ash in cement, bricks, road embankments and mine filling, with power plants obliged to utilise it fully;
- slag in cement and roads; red mud as a source of iron and rare earths; phosphogypsum for soil reclamation;
- industrial symbiosis, where one firm’s waste is another’s raw material, as in Kalundborg (Denmark), and a circular economy supported by EPR.
- Challenges: huge volumes and low value, toxic content, illegal dumping, too few treatment, storage and disposal facilities, a weak informal recycling chain, and accidents. The Bhopal gas tragedy (December 1984, methyl isocyanate) remains the worst industrial disaster.
Controlling Pollution
The pollution control hierarchy
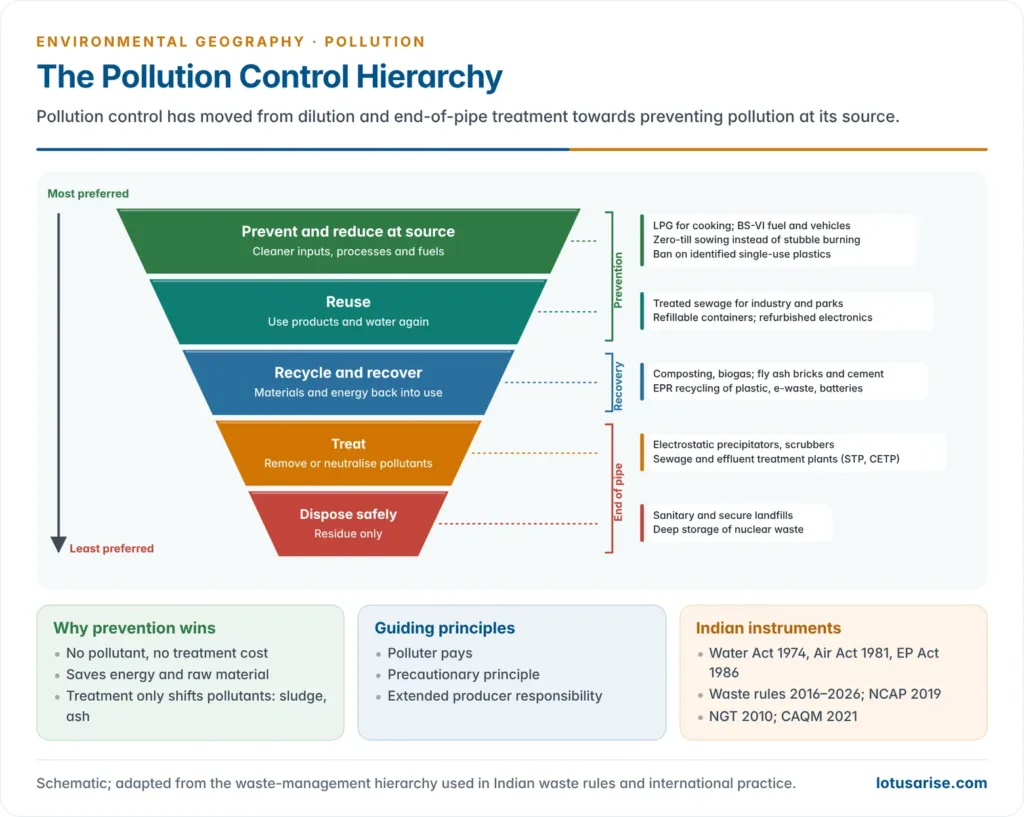
- Pollution control has moved from dilution (“the solution to pollution is dilution”) to end-of-pipe treatment, and now to prevention at source.
- The hierarchy, from most to least preferred:
- Prevent and reduce at source: cleaner production, process change, substitution of toxic inputs, efficiency;
- Reuse products and materials;
- Recycle and recover materials and energy;
- Treat emissions and effluents to remove or neutralise pollutants;
- Dispose of the residue safely: secure landfill, controlled release.
- Why prevention wins: treatment shifts pollutants from one medium to another (scrubber sludge, incinerator ash), while prevention removes them.
Principles and instruments
- Polluter pays: the polluter bears the cost of prevention and of restoring damage, a principle Indian courts have enforced since the 1990s.
- Precautionary principle: lack of full scientific certainty is no reason to delay action against serious harm.
- Indian environmental policy mixes three kinds of instruments:
- command and control: emission and effluent standards, consent to establish and operate, closure orders;
- market-based: pollution taxes, cess, emissions trading (Surat’s particulate trading scheme, 2019), and EPR certificates;
- information: the AQI, continuous emission monitoring, public disclosure and ratings.
The Indian framework
- India’s environmental legislation rests on three framework Acts and a growing set of rules:
| Instrument | Year | Scope |
|---|---|---|
| Water (Prevention and Control of Pollution) Act | 1974 (amended 1988, 2024) | Pollution control boards; consent for discharge |
| Air (Prevention and Control of Pollution) Act | 1981 (amended 1987) | Air quality, emission standards; noise added in 1987 |
| Environment (Protection) Act | 1986 | Umbrella law; standards and rules for all media |
| Noise Pollution (Regulation and Control) Rules | 2000 | Zoned noise standards |
| National Green Tribunal Act | 2010 | Specialised environmental court |
| Waste rules (solid, plastic, e-waste, hazardous, bio-medical, battery, C&D) | 2016–2026 | Segregation, EPR, safe disposal |
| Commission for Air Quality Management Act | 2021 | One airshed authority for NCR |
| National Clean Air Programme | 2019 | City action plans for particulates |
Critical evaluation and way forward
- Weak enforcement: pollution control boards are short of staff and money, and the 2023 decriminalisation of the Air Act and the Environment (Protection) Act relies on penalties that must actually be collected.
- Standards lag science: the NAAQS date from 2009 and are several times looser than the WHO guidelines.
- Airsheds and river basins cross state lines, while action is city- or state-wise. Regional sources such as stubble smoke and power plants need regional management.
- Data gaps: sparse monitoring in small towns and villages, and self-reported compliance in EPR systems.
- Way forward:
- airshed and basin-level planning, and enforcement of existing standards;
- full sewage treatment and reuse, with nutrient control;
- clean energy and electric mobility, and a circular economy for plastics, e-waste and industrial waste;
- revision of standards towards WHO targets, wider monitoring, and public participation.
Previous Year Questions
2024Industrial waste is diversified. Discuss the potentials and challenges associated with it.2023Examine the environmental challenges caused by the solid waste in metropolitan regions of India and discuss the efforts to overcome it.2022Why has extreme particulate pollution remained a festering issue in Delhi NCR region?2022Groundwater contamination in the fast expanding urban landscape of India appears to have become a major public health issue. Discuss.2020Discuss the methods of crop residue management in rural India to reduce pollution.2019Give a reasoned account of high level of pollution in North Indian cities as compared to South Indian cities.2017What do you understand by soil pollution? Delineate the areas vulnerable to it in India and suggest remedial measures.2013What are the characteristics that make CHC a serious threat to the ecosystem? Give examples.2013Explain the levels of Noise pollution and the legislative measures to control it.2013“Urban Solid Waste Management poses the greatest challenge in Metropolitan Planning”. Elaborate.2013Describe how urbanization creates air and water pollution in India.2005Bring out the major problems of environmental pollution at global scale and suggest measures to check it.2003Write short note: Environmental pollution.




