

- An environmental hazard is a process, phenomenon, substance or human activity that may cause loss of life, injury, property damage, social and economic disruption or environmental degradation. Storms, earthquakes, floods, toxic leaks and pollution all qualify.
- In geography, hazards are understood as extreme events, natural or anthropogenic, that exceed the tolerable magnitude of a place within or beyond certain time limits, make adjustment difficult and cause catastrophic losses of property, income and lives.
- A hazard lies at the interface of nature and society. An earthquake in an empty desert is a geophysical event; the same shaking under a crowded city of weak buildings is a disaster.
- Environmental geography therefore studies how people perceive, adjust to and manage the extremes of the physical environment.
- The global scale: between 2000 and 2019 about 7,348 recorded disasters killed 1.23 million people, affected 4.2 billion and caused about US$2.97 trillion in economic losses. That is far more events and losses than in 1980–1999, driven mainly by climate-related disasters.
- Societies that depend on energy, chemicals, transport and communication networks suffer cascading losses when these fail, so building resilience is now a first-order priority of planning.
Hazards, Disasters and Risk: Core Concepts

Hazard and disaster
| Dimension | Hazard | Disaster |
|---|---|---|
| Nature | A process, agent or condition with the potential to cause harm | The actual occurrence: a serious disruption of a community’s functioning, with losses beyond its coping capacity |
| Timing | A standing threat that may or may not materialise | Happens when the hazard strikes exposed, vulnerable people |
| Relationship | The cause (the trigger) | The effect (the outcome) |
| Example | An active fault running beneath a city | The earthquake that collapses its buildings and kills people |
- A disaster is a hazard that has met vulnerability. The hazard is the trigger; the disaster is the social outcome, measured in deaths, losses and disruption.
- Disasters are classed by scale: a disaster that a district or state can handle with its own resources is local; one that needs national or international help is catastrophic.
Exposure, vulnerability, capacity and resilience
- Exposure: the people, buildings, crops, infrastructure and ecosystems located in hazard-prone areas. A floodplain city has high exposure even in a dry year.
- Vulnerability: the conditions that make people and assets susceptible to harm.
- Physical: weak buildings, settlement on unstable slopes or low ground. Social: poverty, illiteracy, gender, age, disability and exclusion.
- Economic: dependence on one crop or daily wages, no savings or insurance. Environmental: degraded catchments, lost mangroves and wetlands.
- Capacity (coping capacity): the strengths and resources a community can use to reduce risk and recover: knowledge, warning systems, shelters, savings, social networks and institutions.
- Resilience: the ability of a system exposed to a hazard to resist, absorb, accommodate, adapt to, transform and recover from its effects in a timely and efficient manner, including by preserving its essential structures and functions.
The risk equation
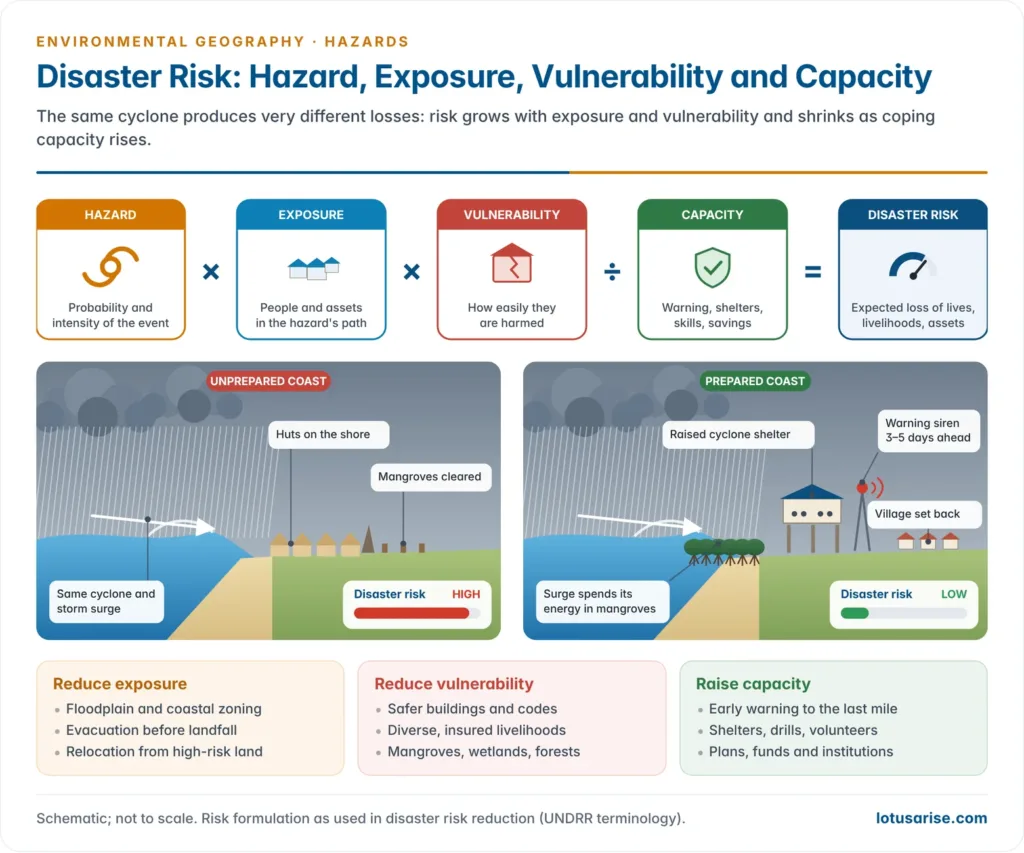
- Disaster risk = Hazard × Exposure × Vulnerability ÷ Capacity.
- Hazard: the probability and intensity of the event.
- Exposure: how many people and assets lie in its path.
- Vulnerability: how easily they are harmed.
- Capacity: how far preparedness and resources offset the other three.
- Severity of impact thus depends on the hazard itself (intensity, duration, extent), on exposure and on vulnerability set against capacity. If any factor is near zero, risk falls sharply: an intense cyclone over an evacuated coast produces little loss.
- Addressing all the factors at once is the foundation of modern disaster risk reduction (DRR). The hazard itself can rarely be changed, so most effort goes into reducing exposure (land-use zoning), reducing vulnerability (safer buildings, livelihoods) and raising capacity (warning, training).
How geographers have viewed hazards
- The engineering view (to the 1960s): hazards were “acts of God”, to be met by technical control of nature: dams, embankments and sea walls.
- The behavioural view: Gilbert F. White, in Human Adjustment to Floods (1945), argued that “floods are acts of God, but flood losses are largely acts of man“.
- Embankments encourage more building behind them, so losses rise: the levee effect.
- Ian Burton, Robert W. Kates and Gilbert F. White (The Environment as Hazard, 1978) showed that responses depend on hazard perception. People bear the loss, share it (relief, insurance), modify the event, reduce vulnerability, or change land use and move.
- The structural view: Kenneth Hewitt (Interpretations of Calamity, 1983) traced disasters to the everyday conditions of marginalisation, not to rare extremes.
- The Pressure and Release (PAR) model of Piers Blaikie, Terry Cannon, Ian Davis and Ben Wisner (At Risk, 1994) runs from root causes (unequal power and resources) through dynamic pressures (rapid urbanisation, degradation) to unsafe conditions (fragile housing on hazardous land). A disaster occurs where these meet a hazard.
- Amartya Sen (Poverty and Famines, 1981) showed that famines follow a collapse of entitlements, people’s ability to command food, even when food is available.
- The current synthesis is disaster risk reduction: hazards may be natural, but disasters are not. They are produced by exposure and vulnerability that development creates, and they can be reduced. The ideas belong to the wider man–environment relationship.
Classification of Hazards and India’s Hazard Profile
Classification of environmental hazards
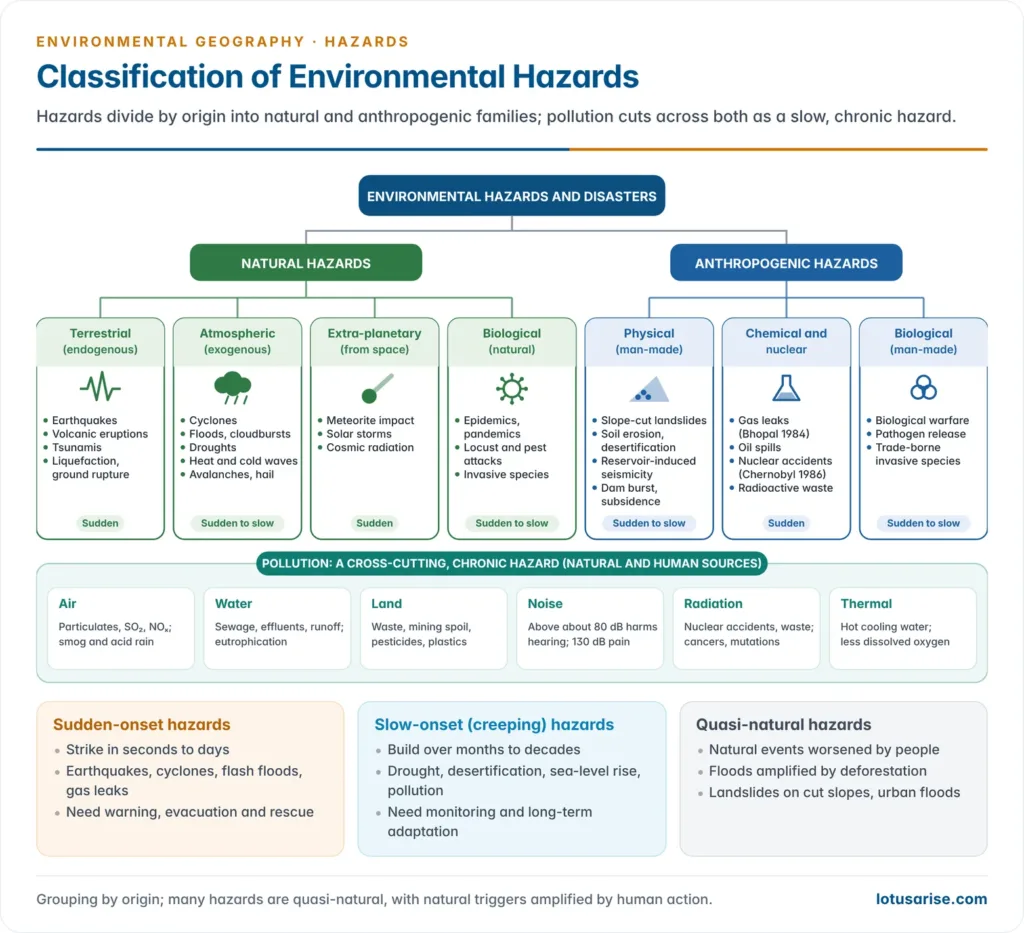
- By origin, hazards are natural or anthropogenic (man-made). Many are quasi-natural: natural events made worse by human action, such as floods amplified by deforestation.
- Natural hazards divide into planetary and extra-planetary hazards.
- Planetary hazards are either terrestrial (endogenous), driven by internal earth forces: earthquakes, volcanic eruptions and tsunamis; or atmospheric (exogenous), driven by weather and the ocean–atmosphere system: cyclones, floods, droughts, heat and cold waves, hailstorms and avalanches.
- Extra-planetary hazards come from space: meteorite impacts, solar storms and cosmic radiation.
- Biological hazards are epidemics, pandemics, pest and locust attacks, and invasive species.
- Anthropogenic hazards are of three kinds.
- Physical: landslides on cut slopes, accelerated soil erosion, reservoir-induced seismicity, dam bursts and land subsidence from groundwater over-extraction and mining.
- Chemical and nuclear: industrial gas leaks, explosions, oil spills, radioactive leaks and nuclear accidents.
- Biological: biological warfare, release of pathogens, and invasive species introduced by trade.
- Pollution is cross-cutting: a chronic, slow-acting hazard with both natural and human sources (air, water, land, noise, radiation and thermal).
- By speed of onset:
- Sudden-onset (rapid) hazards strike in seconds to days: earthquakes, flash floods, cyclones, landslides, gas leaks.
- Slow-onset (creeping) hazards build over months to decades: drought, desertification, sea-level rise, pollution, soil salinisation.
- The UN Office for Disaster Risk Reduction (UNDRR) and the International Science Council now catalogue 282 hazards in eight types (2025 update): meteorological and hydrological, extraterrestrial, geohazards, environmental, chemical, biological, technological and societal.
| Group | Driver | Examples | Onset |
|---|---|---|---|
| Geophysical (endogenous) | Plate movement, magma | Earthquake, volcano, tsunami | Sudden |
| Hydro-meteorological (exogenous) | Atmosphere and ocean | Cyclone, flood, drought, heat wave, cold wave, cloudburst | Sudden to slow |
| Extra-planetary | Space | Meteorite, solar storm | Sudden |
| Biological | Pathogens and pests | Epidemic, pandemic, locusts | Sudden to slow |
| Anthropogenic physical | Land and water modification | Slope-cut landslides, dam burst, subsidence, erosion | Sudden to slow |
| Chemical and nuclear | Industry and energy | Bhopal gas leak, Chernobyl, oil spills | Sudden |
| Pollution | Waste and emissions | Air, water, soil, noise, radiation, thermal | Slow (chronic) |
Pollution as a chronic hazard
- Environmental pollution is any discharge of material or energy into water, land or air that causes acute or chronic detriment to ecological balance or lowers the quality of life. It may do primary damage, direct and visible, or secondary damage, slow disturbances of the food web.
- Six forms are recognised, each treated under environmental pollution:
- Air and water: smog, acid rain and respiratory disease; sewage, effluents, eutrophication and biomagnification, as in Minamata disease (mercury, Japan, identified 1956).
- Land: industrial and urban waste, mining spoil, pesticides and plastics.
- Noise: sustained exposure above about 80 dB harms hearing; 130–140 dB is the threshold of pain.
- Radiation: cancers, mutations and birth defects from nuclear accidents, waste and medical sources.
- Thermal: hot cooling water from power plants lowers dissolved oxygen and kills or displaces fish.
- Pollution episodes such as the winter smog of north Indian cities behave like slow disasters: continuous, cumulative and hardest on the poor and the young.
India’s vulnerability to hazards
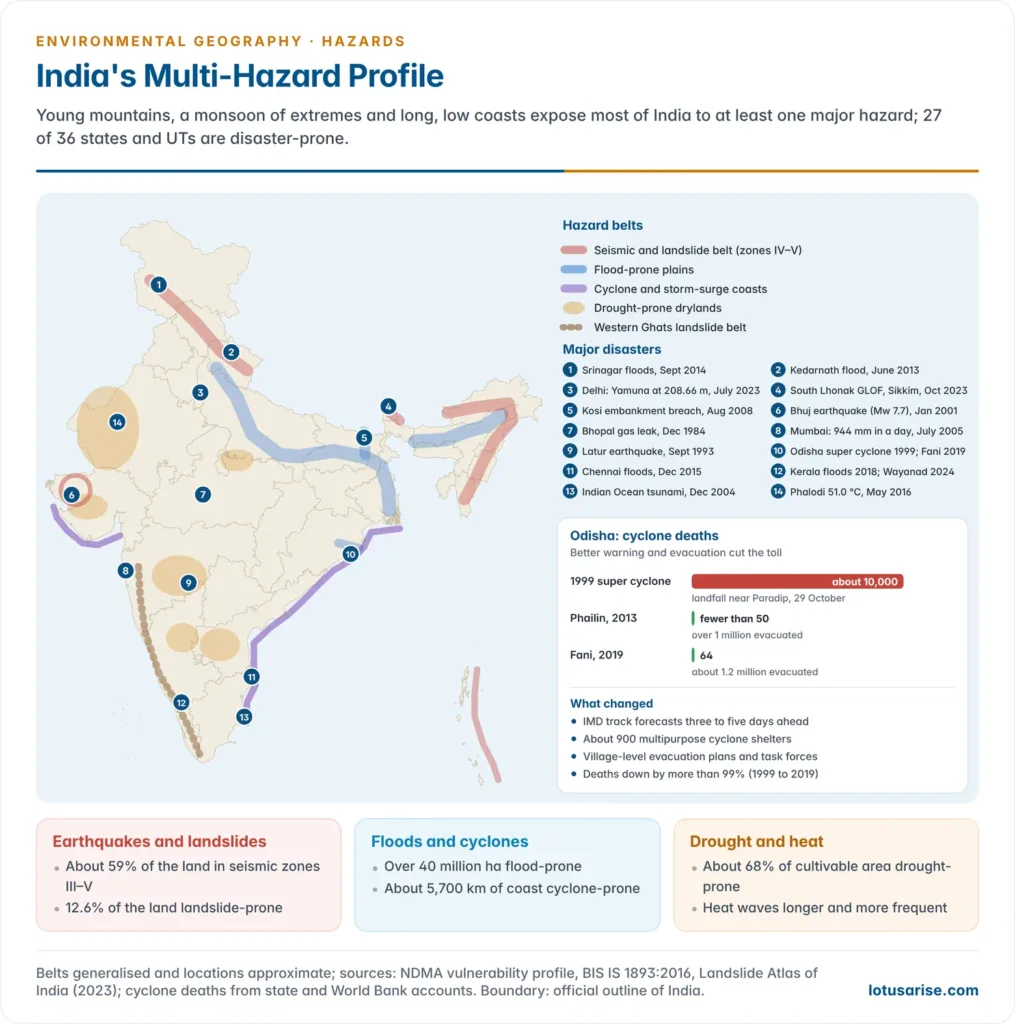
- India is among the most disaster-prone countries in the world because of its geo-climatic, geomorphological and socio-economic conditions: a young, rising Himalaya, a monsoon climate of extremes, long low coasts on warm seas, and a large, dense, often poor population.
- 27 of its 36 states and union territories are disaster-prone.
- Risks are compounded by unplanned urbanisation, environmental degradation, a rising population in hazard zones and climate change, which is making heat waves, extreme rain and intense cyclones more frequent.
| Hazard | India’s exposure | Most vulnerable regions |
|---|---|---|
| Earthquakes | About 58.6% of the landmass prone to moderate to very high intensity; about 59% in seismic zones III–V | Himalayan arc, north-east, Kachchh, Andaman and Nicobar, Delhi–NCR |
| Floods | Over 40 million ha (about 12% of the land) flood-prone; about 7.5 million ha affected a year on average | Brahmaputra and Ganga plains (Assam, Bihar, Uttar Pradesh, West Bengal); east-coast deltas; cities |
| Cyclones and tsunamis | About 5,700 km of the coast (on the older 7,516-km reckoning) | Odisha, Andhra Pradesh, West Bengal, Tamil Nadu; Gujarat on the Arabian Sea |
| Droughts | About 68% of the cultivable area drought-prone | Thar (Rajasthan, Gujarat), Bundelkhand, Marathwada and Vidarbha, Rayalaseema, interior Karnataka |
| Landslides | About 12.6% of the land (excluding snow) prone | Himalaya, north-east, Western Ghats (Kerala, Karnataka, Konkan) |
| Industrial and chemical | Hazardous units clustered in industrial belts | Mumbai–Pune, Ahmedabad–Vadodara–Surat, Chennai, Delhi–NCR, Visakhapatnam, Dhanbad–Jamshedpur |
| Heat waves | Rising frequency and length with warming | Rajasthan, Gujarat, Madhya Pradesh, Uttar Pradesh, Odisha, Telangana, Andhra Pradesh |
- The coastline was re-measured in 2024 at about 11,098 km with finer mapping, so older percentages of the “vulnerable coast” are best read as an order of magnitude.
Major Natural Hazards and Their Management
Earthquakes
- An earthquake is a sudden movement of the ground surface, from a faint tremor to a violent motion that shakes buildings apart and opens fissures in the ground.
- It results from the abrupt release of slowly accumulated strain. Energy spreads as seismic waves in widening circles from the point of release, the focus (hypocentre); the point vertically above it on the surface is the epicentre.
Measuring earthquakes: magnitude and intensity
- Magnitude measures the energy released at the source: one number per earthquake.
- Charles F. Richter devised the local magnitude scale in 1935. It is logarithmic: each whole-number step means a ten-fold increase in recorded wave amplitude and about 32 times more energy. It has no fixed upper limit.
- For large earthquakes the Richter scale saturates. Seismologists now use the moment magnitude scale (Mw) of Thomas C. Hanks and Hiroo Kanamori (1979), based on fault area, slip and rock rigidity.
- Intensity measures the effects of shaking at a particular place: on people, buildings and the ground. It varies from place to place for the same earthquake.
- The Modified Mercalli and Medvedev–Sponheuer–Karnik (MSK-64) scales both run from I to XII; the Bureau of Indian Standards (BIS) used MSK intensity to draw India’s seismic zones.
- Intensity falls with distance, rises on soft sediments and reclaimed land, and is greater for shallow-focus quakes.
| MSK intensity | Rough magnitude near epicentre | Effects |
|---|---|---|
| I–II | Below 3.5 | Not felt, or felt only by instruments and a few people at rest |
| III–IV | 3.5–4.2 | Felt indoors by many; windows and dishes rattle |
| V–VI | 4.3–5.4 | Felt by all; some damage to weak buildings |
| VII | 5.5–6.1 | Difficult to stand; damage to ordinary buildings |
| VIII–IX | 6.2–6.9 | Heavy damage, partial collapse of ordinary buildings; damage even to well-designed structures |
| X | 7.0–7.3 | Most masonry destroyed; rails bent; landslides |
| XI–XII | 7.4 and above | Few structures survive; bridges destroyed; wide fissures; near-total destruction |
- The table is a rough guide only: the intensity felt depends on depth, distance and ground conditions as much as on magnitude. The earthquake and tsunami terms fix the vocabulary.
Causes of earthquakes
- Earthquakes arise from disequilibrium in the earth’s crust. The principal causes:
- Plate tectonics: the lithosphere is broken into seven major plates and many minor ones that move over the asthenosphere. Most earthquakes, volcanoes and mountain building occur along plate margins: convergent (Himalaya), divergent (mid-ocean ridges) and transform (San Andreas).
- Faulting and folding: stress builds along faults until the rocks snap and slip (elastic rebound). Intra-plate faults produce shocks far from margins, as at Latur (Killari), Maharashtra, 30 September 1993, which killed nearly 10,000 people in a region once considered stable.
- Volcanic activity (magma movement) and isostatic adjustment of crustal blocks to unequal loads.
- Human-induced (anthropogenic) seismicity: the load and pore pressure of large reservoirs can trigger earthquakes, as at Koyna, Maharashtra (11 December 1967, magnitude about 6.3), India’s best-known case of reservoir-induced seismicity. Mining, fluid injection and fracking can also trigger shocks.
- The causes and effects of earthquakes include, besides ground shaking, soil liquefaction, surface rupture, landslides, fires, dam failures and tsunamis.
India’s earthquake history and seismic zoning
- The Himalayan arc is one of the world’s most active collision margins, as the Indian plate keeps pushing into Eurasia.
- Great earthquakes: Kangra (1905), Bihar–Nepal (1934) and Assam (1950); recent ones: Uttarkashi (1991), Chamoli (1999), Sikkim (2011) and Gorkha, Nepal (2015, M 7.8).
- Bhuj, Kachchh (26 January 2001): moment magnitude 7.7; more than 20,000 deaths and over a million buildings damaged. It led to the Gujarat State Disaster Management Act (2003), the first state law of its kind.
- The Indian Ocean tsunami (26 December 2004), from an Mw 9.1 earthquake off Sumatra, devastated the Tamil Nadu coast and the Andaman and Nicobar Islands. It led to the Indian Tsunami Early Warning Centre at INCOIS, Hyderabad (2007); tsunamis are compared with storm surges under ocean waves.
- Seismic zones (BIS, IS 1893): India is divided into four zones, II to V, by expected intensity.
- Zone V (very high, about 11% of the area): the whole north-east, parts of Jammu and Kashmir, Ladakh, Himachal Pradesh and Uttarakhand, the Rann of Kachchh, north Bihar and the Andaman and Nicobar Islands.
- Zone IV (high, about 18%): Delhi, the rest of the Himalayan states, the Indo-Gangetic plain margins, and parts of Gujarat and Maharashtra.
- Zone III (moderate, about 30%) includes Mumbai, Chennai and Kolkata. Zone II (low, about 41%) covers much of the peninsular interior.
- A revised code is under consultation. In November 2025 BIS notified a seventh revision, IS 1893 (Part 1): 2025. It drew on probabilistic seismic hazard assessment and created a new Zone VI for the whole Himalayan arc.
- After objections over cost and consultation, the notification was withdrawn in March 2026, and the 2016 code with four zones remains in force pending wider consultation.
Earthquake management: remedial measures
Structural measures
- Earthquake-resistant construction to the BIS codes (IS 1893 for loads, IS 13920 for ductile detailing, IS 4326 for masonry): ring beams (seismic bands) at plinth, lintel and roof levels; vertical reinforcement at corners; light roofs.
- Base isolation: buildings rest on rubber–lead bearings that absorb shaking, as in the Bhuj hospital rebuilt after 2001. Dampers absorb energy in tall buildings.
- Light, flexible construction in high-risk zones: timber and bamboo frames (traditional Assam-type houses, the kath-kuni of Himachal Pradesh, the Kashmiri dhajji-dewari) survive shaking better than heavy unreinforced masonry.
- Retrofitting of lifeline buildings: hospitals, schools, bridges and dams.
Non-structural measures
- Seismic microzonation of cities and land-use planning: avoiding construction on fault zones, steep slopes and liquefiable soils.
- Strict enforcement of building codes through bylaws, trained masons and engineers, and approval processes.
- Monitoring: the National Center for Seismology runs a national seismograph network; GPS measures strain build-up. Precise prediction is not yet possible, but probabilistic hazard assessment is.
- Preparedness: “Drop, Cover, Hold” drills in schools and offices, school safety programmes and emergency evacuation plans.
Post-earthquake response
- Rapid deployment of the National Disaster Response Force (NDRF), with collapsed-structure search and rescue using trained personnel, sniffer dogs and life-detection equipment.
- Emergency medical care, shelter, water and sanitation to prevent disease.
- “Build Back Better”: reconstruction that is stronger and safer than before.
- Damage assessment, insurance and compensation.
Floods
- A flood is the overflow of water onto land that is normally dry, most often a river spilling over its banks and submerging its floodplain.
- Floods follow high rainfall, but they are made worse by deforestation of catchments, poor farm and land management, silted channels, encroachment on floodplains and wetlands, poor drainage and unplanned urbanisation.
- Natural causes include intense or prolonged monsoon rain, cloudbursts, snowmelt, cyclones and storm surges, low gradients in deltas, and river shifting.
- Human causes include deforestation and land-use change, siltation of reservoirs and channels, embankments that confine rivers and raise their beds, poor dam operation, blocked drainage, and building in floodplains and on drained wetlands.
| Type | Cause | Indian example |
|---|---|---|
| Riverine floods | Monsoon rain beyond the river’s bank-full capacity; poor drainage | Brahmaputra floods in Assam; Ganga–Kosi floods in Bihar |
| Flash floods | Sudden, intense rain in hilly or urban areas; rapid runoff | Kedarnath (2013); repeated flash floods in Uttarakhand and Himachal Pradesh |
| Coastal floods | Storm surge during cyclones; tidal flooding | Odisha super cyclone (1999); Cyclone Fani (2019) |
| Urban floods | Impervious surfaces, choked drains, built-over water bodies | Mumbai (2005), Chennai (2015), Bengaluru (2022), Delhi (2023) |
| Glacial lake outburst floods (GLOFs) | Failure of a moraine or ice dam holding a glacial lake | South Lhonak, Sikkim (2023) |
| Dam-burst floods | Structural or operational failure of a dam | Machchhu-II dam, Morbi, Gujarat (1979) |
- India is among the most flood-affected countries. The Rashtriya Barh Ayog (National Flood Commission, 1980) assessed about 40 million ha as flood-prone, about an eighth of the country.
- On average about 7.5 million ha are affected each year, with about 1,600 lives lost and heavy damage to crops, houses and public utilities.
- The estimate is over four decades old; embankments and encroachment have since shifted flooding to new areas.
- Floods also have benefits: they renew soil fertility with fresh silt, recharge groundwater and wetlands, and sustain fisheries. This is why people settle floodplains in the first place.
- The floods in India and the Brahmaputra and Ganga systems give the regional pattern.
Hazards of floodplain settlement
- A floodplain is the flat valley floor built of alluvium that a river inundates when it overflows. It is part of the river’s own channel system, built by the fluvial processes of lateral migration and overbank deposition.
- Why people settle there: fertile alluvium, assured water, flat land for fields, roads and cities, river transport and fisheries.
- Hazards of floodplain settlement:
- Inundation: recurrent loss of life, crops, livestock, homes and stored grain. Low-lying settlements in backswamps and meander loops flood first and drain last.
- Bank erosion and channel shifting: rivers migrate and swallow land and villages.
- The Kosi, the “sorrow of Bihar”, has shifted its course westward by more than 100 km over about two centuries. Its embankment breach at Kusaha (Nepal) on 18 August 2008 sent it into an old channel and displaced millions.
- Majuli, the Brahmaputra river island, has lost much of its land to erosion.
- Sand casting: coarse sand dumped on fields by floods sterilises farmland for years.
- Waterlogging and drainage congestion: water trapped behind embankments, roads and railways stays for weeks, as in north Bihar and the Assam plains.
- Health hazards: contaminated water spreads cholera, diarrhoea, typhoid and leptospirosis; standing water breeds mosquitoes.
- The levee effect (false security): embankments protect against small floods. They encourage dense building behind them, and when a big flood breaches them, losses are far greater.
- Confined rivers also aggrade (raise their beds with silt), so the embankment must be raised again and again.
- Loss of the floodplain’s own services: wetlands, groundwater recharge and fisheries decline once the floodplain is built over.
- Urban floodplain encroachment:
- Delhi (July 2023): the Yamuna reached a record 208.66 m at the Old Railway Bridge and flooded colonies, a power station and the area around the Red Fort, all built on its floodplain.
- Srinagar (September 2014): the Jhelum overflowed into a city that had built over its flood channels and wetlands.
- Kerala (August 2018): India’s worst flood of the decade killed 483 people. Building on the floodplains of the Periyar and the Pamba magnified the damage when dam reservoirs had to release water.
Flood hazard mapping and floodplain zoning
- Flood hazard mapping delineates areas likely to be flooded by flood frequency, depth, velocity and duration, and marks the people and assets at risk.
- Data and methods: flood records and gauge data; satellite imagery, especially radar, which sees through monsoon cloud; elevation models; hydraulic models; and ground surveys.
- Outputs: inundation-frequency maps, depth and velocity maps, and risk maps that add population, buildings and infrastructure.
- Indian practice: the National Remote Sensing Centre (NRSC, ISRO) has prepared flood hazard zonation atlases from multi-year satellite records.
- The Assam atlas (2011) used ten flood seasons (1998–2007). It found about 28% of the state (22.2 lakh ha) inundated at least once; land flooded seven or more times was rated high to very high hazard.
- The Bihar atlas used 1998–2010, and atlases for other states followed.
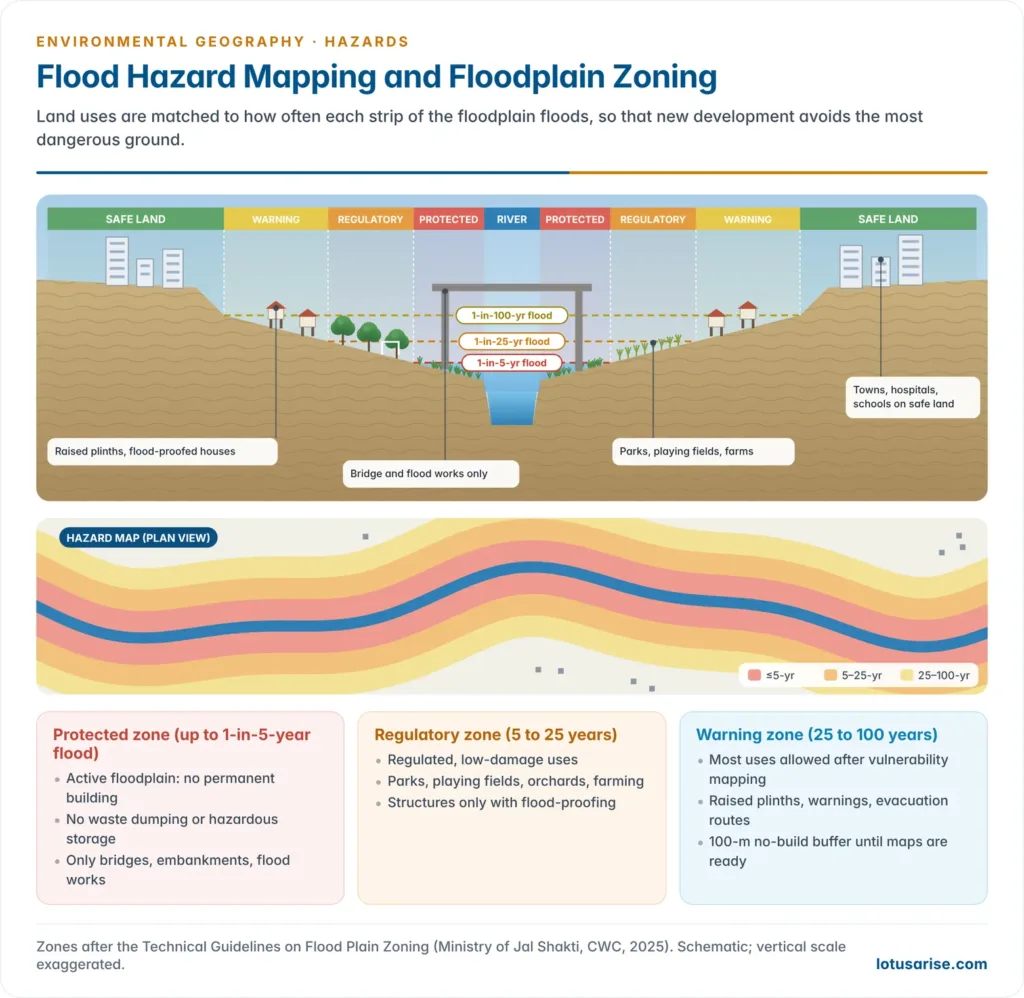
- Floodplain zoning turns the map into land-use rules: it permits uses that suffer little damage in the most frequently flooded zones and reserves the safer land for settlement.
- The Centre circulated a model floodplain zoning bill in 1975. Only Manipur, Rajasthan, Uttarakhand and the former state of Jammu and Kashmir enacted laws, and even there demarcation has lagged. Land and drainage are state subjects.
- The Technical Guidelines on Flood Plain Zoning (Ministry of Jal Shakti, prepared by the Central Water Commission, 2025) define three zones:
- Protected zone, the active floodplain flooded about once in 5 years: no permanent construction, waste dumping or hazardous storage, only essential works such as bridges and embankments.
- Regulatory zone, flooded between once in 5 and once in 25 years: regulated uses such as parks, playing fields, orchards and farming.
- Warning zone, flooded between once in 25 and once in 100 years: most uses permitted once vulnerability is mapped, with flood-proofed buildings and evacuation plans.
- Until mapping is complete, a 100-m no-development buffer from the river’s edge applies. No landfill is allowed within 500 m of a river.
- How far hazard mapping reduces flood impacts:
- Strengths:
- It is the basis of every other measure: zoning, codes, insurance, warning thresholds, evacuation routes, shelters and embankment design.
- It is cheap compared with structures and avoids creating new risk.
- Limits:
- Maps need long, accurate data, and shifting rivers such as the Kosi and Brahmaputra make them obsolete quickly.
- Climate change alters flood frequencies, so a “100-year flood” may now recur far more often.
- Mapping does nothing for existing settlements unless backed by relocation, flood-proofing and warning.
- Enforcement is weak against land pressure and political resistance.
- Mapping is therefore necessary but not sufficient: most effective as part of an integrated package of zoning, warning, preparedness and catchment management.
- Strengths:
Urban flooding: the case of Mumbai
- The event: on 26 July 2005, Santacruz recorded 944 mm of rain in 24 hours, the heaviest single day in the city’s record. About 1,094 people died across Maharashtra; Mumbai’s trains, airport and roads stopped for days.
- Natural causes:
- Intense monsoon bursts; high tides of over 4.5 m that block drain outfalls.
- Low-lying land, much of it reclaimed from the sea between the original seven islands.
- The short, steep Mithi River, which rises near Vihar and Powai lakes and floods within hours.
- Anthropogenic causes:
- A storm-water system over a century old, designed for only about 25 mm of rain an hour, with most outfalls lacking flood gates.
- Loss of mangroves and salt pans along Mahim Creek and the Mithi to construction.
- Encroachment on and narrowing of the Mithi’s channel, including at the airport.
- Concretisation that reduces infiltration; and drains choked with plastic and solid waste.
- Mitigation:
- The Brihanmumbai Storm Water Disposal System (BRIMSTOWAD) project: wider, deeper drains designed for 50 mm an hour and pumping stations at outfalls.
- Widening, deepening and protecting the Mithi, with retaining walls, removal of encroachments and treatment of sewage inflow.
- Mangrove protection, holding ponds and permeable surfaces.
- iFLOWS-Mumbai (2020), an integrated flood warning system of the Ministry of Earth Sciences.
- Pre-monsoon desilting and a ban on single-use plastics.
- The city floods afresh almost every monsoon, as in July 2019 and 2021: urban flooding is now a hazard class of its own, distinct from riverine floods. The NDMA issued separate guidelines on urban flooding in 2010.
Flood management: remedial measures
- Structural measures: dams and reservoirs that store flood peaks; embankments, flood walls and dykes; channel improvement and diversion channels; drainage improvement; anti-erosion spurs and revetments; raised platforms and flood shelters.
- Catchment management: afforestation of denuded slopes (deforestation is a major flood amplifier), restoration of wetlands that act as sponges, and check dams and soil conservation that cut runoff and silt.
- River linking: the National River Linking Project proposes transfers from surplus to deficit basins. Its flood-moderation value is contested, because the major floods of the Brahmaputra and Ganga far exceed any canal capacity; the interlinking of rivers is debated on ecological grounds too.
- Flood forecasting and early warning:
- The Central Water Commission runs about 360 forecasting stations (201 level and 159 inflow-forecast stations, 2026). Besides short-range forecasts, it now issues flood advisories several days ahead.
- Assam’s Flood Early Warning System (FLEWS), run by its State Disaster Management Authority with the North Eastern Space Applications Centre, gives district-level warnings.
- Non-structural measures:
- Floodplain zoning, flood-proofing (raised plinths, stilt houses, raised hand pumps and grain stores) and flood insurance.
- Urban measures: improved drainage, desilting, permeable surfaces, conservation of urban lakes and wetlands, and zoning laws.
- Living with floods: traditional societies adapted rather than resisted. The Mising of Assam build stilt houses (chang ghar); north Bihar’s farmers grew flood-tolerant crops and timed sowing to the receding water.
- Response: evacuation, relief and health camps, rescue boats of the response forces, and the participation of NGOs and local communities.
Disaster risk reduction and community resilience in flood-prone areas
- DRR acts before the flood: risk mapping, zoning, early warning, safe shelters, flood-proof houses, catchment care and insurance. It reduces the hazard’s impact on exposed people.
- Community resilience is the ability of villages and towns to absorb the flood and bounce back. It rests on local knowledge, volunteer networks, diversified livelihoods, savings and self-help groups, and strong local governance.
- The two work together: warnings save lives only if communities trust them and know where to go. Shelters work only if people can reach them, and recovery is faster where livelihoods are diversified and insured.
- Aapda Mitra, the NDMA’s community-volunteer scheme, began as a pilot in 30 flood-prone districts and was scaled up to 350 districts with about one lakh trained volunteers.
- Community-based warning, village task forces, raised platforms and shelters on the Assam and Bihar floodplains, and flood-resilient housing after the Kosi breach show the approach.
- Critique: spending still favours embankments and post-flood relief over mitigation. Floodplain zoning is barely enforced, and the poorest are pushed onto the most flood-prone land. Climate change is increasing extreme rainfall, so past flood frequencies under-state future risk.
Cyclones
- A tropical cyclone is an intense, low-pressure storm system, circular or oval in shape and commonly several hundred kilometres across, with winds spiralling inward around a calm eye. It forms over warm oceans (sea-surface temperatures above about 26–27 °C).
- It is destructive because of high winds (a super cyclonic storm has sustained winds of 222 km/h or more), storm surges that raise sea level by several metres, torrential rain and long persistence.
- The formation and anatomy of tropical cyclones are part of climatology.
| Region | Local name | Main season |
|---|---|---|
| North Atlantic, Caribbean, NE Pacific | Hurricanes | June–November |
| North-west Pacific | Typhoons | May–November (peak July–October) |
| Around Australia | Tropical cyclones (formerly called willy-willies) | November–April |
| North Indian Ocean (Bay of Bengal, Arabian Sea) | Cyclones | April–May (pre-monsoon); October–December (post-monsoon) |
- India’s long coastline is highly vulnerable. The Bay of Bengal produces about four times as many cyclones as the Arabian Sea, owing to warmer water, more moisture and the remnants of Pacific typhoons.
- Odisha, Andhra Pradesh, West Bengal and Tamil Nadu are most affected; their flat deltas let storm surges travel far inland. Gujarat is the main target on the Arabian Sea, where activity has risen with warming.
Odisha: from the 1999 super cyclone to Fani (2019)
- The super cyclone (29 October 1999) struck near Paradip with winds above 250 km/h and a storm surge of several metres. It killed about 10,000 people and devastated the delta districts, one of independent India’s deadliest disasters.
- It prompted Odisha to create the Odisha State Disaster Management Authority within two months, the first in the country, and to build a network of multipurpose cyclone shelters (now about 900).
- Phailin (October 2013): more than one million people were evacuated and deaths were held to a few dozen.
- Fani (3 May 2019): an extremely severe cyclonic storm made landfall near Puri with winds of about 175 km/h. About 1.2 million people were evacuated in under two days, and deaths were held to 64.
- What changed: accurate track and intensity forecasts from IMD with several days’ lead time; pre-planned evacuation down to the village; trained community task forces; shelters with stored supplies; and the National Cyclone Risk Mitigation Project.
Cyclone management: remedial measures
Pre-cyclone preparedness
- Coastal shelter belts and mangroves: mangroves are natural cyclone buffers. In 1999 villages behind the Bhitarkanika mangroves suffered fewer deaths than exposed ones.
- Protection of coastal sand dunes and barrier islands; coastal regulation of construction.
- Cyclone-resistant buildings and multipurpose cyclone shelters, used as schools in normal times; embankments and saline-water barriers.
Early warning and evacuation
- IMD’s cyclone warnings now come three to five days ahead from satellites, Doppler radars and numerical models, and track errors have fallen sharply.
- SMS alerts, radio, television and loudspeakers carry the warning; the “last mile” of communication is critical.
- Evacuation of people and livestock to safe shelters by pre-set routes, with fishermen called back from sea.
Post-cyclone relief
- Immediate relief and rehabilitation by the government with NGOs; rescue by the NDRF, Navy and Coast Guard.
- Restoration of power, water, roads and telecommunications; food, medicine and shelter.
- Reconstruction on the “Build Back Better” principle.
Drought and desertification as hazards
- Drought is an extended period of deficient rainfall relative to the normal, damaging crops, water supply and livelihoods. Each discipline sees it differently:
- Meteorologists: a period of no or deficient rain.
- Agronomists: a shortage of soil moisture for crop production.
- Economists: a rainfall shortage that hurts farm output and incomes.
- Farmers: a failure of rain at critical crop-growth stages.
- Drought is a creeping hazard: its onset and end are hard to fix, it spreads over huge areas and its effects accumulate long after the rain returns. The causes and regional pattern of drought in India are part of the country’s monsoon geography.
| Type | Definition | Trigger |
|---|---|---|
| Meteorological | Rainfall well below normal; IMD calls rainfall more than 25% below normal a drought (moderate 26–50%, severe above 50%) | Weak or failed monsoon; El Niño years |
| Agricultural | Too little soil moisture for crops, even when total rainfall is near normal | Erratic rain, dry spells, poor water-holding soils, unsuited cropping |
| Hydrological | Depletion of surface water and groundwater below normal levels | Prolonged rain deficit, over-extraction of groundwater, catchment degradation |
| Socio-economic | Water shortage that disrupts economic activity and human welfare | Prolonged agricultural drought, poverty and institutional failure |
- Effects: falling crop output and farm income; fodder and drinking-water scarcity; distress sale of assets, debt and migration. A drought lasting two to three consecutive years, if unmanaged, can turn into famine.
- Entitlement, not only food supply: as Amartya Sen showed for the Bengal famine of 1943, famines can occur when food is available but people lose the means to buy it. Drought management is therefore as much about employment, prices and public distribution as about rain.
- India declares drought using the Manual for Drought Management (2016, revised 2020). It combines rainfall deficit, satellite vegetation indices, soil moisture, crop sowing and hydrological indicators.
- Desertification as a hazard: desertification is land degradation in arid, semi-arid and dry sub-humid areas resulting from climatic variations and human activities (UN Convention to Combat Desertification, 1994).
- It is a slow-onset hazard: no single event, but a progressive loss of the land’s productivity, often triggered and accelerated by repeated droughts.
- Processes: wind erosion and sand drift, water erosion, vegetation loss, salinisation and waterlogging in irrigated drylands. Drought and overuse act together.
- Scale in India: 97.85 million ha (29.77% of the country) was undergoing land degradation in 2018–19, of which 83.69 million ha was desertification in drylands. The worst-hit are Rajasthan, Gujarat, Maharashtra, Ladakh, Jharkhand and Karnataka.
- Hazard impacts: falling yields, dust storms, sand burial of fields and roads, loss of pasture and out-migration.
- Preventive measures: shelter belts and sand-dune stabilisation, controlled grazing, dryland agroforestry, water harvesting and watershed development. India’s target is to restore 26 million ha of degraded land by 2030. Soil erosion and desertification are linked processes.
Drought control measures
- Rainwater harvesting: traditional structures such as johads, talaabs, kunds and tankas, and check dams, percolation tanks and farm ponds.
- Dry farming: drought-tolerant crops (millets, pulses), conservation tillage, mulching to reduce evaporation, and contingency crop plans for delayed monsoons.
- Efficient irrigation: canal lining to cut seepage; drip and sprinkler irrigation.
- Cropping-pattern change: avoiding water-intensive sugarcane and paddy in drought-prone areas; crop diversification.
- Land-use planning against water-intensive industry in arid areas; drought-tolerant orchards (ber, pomegranate) and silvi-pasture.
- Monitoring and forecasting: satellite-based drought assessment (vegetation indices from ISRO), seasonal monsoon forecasts and crop-weather advisories.
- Area programmes and safety nets: the Drought Prone Areas Programme (1973) and Desert Development Programme (1977), later merged into watershed schemes. Rural employment guarantees, crop insurance and the public distribution system are the safety nets that prevent famine.
Landslides and other high-altitude hazards
- A landslide is the rapid downslope movement of a mass of rock, debris or earth under gravity. It occurs when the shear stress on a slope exceeds the shear strength of its material.
- Landslides are one form of mass movement, alongside rockfalls, debris flows and creep.
- Causes:
- Heavy rainfall on slopes of loose soil and weathered rock, the most common trigger.
- Excavation and slope cutting for roads, buildings, tunnels and dams.
- Deforestation, which removes the roots that bind soil; and forest fires that strip cover.
- Earthquakes, volcanic ash on slopes, river undercutting of slope toes, and hillside farming and settlement.
- High-risk areas: steep slopes and their foot; sites of earlier slides; slopes stripped by fire or cut for roads and buildings; stream channels that carry debris flows; and hollows where runoff concentrates.
- Extent in India: the Landslide Atlas of India (NRSC, 2023) mapped about 80,000 landslides between 1998 and 2022.
- About 12.6% of the country (excluding snow-covered land) is landslide-prone. Of the mapped landslides, about 66.5% were in the north-western Himalaya, 18.8% in the north-eastern Himalaya and 14.7% in the Western Ghats.
- Rudraprayag and Tehri Garhwal (Uttarakhand) had the highest density and exposure.
- Wayanad (Kerala), 30 July 2024: after days of extreme rain, debris flows from the Punchirimattom–Mundakkai slopes swept through Mundakkai and Chooralmala before dawn. More than 250 people died and dozens were never found. The event showed that the Western Ghats, not only the Himalaya, carry severe landslide risk.
- Mountain hazards cascade: in the Himalaya, landslides combine with GLOFs, avalanches, cloudbursts, flash floods, earthquakes and permafrost thaw, as in Kedarnath (2013), Chamoli (2021), Joshimath (2023) and South Lhonak (2023). These high-altitude hazards arise from steep relief, the cryosphere and thin air, and are worsened by roads, dams and tourism in fragile valleys.
Landslide management: remedial measures
Engineering solutions
- Surface and subsurface drainage to keep water out of the slope; retaining and breast walls.
- Slope protection with geosynthetics, soil nailing and rock bolting; rockfall nets, catch fences and barriers.
- Redirecting runoff away from steep slopes; scientific muck disposal and controlled blasting on hill roads.
Biological measures
- Bioengineering: grasses, shrubs and trees that bind soil, such as vetiver and bamboo.
- Afforestation of denuded slopes; contour bunding and terracing in hill farming.
Planning and warning
- Landslide hazard zonation maps (the Geological Survey of India is the nodal agency) and land-use zoning that keeps buildings off high-risk slopes. Carrying-capacity limits for hill towns.
- Early warning: rain-gauge thresholds on critical slopes, slope sensors and satellite monitoring of ground movement.
- Emergency and evacuation plans for high-risk communities; geological checks before building on slopes.
Heat waves
- A heat wave is a period of abnormally high temperature. IMD declares one in the plains when the maximum reaches at least 40 °C and is 4.5 °C or more above normal, or when it reaches 45 °C whatever the normal.
- India’s record is 51.0 °C at Phalodi, Rajasthan, on 19 May 2016.
- They are growing longer and more frequent with warming, hit outdoor workers, the elderly and slum dwellers hardest, and are intensified in cities by the urban heat island.
- Response: the Ahmedabad Heat Action Plan (2013) pioneered warnings, cool shelters, changed work hours and hospital preparedness, and many states and cities have since followed.
- Heat waves are not on the national list of notified disasters, but states may use part of their disaster response fund for them.
Anthropogenic Hazards
Chemical and industrial hazards
- Chemical disasters arise from emission, fire or explosion involving hazardous chemicals. They cause casualties and damage to property and the environment, sometimes over generations.
- Elements at risk: the plant and its workers, vehicles carrying hazardous chemicals, residents of nearby settlements, and the surrounding ecosystem.
Bhopal gas tragedy (2–3 December 1984)
- Scale: the world’s worst industrial disaster.
- About 40 tonnes of methyl isocyanate (MIC) leaked from the Union Carbide India Limited pesticide plant in Bhopal. More than 500,000 people in the surrounding neighbourhoods were exposed as the dense gas drifted through them at night.
- Immediate impacts: officially 3,787 deaths, with claims of over 16,000, and about 5.58 lakh injuries: respiratory damage, eye injury and blindness. Tens of thousands fled the city.
- Long-term consequences: chronic lung, eye and immune disorders and reported birth defects; soil and groundwater contamination around the plant. Only in 2025 were the 337 tonnes of stored toxic waste incinerated at Pithampur, and the ground remains contaminated.
- Legal and institutional response:
- The Bhopal Gas Leak Disaster (Processing of Claims) Act, 1985.
- The Environment (Protection) Act, 1986, and the Manufacture, Storage and Import of Hazardous Chemical Rules, 1989.
- The Public Liability Insurance Act, 1991.
- The Chemical Accidents (Emergency Planning, Preparedness and Response) Rules, 1996, which created crisis groups at the central, state, district and local levels.
- The Supreme Court’s absolute liability doctrine (M.C. Mehta, oleum gas leak, 1986). These sit within India’s wider environmental legislation.
- Lessons: the danger of locating hazardous units amid dense settlements, poor maintenance and safety culture, the absence of community right-to-know, and weak emergency planning. Visakhapatnam (LG Polymers styrene leak, May 2020) showed the risks persist.
Other chemical hazards
- Oil spills, which threaten marine ecosystems and coastal livelihoods (Exxon Valdez, 1989; Deepwater Horizon, 2010).
- Road and rail accidents with hazardous cargo.
- Pesticide and fertiliser contamination of soil and groundwater.
- Heavy-metal contamination from mining and smelting.
- Accidental release of acid gases, chlorine and ammonia from plants.
Chemical hazard management
- Prevention: safe siting away from settlements, strict safety standards, regular audits, trained safety officers, and hazard and operability (HAZOP) studies.
- Preparedness: community right-to-know about chemicals stored nearby; on-site and off-site emergency plans; local crisis groups; mock drills.
- Response: specialised CBRN (chemical, biological, radiological and nuclear) teams of the NDRF; protective equipment, decontamination and evacuation.
- Law: the Environment (Protection) Act, 1986; the safety provisions of the Factories Act, 1948 (now in the Occupational Safety, Health and Working Conditions Code, 2020); the 1996 rules; and NDMA guidelines on chemical disasters.
Nuclear and radiation hazards
- Radiation pollution is any ionising or non-ionising radiation that results from human activity. Its major source is the decay of radioactive nuclides.
- Nuclear hazards arise from weapons testing, nuclear power generation, spent-fuel reprocessing, nuclear medicine and research laboratories.
| Accident | Date | Type | Consequences |
|---|---|---|---|
| Three Mile Island, USA | 28 March 1979 | Partial meltdown; small controlled release | No confirmed radiation deaths; public alarm and sweeping safety reforms in the US |
| Chernobyl, Ukraine (USSR) | 26 April 1986 | Reactor explosion and fire | 31 early deaths; WHO projected up to about 4,000 eventual cancer deaths among the most exposed; more than 3,50,000 resettled; a 30-km exclusion zone |
| Fukushima Daiichi, Japan | 11 March 2011 | Meltdowns after the Tōhoku earthquake and tsunami | More than 1,50,000 evacuated; one worker’s later cancer death officially linked to radiation (2018); contamination of soil and sea; decades of decommissioning |
- Effects of radiation: studies of the survivors of Hiroshima and Nagasaki documented the effects of high doses.
- These include acute radiation sickness, cancers (some at once, others after decades), genetic mutations, birth defects, immune suppression and heart disease.
- Even low-level chronic exposure raises cancer risk.
Radiation hazard management
- Waste storage: radioactive waste cannot be neutralised chemically. It is vitrified and kept in heavily shielded containers, ultimately in deep geological repositories in stable rock or salt formations far from habitats.
- Safety and preparedness: International Atomic Energy Agency standards; in India the Atomic Energy Regulatory Board (1983) and the NDMA’s guidelines for radiological emergencies; emergency planning zones around plants and off-site exercises.
- The basic limit: many wastes stay dangerous for thousands of years, so no storage method is absolutely proof against failure over such timescales.
Biological hazards
- Biological hazards are organisms or their toxins that cause disease or loss on a disaster scale: epidemics and pandemics, pest and locust outbreaks, and invasive species.
- COVID-19 was notified as a disaster in India in March 2020, and the Disaster Management Act was used to run the national response, the first such use for a pandemic.
- The desert locust upsurge of 2019–20 swept across Rajasthan, Gujarat and central India.
- Ecological change spreads disease: deforestation brings people into contact with zoonoses (Nipah in Kerala), and dams and floods spread water-borne and vector-borne diseases. These links are traced under environment and human health.
- Management: disease surveillance, the One Health approach linking human, animal and environmental health, vaccination, vector control, and international locust warning and control.
Human Response and Disaster Management in India
From relief to risk reduction
- Colonial and early independent India treated disasters as a matter of relief. The Famine Commission (1880) and the Famine Codes that followed organised relief works, and relief commissioners distributed aid after floods and cyclones.
- Shift to preparedness: the High Powered Committee on Disaster Management (1999), the Odisha super cyclone (1999) and the Bhuj earthquake (2001) changed thinking.
- Disaster management moved from the Ministry of Agriculture to the Ministry of Home Affairs (2002). Gujarat (2003) and other states passed their own laws.
- Statutory framework: the Disaster Management Act, 2005 (assented on 23 December 2005); the National Policy on Disaster Management (2009); and the National Disaster Management Plan (2016, revised 2019), the first national plan aligned with the Sendai Framework.
- Human responses thus run from traditional adjustment (stilt houses in Assam, timber-laced houses in the western Himalaya, water harvesting in the Thar) through technological control (dams, embankments, sea walls) and institutional management (laws, forecasting, zoning, insurance) to community-based resilience.
The Disaster Management Act, 2005 and its 2025 amendment
| Institution | Level | Head | Role |
|---|---|---|---|
| National Disaster Management Authority (NDMA) | National (apex) | Prime Minister | Policies, plans and guidelines; national plan; national disaster database; post-disaster audits |
| National Executive Committee (NEC) | National | Union Home Secretary | Coordinates and monitors the national plan |
| State Disaster Management Authority (SDMA) | State | Chief Minister | State plan; state disaster database; risk assessment |
| District Disaster Management Authority (DDMA) | District | Collector or District Magistrate | Planning, coordination and implementation in the district |
| Urban Disaster Management Authority (UDMA) | State capitals and municipal-corporation cities | Municipal Commissioner (Collector as vice-chair) | City disaster plan and its implementation (added in 2025) |
| National Disaster Response Force (NDRF) | National, operational | Director General | Specialist response, including CBRN; 16 battalions |
| State Disaster Response Force (SDRF) | State, operational | State police or DM department | First response in the state; given statutory backing in 2025 |
| National Institute of Disaster Management (NIDM) | National | Executive Director | Training, research and capacity building |
- The Disaster Management (Amendment) Act, 2025 received assent on 29 March 2025 and came into force on 9 April 2025. Its main changes:
- NDMA and SDMAs now prepare the national and state plans themselves; earlier the executive committees prepared them.
- Both must periodically assess disaster risks, including emerging risks from extreme climate events, and maintain national and state disaster databases on risks, funds spent, and preparedness and mitigation plans.
- States may set up Urban Disaster Management Authorities for state capitals and cities with municipal corporations, chaired by the Municipal Commissioner.
- States may constitute State Disaster Response Forces and set their functions and terms of service.
- Statutory status for the National Crisis Management Committee (Cabinet Secretary) and the High Level Committee (financial help to states); the NDMA may frame regulations with central approval.
- Critique: some see the amendment as centralising and as adding authorities without assured funds; urban authorities remain optional.
- Finance: the 15th Finance Commission (2021–26) created national and state mitigation funds beside the response funds (an 80:20 split), the first dedicated money for risk reduction.
- Notified disasters: central assistance covers 12 hazards: cyclone, drought, earthquake, fire, flood, tsunami, hailstorm, landslide, avalanche, cloudburst, pest attack, and frost and cold wave. States may also spend part of their response fund on local disasters such as lightning and heat waves.
The disaster management cycle
- Disaster management is a continuous cycle, not a one-time response.
- Pre-disaster (risk reduction): mitigation (lasting measures that reduce the hazard’s impact, such as zoning, codes, embankments and mangroves) and preparedness (plans, early warning, drills, stockpiles and trained responders).
- During and after the disaster: response (warning, evacuation, search and rescue, relief) followed by recovery (rehabilitation and reconstruction).
- Recovery that builds back better feeds into fresh mitigation, closing the loop.
- Structural and non-structural measures cut across the cycle.
- Structural (dams, embankments, shelters, resistant buildings) and non-structural (laws, zoning, insurance, warning, training).
- Ecosystem-based DRR: mangroves, wetlands, forests and dunes as cheap, self-renewing natural buffers, a part of ecosystem management.
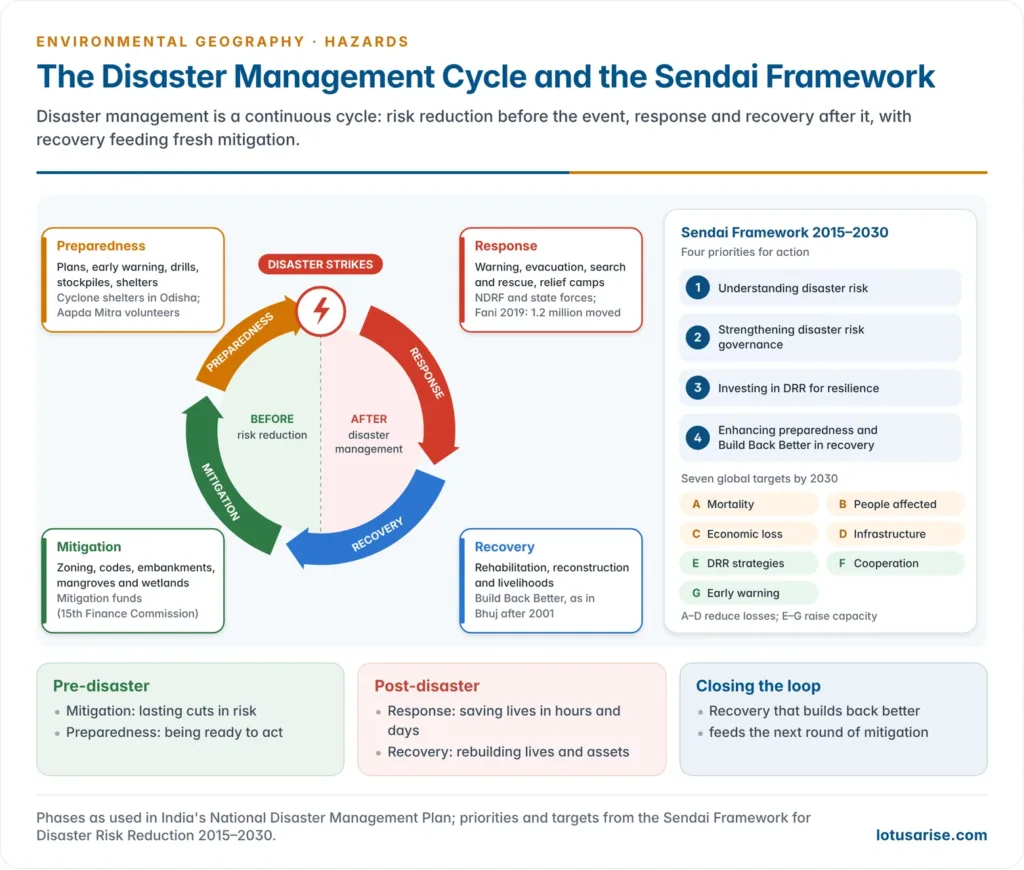
Sendai Framework for Disaster Risk Reduction 2015–2030
- Adopted on 18 March 2015 at the Third UN World Conference on Disaster Risk Reduction in Sendai, Japan, and endorsed by the UN General Assembly in June 2015. It was the first major agreement of the post-2015 development agenda, alongside the SDGs and the Paris Agreement.
- It succeeded the Hyogo Framework for Action (2005–2015), which had followed the Yokohama Strategy (1994) of the International Decade for Natural Disaster Reduction (1990s).
- Outcome sought: a substantial reduction of disaster risk and losses in lives, livelihoods, health and economic, social, cultural and environmental assets.
- Shift: from managing disasters to managing risk, and from natural hazards alone to natural and man-made hazards, including technological, environmental and biological ones.
- Four priorities for action:
- Understanding disaster risk.
- Strengthening disaster risk governance to manage disaster risk.
- Investing in disaster risk reduction for resilience.
- Enhancing disaster preparedness for effective response and to “Build Back Better” in recovery, rehabilitation and reconstruction.
| Target | By 2030 |
|---|---|
| A | Substantially reduce global disaster mortality (deaths per 100,000, 2020–2030 against 2005–2015) |
| B | Substantially reduce the number of affected people globally |
| C | Reduce direct economic loss in relation to global GDP |
| D | Substantially reduce damage to critical infrastructure and disruption of basic services, including health and education facilities |
| E | Substantially increase the number of countries with national and local DRR strategies (by 2020) |
| F | Substantially enhance international cooperation with developing countries |
| G | Substantially increase the availability of and access to multi-hazard early warning systems and disaster risk information |
- Global follow-up: the UN’s Early Warnings for All initiative (2022) aims to bring every person under an early warning system by the end of 2027.
India’s initiatives and achievements
- Prime Minister’s Ten-Point Agenda on DRR (2016), announced at the Asian Ministerial Conference on DRR in New Delhi.
- Coalition for Disaster Resilient Infrastructure (CDRI), launched by India at the UN Climate Action Summit in September 2019, with its secretariat in New Delhi, promotes infrastructure built with disaster risk in mind.
- G20 Disaster Risk Reduction Working Group, first set up under India’s presidency (2023). Its five priorities were early warning for all, disaster-resilient infrastructure, financing for DRR, response systems and Build Back Better, and ecosystem-based approaches.
- Capacity and technology: Aapda Mitra volunteers and school safety programmes; ISRO’s satellite monitoring and the National Database for Emergency Management; IMD’s Doppler radars; INCOIS tsunami and storm-surge warnings; mobile alerts through the Common Alerting Protocol.
Remedial measures: a synthesis
| Approach | Measures | Strength | Weakness |
|---|---|---|---|
| Structural | Dams, embankments, sea walls, shelters, resistant buildings, slope works | Protects lives and assets immediately | Costly; false security (levee effect); ecological damage |
| Non-structural | Hazard mapping, zoning, codes, insurance, warning, drills, awareness | Cheap; prevents new risk | Weak enforcement; needs institutions and data |
| Ecosystem-based | Mangroves, wetlands, forests, dunes, watershed care | Self-renewing; many co-benefits | Slow to establish; limits against extreme events |
| Community-based | Volunteers, local warning, traditional knowledge, self-help groups | Reaches the last mile; builds resilience | Needs sustained funding and training |
- Gaps and challenges in India:
- The bias towards relief and reconstruction over mitigation persists, though the new mitigation funds begin to correct it.
- Building codes and zoning are poorly enforced: unsafe construction continues in seismic zones IV and V, and floodplains and hill slopes are built over.
- Urban risk is rising with unplanned growth on low land, wetlands and slopes.
- Climate change is increasing extreme rainfall, heat and cyclone intensity, so hazard maps based on past data under-estimate risk.
- Data gaps: the flood-prone area estimate dates from 1980, and local risk maps are scarce.
- The poorest and most marginal live on the most hazardous land and recover most slowly. Vulnerability is a development problem, not only an engineering one.
- The way forward: risk-informed development that screens every plan for hazards; enforced zoning and codes; protection of buffering ecosystems; last-mile warnings people trust; insurance and social protection; and empowered local bodies. Hazards cannot be abolished, but disasters can be made far less frequent and less deadly.
Previous Year Questions
2026With suitable examples describe the hazards of flood plain settlement.2026Disaster risk reduction and community resilience are the two pillars that need to be prioritized in the flood prone areas of India. Critically analyse.2020Discuss the human response to and management of hazards and disasters in India.2020Demarcating the seismic zones of India, suggest suitable interventions required in most sensitive seismic zones for sustainable human settlements.2019The impact of floods on life and property can be most effectively reduced by hazard mapping. Comment.2018Explain the natural and anthropogenic causes and mitigation measures of frequent flooding in Mumbai.2008Write short note on Desertification as an environmental hazard.1995Write short note: Natural Hazards.





Thanks Sir
Thank You Sir!