

- Marine pollution is the introduction by humans, directly or indirectly, of substances or energy into the sea that harms living resources, endangers human health, hinders fishing and other uses, or impairs water quality. This is the definition in Article 1 of UNCLOS.
- The test is harm, not mere presence: the ocean can dilute, disperse and degrade a great deal, and pollution begins where inputs exceed that capacity.
- For most of history the sea was treated as a bottomless dump. Sewage sludge, industrial waste, surplus explosives and vast volumes of dredge spoil were tipped offshore on the belief that “dilution is the solution”.
- Today’s loads of pesticides, sewage and industrial fallout have outrun that capacity; DDT, mercury and lead now occur far from any coast.
- Pollutants fall into two behavioural classes:
- degradable ones (sewage, most oil, heat) break down or disperse, so harm is local and recovery is possible;
- persistent or conservative ones (heavy metals, persistent organic pollutants, plastics, long-lived radionuclides) do not, so they accumulate in sediment and living tissue.
- It is one of several threats to the world ocean, and the one most directly in human control.
Sources and Pathways
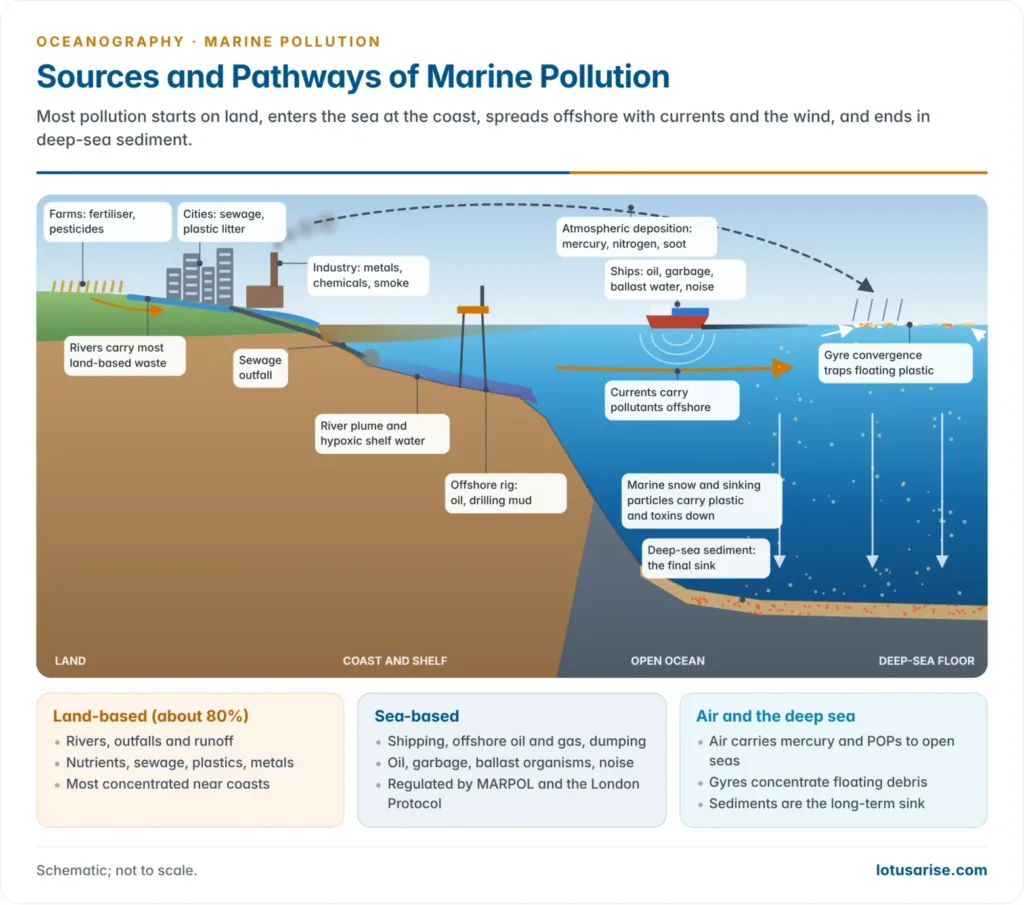
- About 80% of marine pollution comes from land, carried by rivers, outfalls, runoff and the air. Ships, offshore platforms and dumping supply the rest.
- Point sources (an outfall, a refinery pipe) are easy to license; non-point sources (farm runoff, storm water, deposition from the air) are diffuse and hardest to control.
- Pollutants follow a coast-to-deep-sea pathway:
- they are most concentrated in estuaries, bays and enclosed seas (Baltic, Mediterranean, the creeks around Mumbai), where flushing is slow;
- suspended clay and dead plankton adsorb metals and pesticides into coastal mud, a toxic legacy that dredging or storms can stir up again;
- currents and eddies carry floating material offshore, where gyres trap it;
- sinking particles, faecal pellets and marine snow take persistent pollutants to the deep-sea floor, the final sink.
| Source | Main pollutants | Share and pathway |
|---|---|---|
| Land: rivers, sewage, runoff | Nutrients, pathogens, plastics, pesticides, metals | Dominant; via rivers and outfalls |
| Atmosphere | Mercury, lead, persistent organic pollutants, nitrogen, soot | Wet and dry deposition over the open ocean |
| Ships | Oil, garbage, sewage, ballast-water organisms, noise | Routine discharge and accidents |
| Offshore oil, gas and seabed mining | Oil, drilling muds, sediment plumes | Blowouts, leaks, mining tailings |
| Dumping | Dredge spoil, sludge, past radioactive and industrial waste | Now tightly restricted |
Major Pollutants
Sewage and pathogens
- Untreated or partly treated sewage brings three harms at once:
- an organic load whose decay raises biochemical oxygen demand and strips oxygen from creeks and harbours;
- nutrients that feed algal blooms;
- pathogens (cholera, typhoid and hepatitis agents, faecal bacteria) that contaminate shellfish and force beach closures.
- India: the country generated about 72,368 million litres of sewage a day, against an installed treatment capacity of 31,841 MLD, and actually treated only about 28% (CPCB, 2021).
- The rest reaches the sea through rivers and nullahs; the waters off Mumbai, Chennai and Kolkata recur as pollution hotspots.
Oil
- Natural seeps supply nearly half of the oil reaching the sea. Most of the human share comes from small, routine releases (urban runoff, bilge and tank washings, refineries), not tanker disasters, which are rarer but locally catastrophic.
- Large tanker spills have become far less common. The quantity lost in the 2010s was about 95% lower than in the 1970s, and 2025 saw only three spills above 700 t, about 4,000 t in all (ITOPF).
- Double hulls (mandatory for new tankers under MARPOL from the 1990s), better navigation and port-state inspection explain most of the fall.
- Fate of a spill: it spreads into a slick, evaporates (lighter fractions), emulsifies into “chocolate mousse”, is photo-oxidised and biodegraded, and the heavy residue forms tar balls that sink or strand.
- Tar balls reach Goa and the Konkan coast each south-west monsoon from tanker routes and offshore fields.
- Effects: oiled plumage and fur lose insulation and buoyancy; slicks cut light and gas exchange; toxic fractions damage gills, eggs and larvae.
- Recovery depends on the coast. Wave-beaten rocky shores clean themselves within months. Sheltered marshes, mangroves and reefs hold oil in their sediment and recover slowest, over years to decades.
- Exxon Valdez killed an estimated 250,000 seabirds, 2,800 sea otters and 300 harbour seals; clean-up cost over US $2 billion, and the disaster produced the US Oil Pollution Act of 1990.
- Clean-up (booms, skimmers, dispersants, burning, and bioremediation such as India’s bacterial Oilzapper) rarely recovers more than a fraction.
- Container ships are the new risk off India: the Wan Hai 503 caught fire off north Kerala on 9 June 2025 with 157 containers of hazardous cargo.
- For the MSC Elsa 3 sinking, Kerala filed an admiralty suit for ₹9,531 crore, and the High Court ordered the arrest of a sister ship as security.
| Spill | Year and place | Scale and lesson |
|---|---|---|
| Torrey Canyon | 1967, off Cornwall | First supertanker disaster; spurred MARPOL |
| Exxon Valdez | 1989, Prince William Sound, Alaska | About 41,000 m³ of crude; about 2,000 km of shore oiled |
| Deepwater Horizon | 2010, Gulf of Mexico | Largest accidental marine spill, about 4.9 million barrels; a well blowout, not a tanker |
| Ennore | December 2023, Chennai | Refinery oil carried into Ennore Creek by Cyclone Michaung floods |
| MSC Elsa 3 | May 2025, off Kochi | Container ship sank with about 640 containers and about 450 t of fuel |
Plastics and microplastics
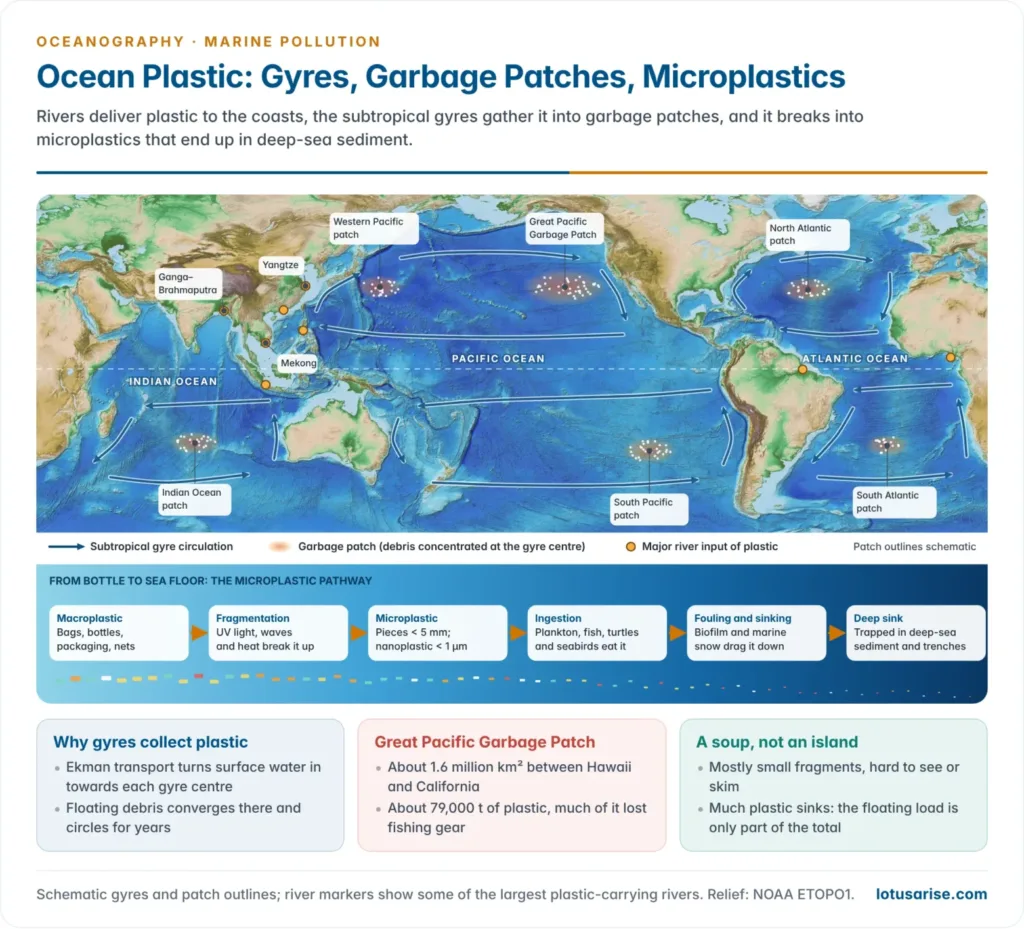
- Scale: plastic production reached about 460 million tonnes in 2019, only 9% of plastic waste was recycled, and some 30 million tonnes have accumulated in the oceans (OECD, 2022).
- Estimates of the yearly flow into the sea differ with method: about 1.7 million tonnes in 2019 (OECD) against about 11 million tonnes (Pew Charitable Trusts, 2020), which would nearly triple to about 29 million tonnes by 2040 without action.
- A 2024 study in Nature put plastic pollution released to the environment at about 52 million tonnes a year, more than half from open burning, and ranked India first (about 9.3 million tonnes), mostly from uncollected waste.
- Microplastics are fragments under 5 mm:
- primary: nurdles (pre-production pellets), microbeads, synthetic textile fibres, tyre dust;
- secondary: larger debris broken down by UV light and wave abrasion.
- Garbage patches form in the convergent centres of the five subtropical gyres, where Ekman transport piles floating debris.
- The Great Pacific Garbage Patch (between Hawaii and California) covers about 1.6 million km² and holds about 79,000 t of plastic. Abandoned fishing gear makes up a large share of its mass, while microplastics make up most of its pieces.
- Effects: entanglement and ghost fishing by lost nets; ingestion by turtles, seabirds and whales that mistake bags for food; microplastics adsorb persistent toxins and enter the food web; floating debris rafts invasive species.
- Microplastics now occur from the Mariana Trench to Arctic sea ice.
- India’s coasts receive plastic from the Ganga–Brahmaputra and from beach litter, and nurdles from the MSC Elsa 3 washed up in Kerala and Sri Lanka. India banned identified single-use plastic items from 1 July 2022.
Nutrients, eutrophication and dead zones
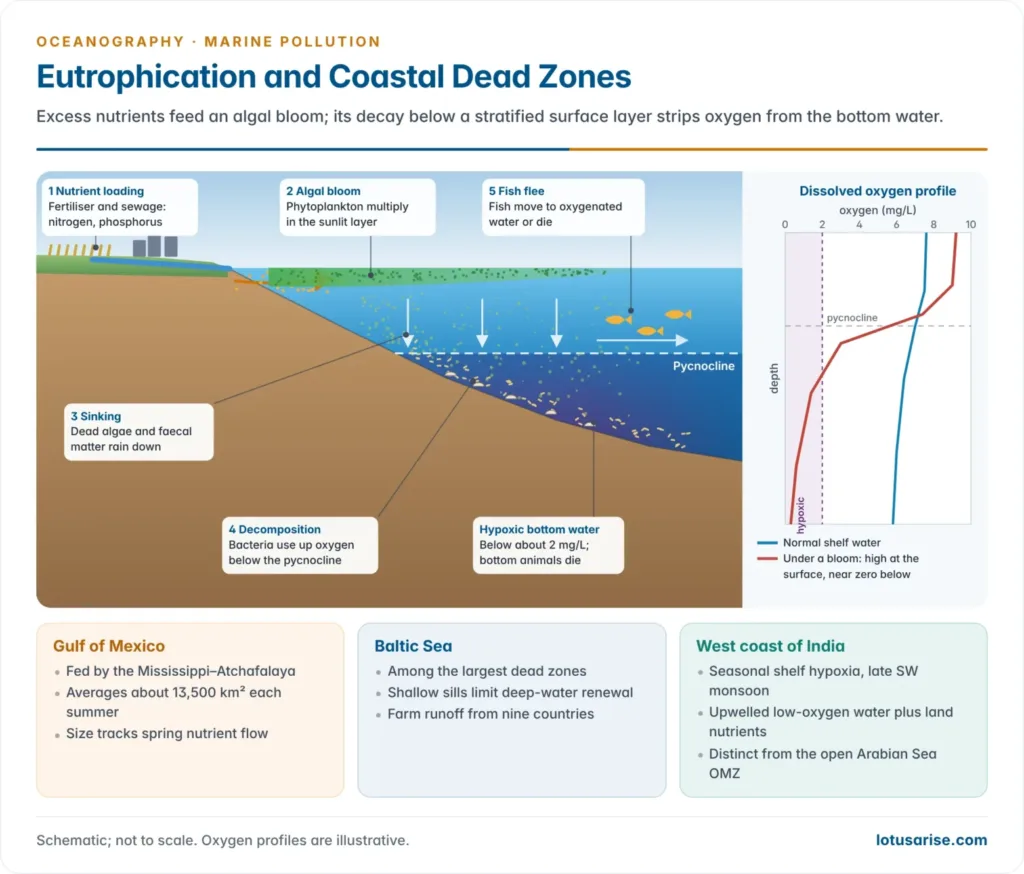
- Eutrophication is over-enrichment of water with nitrogen and phosphorus, mostly from fertiliser runoff, sewage and livestock waste, with atmospheric nitrogen adding more.
- The chain: nutrients feed an algal bloom → the bloom dies and sinks → bacterial decomposition consumes dissolved oxygen → bottom water turns hypoxic (below about 2 mg/L) or anoxic.
- Summer stratification seals the bottom layer off from re-oxygenation, so dead zones are seasonal and recur.
- More than 500 coastal dead zones are known: the Gulf of Mexico (about 13,500 km² in an average summer), the Baltic Sea, and a seasonal low-oxygen zone on India’s western shelf in the late south-west monsoon, where upwelled oxygen-poor water meets land nutrients.
- They differ from the natural oxygen minimum zones of the open Arabian Sea and eastern Pacific, but warming expands both: the ocean has lost about 2% of its oxygen since 1960.
- Harmful algal blooms (red tides) add toxins; Noctiluca blooms now spread across the Arabian Sea in winter.
Toxic chemicals and heavy metals
- Persistent organic pollutants (DDT, aldrin, dieldrin, PCBs, dioxins) and heavy metals (mercury, lead, cadmium) do not break down.
- Being fat-soluble and poorly excreted, they bioaccumulate in each organism and biomagnify up the food chain, so top predators and the people who eat them carry the highest doses.
- Even small concentrations of DDT and mercury depress plankton production, the base of the food web.
- Much of the load arrives through the air: pesticide levels peak over coastal seas, yet the same compounds reach polar seas far from any source.
- Minamata disease (Japan, identified in 1956) is the classic case. Methylmercury discharged by the Chisso chemical works into Minamata Bay from 1951 to 1968 concentrated in shellfish and fish.
- It poisoned fishing families and damaged unborn children; 2,265 victims had been officially certified by 2001, and a second outbreak struck Niigata in 1965.
- The Stockholm Convention (2001, in force 2004) bans or restricts the worst persistent pollutants, allowing DDT only for malaria control. Newer “forever chemicals” (PFAS) and pharmaceuticals remain largely unregulated at sea.
Radioactive, thermal, noise and biological pollution
| Type | Sources | Effects |
|---|---|---|
| Radioactive | Waste drums dumped until the 1993 ban; weapons tests; reprocessing plants; nuclear-powered vessels; the Fukushima release | Long-lived isotopes accumulate in sediment and seafood |
| Thermal | Cooling water from coastal power plants | Lower dissolved oxygen; stress on corals and fish near outfalls |
| Noise | Shipping, seismic air-gun surveys, naval sonar | Masks the calls of whales and dolphins, which navigate by sound |
| Biological | Ballast water, hull fouling, untreated sewage | Invasive species, pathogens, disease |
- Sound carries farther and faster in water than in air, and whales live in a largely acoustic world; the IMO’s revised ship-noise guidelines (2023) remain voluntary.
- Two newer pollutants blur into other threats: carbon dioxide itself, which drives acidification, and the sediment plumes that deep-sea mining collectors would raise over the abyssal floor.
Effects on resources and people
| Domain | Main effects |
|---|---|
| Ecosystems | Loss of coral, seagrass and mangrove; dead zones; altered food webs |
| Marine resources | Fish kills and fishing bans; contaminated shellfish; lower catch value |
| Human health | Mercury and toxin exposure through seafood; pathogens from sewage |
| Economy | Clean-up costs; lost tourism, fisheries and port income |
| Climate | Weaker ocean carbon uptake where ecosystems are degraded |
- Pollution hits coastal fishers first: fishing was suspended off Sri Lanka after the X-Press Pearl and around the MSC Elsa 3 wreck off Kerala.
Case Studies
| Event | What happened | Key figures | Lessons |
|---|---|---|---|
| MV Wakashio, Mauritius | Japanese-owned bulk carrier ran aground on the reef off Pointe d’Esny, 25 July 2020 | About 1,000 t of very-low-sulphur fuel oil leaked into the lagoon near Blue Bay Marine Park; the ship broke in two on 15 August | New low-sulphur fuels behave differently from crude; India sent the Coast Guard and about 30 t of equipment |
| X-Press Pearl, Sri Lanka | Container ship caught fire off Colombo, 20 May 2021, and sank on 2 June | 1,486 containers, including nitric acid; about 70–75 billion plastic nurdles released | Largest recorded plastic spill; Sri Lanka’s Supreme Court ordered US $1 billion in compensation (2025) |
| Fukushima Daiichi, Japan | Release of treated cooling water began on 24 August 2023 | Diluted to below 1,500 Bq/L of tritium; about 170,000 t released by August 2026 over a plan of about 30 years | The IAEA (2023) found it consistent with safety standards; China suspended Japanese seafood imports |
- Together they show ordinary shipping spilling fuel, chemicals and pellets, and a controlled radioactive release contested more on trust than on dose.
Governance
International framework
| Instrument | Year | Scope |
|---|---|---|
| UNCLOS Part XII | 1982 (in force 1994) | Duty to protect the marine environment; covers all six sources |
| MARPOL | 1973/78 (in force 1983) | Ship pollution: oil, chemicals, sewage, garbage (plastic ban), air (0.5% sulphur cap from 2020) |
| London Convention and Protocol | 1972; 1996 (in force 2006) | Dumping; the Protocol bans all dumping except a short permitted list |
| UNEP Regional Seas Programme | 1974 | Regional action plans, including the South Asian Seas Programme |
| Basel Convention | 1989; plastic amendments in force 2021 | Trade in hazardous and plastic waste |
| Ballast Water Management Convention | 2004 (in force 2017) | Invasive species in ballast water |
| Minamata Convention | 2013 (in force 2017) | Mercury |
| BBNJ (High Seas) Agreement | 2023 (in force 17 January 2026) | Marine protected areas and impact assessment on the high seas |
- MARPOL works through six annexes: I oil (1983), II noxious liquid chemicals, III harmful packaged goods, IV sewage (2003), V garbage (1988, with a total ban on discharging plastics) and VI air pollution (2005).
- Special Areas (Mediterranean, Baltic, Gulfs) carry stricter discharge limits.
- The dumping regime tightened in steps. The London Convention (in force 1975) listed banned and licensed wastes; its 1993 amendments banned radioactive waste and phased out industrial waste and incineration at sea.
- The 1996 Protocol reversed the logic: everything is banned except an approved list (dredged material, sewage sludge, fish waste, vessels, inert rock, natural organic matter). It writes in the precautionary approach and the polluter-pays principle; a 2006 amendment allows CO₂ storage beneath the seabed.
- The global plastics treaty is still unfinished.
- The UN Environment Assembly mandated it in March 2022. Five sessions followed (Punta del Este, Paris, Nairobi, Ottawa, Busan) and a resumed Geneva session (August 2025), which ended without agreement.
- The split is between countries seeking caps on plastic production and oil- and plastic-producing states that want a treaty on waste management; India also opposes production caps.
- A new chair, Julio Cordano of Chile, was elected in February 2026, and the next session is due in March 2027.
India’s measures
| Area | Measures |
|---|---|
| Law | Water Act (1974); Environment Protection Act (1986); Coastal Regulation Zone Notification (2019); Plastic Waste Management Rules with extended producer responsibility |
| Oil spills | National Oil Spill Disaster Contingency Plan, run by the Indian Coast Guard; INCOIS forecasts spill drift |
| Monitoring | National Centre for Coastal Research tracks seawater quality |
| Clean-up | Namami Gange; Blue Flag beaches; Swachh Sagar, Surakshit Sagar coastal clean-up (2022) |
- The Indian Coast Guard has coordinated oil-spill response in India’s maritime zones since 1986; the contingency plan (1993, revised 2015) gives ports, oil agencies and coastal states their own clean-up zones.
- Seawater-quality monitoring began in 1991 at about 70 coastal sites, tracking some 25 water, sediment and biological parameters.
- The weak link is sewage: treatment lags far behind generation, and coastal enforcement remains thin.
Critical evaluation
- Laws are strong at sea but weak on land. Ship pollution has fallen sharply under MARPOL, but land-based sources, the 80%, rest on national laws and voluntary plans.
- SDG target 14.1 aimed to significantly reduce marine pollution, especially from land, by 2025; the deadline has passed with plastic and nutrient loads still rising.
- Enforcement depends on flag and port states. Flags of convenience and liability caps (as in the X-Press Pearl case) blunt compensation, and admiralty suits such as Kerala’s are slow.
- The commons problem: pollution crosses borders, and its costs fall on coastal fishers and island states far from the polluter.
- Science runs ahead of rules. Microplastics, ocean noise and deep-sea mining plumes are poorly regulated, and pollution interacts with warming and acidification, compounding stress on coral reefs.
- Even basic numbers are uncertain: plastic-flow estimates differ sixfold.
- The way forward is source control: sewage treatment, fertiliser efficiency, a circular plastics economy, a binding plastics treaty, and integrated coastal-zone management.
Previous Year Questions
2023Give an account of marine resources and their economic significance. How has marine pollution affected such resources?2016Bring out the various ecological problems associated with the exploitation and use of oceans and their resources.2014Give a critical account of reasons and consequences of marine pollution.





very helpful and to the point notes…thank you..