

- Global warming is the rise in the Earth’s average surface temperature since the pre-industrial period (1850–1900), caused mainly by human emissions of greenhouse gases. It is the core of present anthropogenic climate change.
- The IPCC’s Sixth Assessment Report (AR6, 2021–2023) states that it is “unequivocal” that human influence has warmed the atmosphere, ocean and land. The world was ~1.1 °C warmer in 2011–2020 than in 1850–1900.
- 2024 was the warmest year on record (~1.55 °C) and the first calendar year above 1.5 °C; 2025 (~1.43 °C) ranked second or third.
- Man’s role is that of the principal forcing agent; his response is mitigation (cutting the cause) and adaptation (living with the effects).
Role of Man: Anthropogenic Forcing

The Enhanced Greenhouse Effect
- Greenhouse gases are transparent to incoming short-wave sunlight but absorb outgoing long-wave radiation and re-radiate part of it downward, like the glass of a greenhouse.
- The natural greenhouse effect keeps the surface at about +15 °C instead of −18 °C, keeping the heat budget of the Earth in a habitable balance.
- Adding more gases thickens the “blanket”: the planet must warm until outgoing radiation again equals incoming. This is the enhanced greenhouse effect.
- Charles David Keeling began continuous CO2 measurement at Mauna Loa in 1958; the rising Keeling Curve is the iconic record of human influence.
Greenhouse Gases
| Gas | Pre-industrial | 2024 | Main human sources | Warming power (GWP-100) |
|---|---|---|---|---|
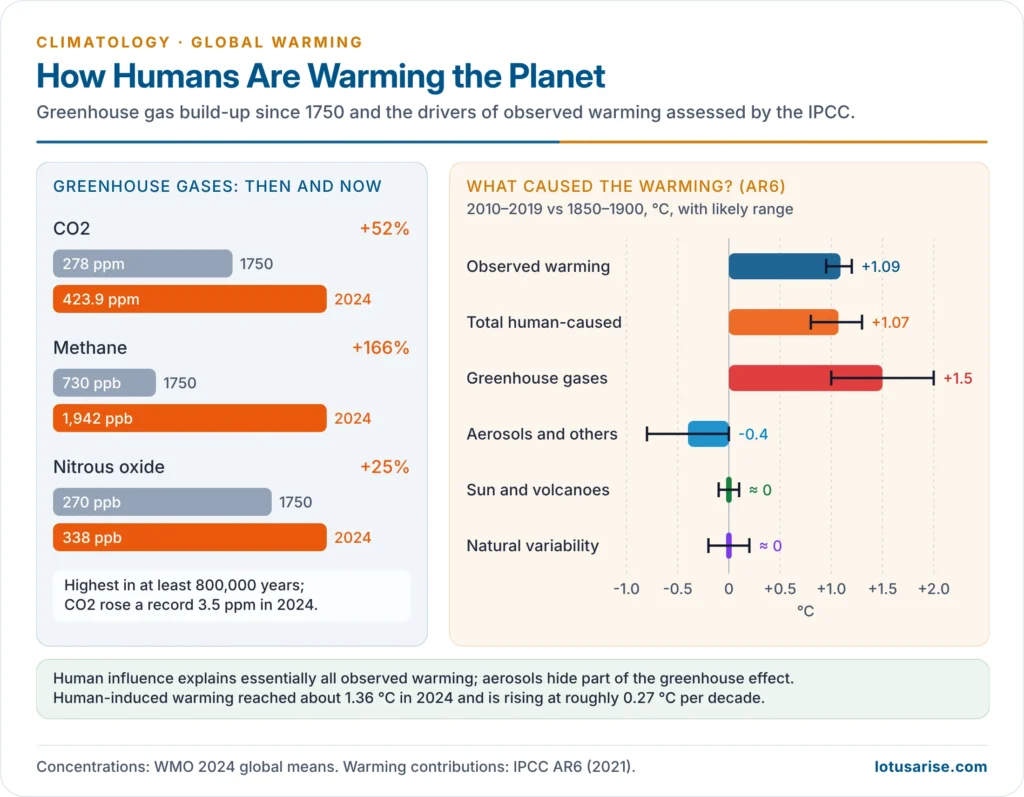
| Carbon dioxide (CO2) | ~278 ppm | 423.9 ppm | Coal, oil, gas, cement, deforestation | 1 |
| Methane (CH4) | ~730 ppb | 1,942 ppb | Livestock, rice paddies, landfills, coal mines, gas leaks | ~27–30 |
| Nitrous oxide (N2O) | ~270 ppb | 338 ppb | Nitrogen fertilisers, manure, industry | ~273 |
| Halocarbons (CFCs, HFCs) | Nil | Trace | Refrigerants, aerosols, foams | Hundreds to >10,000 |
| Tropospheric ozone | Lower | Higher | Formed from vehicle and industrial NOx and hydrocarbons | Short-lived |
- CO2 rose by a record 3.5 ppm from 2023 to 2024, to about 152% of its pre-industrial level, the highest in at least 800,000 years. Only about half of emitted CO2 stays in the air; oceans and land plants absorb the rest.
- Methane is short-lived (~12 years) but potent; it is responsible for roughly 0.5 °C of the present warming.
- CFCs both trap heat and destroy stratospheric ozone. They were phased out under the Montreal Protocol (1987); their HFC substitutes are being cut under the Kigali Amendment (2016).
- Water vapour is the largest greenhouse gas, but humans do not control it directly: it acts as a feedback, rising about 7% per °C of warming.
Aerosols and Land Use
- Aerosols from fossil fuels, biomass burning and dust:
- Sulphate aerosols cool the surface by reflecting sunlight and brightening clouds. This “global dimming” masked part of the warming between the 1950s and 1980s.
- Black carbon (soot) warms the air and darkens snow; the Atmospheric Brown Cloud over the Indo-Gangetic Plain hastens Himalayan glacier melt and alters monsoon rainfall.
- Land-use change:
- Deforestation (Amazon, Congo, South-East Asia) releases stored carbon and reduces evapotranspiration.
- Agriculture emits methane and N2O; urbanisation creates local heat islands.
- Large-scale irrigation in north-west India cools the land surface locally.
Attribution: Why Present Change Is Man-Made
- AR6 attribution (2010–2019 relative to 1850–1900):
- Total human-caused warming: ~1.07 °C (likely 0.8–1.3 °C), essentially all the observed 1.09 °C
- Greenhouse gases: +1.0 to +2.0 °C
- Aerosols and other human drivers: 0 to −0.8 °C
- Sun and volcanoes: about 0 °C
- Internal variability: ±0.2 °C
- Human-induced warming reached ~1.36 °C in 2024 and is rising at ~0.27 °C per decade; the remaining carbon budget for a 50% chance of 1.5 °C was only ~130 billion tonnes of CO2 at the start of 2025, about three years of current emissions.
- Fingerprints that rule out natural causes:
- The stratosphere is cooling while the troposphere warms. A brighter Sun would warm both.
- Nights and winters are warming faster than days and summers.
- The isotopic signature of atmospheric carbon shows a fossil origin.
- Solar output has been flat or falling since the 1950s.
- Natural factors still explain year-to-year swings (El Niño years such as 1998, 2016, 2023–24), but not the trend.
| Argument | Natural-causes view | Evidence today |
|---|---|---|
| Past climates changed without humans | Present warming may be another natural cycle | Present rate (~0.2 °C per decade) is unprecedented in at least 2,000 years |
| Orbital cycles | A new phase is under way | Orbital forcing now favours slow cooling |
| Solar activity | The Sun is brighter | Solar output has been flat since the 1950s |
| Volcanoes | Volcanoes emit CO2 | Volcanic CO2 is less than 1% of human emissions |
Impacts of Global Warming
Global Impacts
- Temperature and extremes:
- Land has warmed nearly twice as much as the ocean (1.59 °C vs 0.88 °C in 2011–2020).
- Heatwaves, heavy downpours and agricultural droughts have become more frequent and intense.
- Oceans:
- Over 90% of the extra heat goes into the oceans, whose heat content set new records each year to 2025.
- Ocean acidification, and mass coral bleaching (the fourth global event, declared in 2024)
- Cryosphere:
- glaciers retreating worldwide
- Arctic sea ice at or near record lows
- Greenland and Antarctic ice sheets losing mass
- permafrost thawing
- Sea level:
- rose ~0.20 m between 1901 and 2018, at 3.7 mm per year in 2006–2018 and accelerating, from thermal expansion and melting land ice
- threatens deltas and small islands (Maldives, Tuvalu, Bangladesh)
- Life and society:
- Species shifting poleward and upslope
- Crop-yield losses in the tropics
- Spread of vector-borne diseases (malaria, dengue) to new latitudes and altitudes
- Heat-related deaths
- Climate-driven migration
Why Impacts Differ from Place to Place
- The physical warming is uneven: high latitudes and land warm most, oceans least.
- Exposure and vulnerability differ more: poor, low-lying, farm-dependent societies with little adaptive capacity suffer most.
| Region | Main impact | Reason |
|---|---|---|
| Arctic | Warming ~3–4 times the global rate; sea-ice and permafrost loss | Ice–albedo feedback |
| Low-lying coasts and islands | Sea-level rise, storm surges, salinisation | Low elevation, dense population |
| Mountains (Himalaya, Andes, Alps) | Glacier retreat, GLOFs, then falling river flows | Elevation-dependent warming |
| Tropical and subtropical drylands | Hotter droughts, desertification, crop loss | Already near heat and water limits |
| Monsoon Asia and Africa | Erratic rains, more extreme downpours | Warmer air carries more moisture |
| Mid and high latitudes | Longer growing season, new shipping routes, but more extremes | Gains offset by heat and floods |
| Cities | Heat stress amplified by the urban heat island | Built surfaces, waste heat |
Impacts on India
- Temperature:
- India warmed by about 0.7 °C over 1901–2018.
- 2024 was India’s warmest year since 1901 (+0.65 °C above the 1991–2020 average).
- May 2024 brought 50.5 °C at Churu and long heatwaves across the north.
- Rainfall:
- The frequency of very heavy rain days (>150 mm) rose by ~75% over 1950–2015, while droughts became more frequent and widespread.
- The Indian monsoon is becoming more erratic: long dry spells broken by cloudbursts.
- Recent disasters: Wayanad landslides (July 2024); Himachal and Punjab floods (2025).
- Cryosphere:
- Himalayan glaciers lost mass about 65% faster in 2011–2020 than in the previous decade.
- The South Lhonak GLOF (October 2023) in Sikkim destroyed the Teesta-III dam.
- Sea and coasts:
- The North Indian Ocean rose ~3.3 mm per year (1993–2017).
- Severe post-monsoon tropical cyclones over the Arabian Sea have increased.
- Agriculture: the early heat of March 2022 cut wheat yields in Punjab and Haryana.
Response of Man
Mitigation and Adaptation
| Mitigation | Adaptation | |
|---|---|---|
| Aim | Reduce the cause: cut emissions, enlarge sinks | Reduce harm from change that cannot be avoided |
| Scale | Global benefit | Local benefit |
| Examples | Renewables, efficiency, electric mobility, afforestation, methane cuts, carbon pricing | Heat action plans, drought-tolerant seeds, cyclone shelters, flood zoning, mangroves |
| Indian examples | Solar and wind expansion, Green Hydrogen Mission (2023), Carbon Credit Trading Scheme (2023) | Ahmedabad Heat Action Plan (2013), Odisha’s cyclone preparedness, climate-resilient agriculture (NICRA) |
- Geoengineering (solar radiation management, carbon dioxide removal) is debated as a supplement, not a substitute.
The International Climate Regime
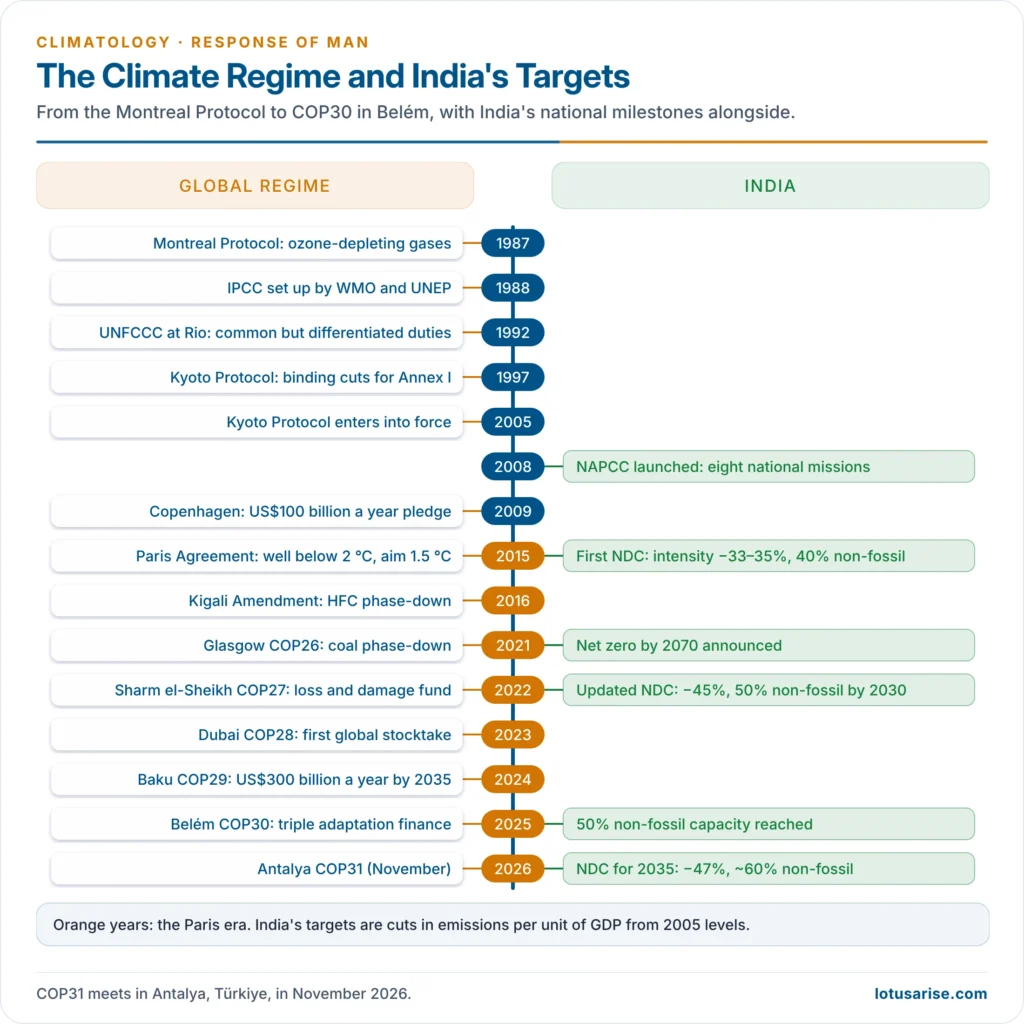
- IPCC (1988): set up by the WMO and UNEP to assess the science; six assessment reports (AR6 completed in 2023).
- UNFCCC (Rio, 1992; in force 1994): goal to stabilise greenhouse gases at a safe level, on the principle of Common But Differentiated Responsibilities and Respective Capabilities (CBDR-RC).
- Kyoto Protocol (1997; in force 2005):
- binding cuts for developed (Annex I) countries (~5% below 1990 in 2008–2012)
- Clean Development Mechanism, Joint Implementation, emissions trading
- weakened when the USA stayed out and large emerging emitters had no targets
- Paris Agreement (COP21, 2015; in force 2016):
- holds warming well below 2 °C, pursuing 1.5 °C
- every country submits Nationally Determined Contributions (NDCs), raised every five years
- a global stocktake
- Later COPs:
| COP | Year | Key outcome |
|---|---|---|
| COP26 Glasgow | 2021 | Coal “phase-down”; India announces net zero by 2070 (Panchamrit) |
| COP27 Sharm el-Sheikh | 2022 | Loss and Damage Fund agreed |
| COP28 Dubai | 2023 | First global stocktake: transition away from fossil fuels, triple renewables and double efficiency by 2030 |
| COP29 Baku | 2024 | New finance goal: US$300 billion a year by 2035 for developing countries |
| COP30 Belém | Nov 2025 | “Global Mutirão” decision: triple adaptation finance by 2035, 59 Belém Adaptation Indicators, a just transition mechanism; fossil-fuel roadmap left to the presidency; Tropical Forest Forever Facility launched |
- COP31 meets in Antalya, Türkiye, in November 2026, with Australia leading the negotiations.
India’s Response
- National Action Plan on Climate Change (NAPCC, 2008): eight national missions:
- Solar
- Enhanced Energy Efficiency
- Sustainable Habitat
- Water
- Sustaining the Himalayan Ecosystem
- Green India
- Sustainable Agriculture
- Strategic Knowledge for Climate Change
- States add State Action Plans on Climate Change.
- NDC targets:
| NDC | Emissions intensity of GDP (vs 2005) | Non-fossil share of power capacity | Extra carbon sink |
|---|---|---|---|
| 2015 (for 2030) | −33–35% | 40% | 2.5–3 billion t CO2e |
| 2022 update (for 2030) | −45% | 50% | 2.5–3 billion t CO2e |
| 2026 NDC (for 2035) | −47% | ~60% | 3.5–4.0 billion t CO2e |
- Progress: the 50% non-fossil capacity target was reached in mid-2025, five years early; emissions intensity fell about 36% between 2005 and 2020.
- Net zero by 2070, Mission LiFE (2022) for sustainable lifestyles, the International Solar Alliance (2015), the Green Credit Programme (2023) and the MISHTI mangrove programme.
- Equity stance:
- Per-capita emissions remain less than half the world average.
- India presses for climate finance, technology transfer and the developed world’s historical responsibility.
- Carbon neutrality (net zero) means balancing remaining emissions with removals. Bhutan, Suriname and Panama are already carbon-negative, absorbing more than they emit.
Evaluation
- Progress: Paris turned climate action universal, and renewables are now the cheapest new power in most countries.
- The gap:
- Emissions are still near record highs, and national pledges remain well short of a 1.5 °C pathway; the 1.5 °C limit is now likely to be crossed on a multi-decade average around the early 2030s.
- Finance falls short of developing-country needs.
- Adaptation and loss and damage have therefore moved to the centre of negotiations.
Previous Year Questions
2026Write an essay on disease and global warming according to the report of Intergovernmental Panel on Climate Change (IPCC).2024How is carbon neutrality essential for future environmental conservation? Describe the various efforts taken by nations in this regard.2022A rise in surface temperature brings severe consequences. Elaborate the potential changes and threats associated with it in the world.2022“Climate change is a serious problem for global food security and poverty eradication.” Critically examine.2021Explaining the concept of carbon neutrality, describe the measures taken by carbon positive and carbon negative nations.2020Climate change has unsettled the rhythm of seasons. Comment with examples and empirical evidence.2017“Climate change is a reality.” Explain with suitable examples.2016Give a reasoned account of how the impact of global warming differs from one part of the Earth to another.2011“Contemporary global climate change is an anthropogenic phenomenon.” Discuss.2009Discuss the consequences of Climate Change on agriculture and food security, and on the Coastal Zones of the world.2004How would the impact of global warming differ from one part of the earth to another?




