

- Climatic change is a long-term, statistically significant shift in the mean state or variability of climate, persisting for decades or longer. It differs from climatic variability (year-to-year swings such as a drought year) and from weather, which changes by the hour.
- Climate has never been static: the Earth has passed through greenhouse phases with no polar ice and icehouse phases with ice sheets reaching middle latitudes. We live in an interglacial (the Holocene) within the Quaternary Ice Age.
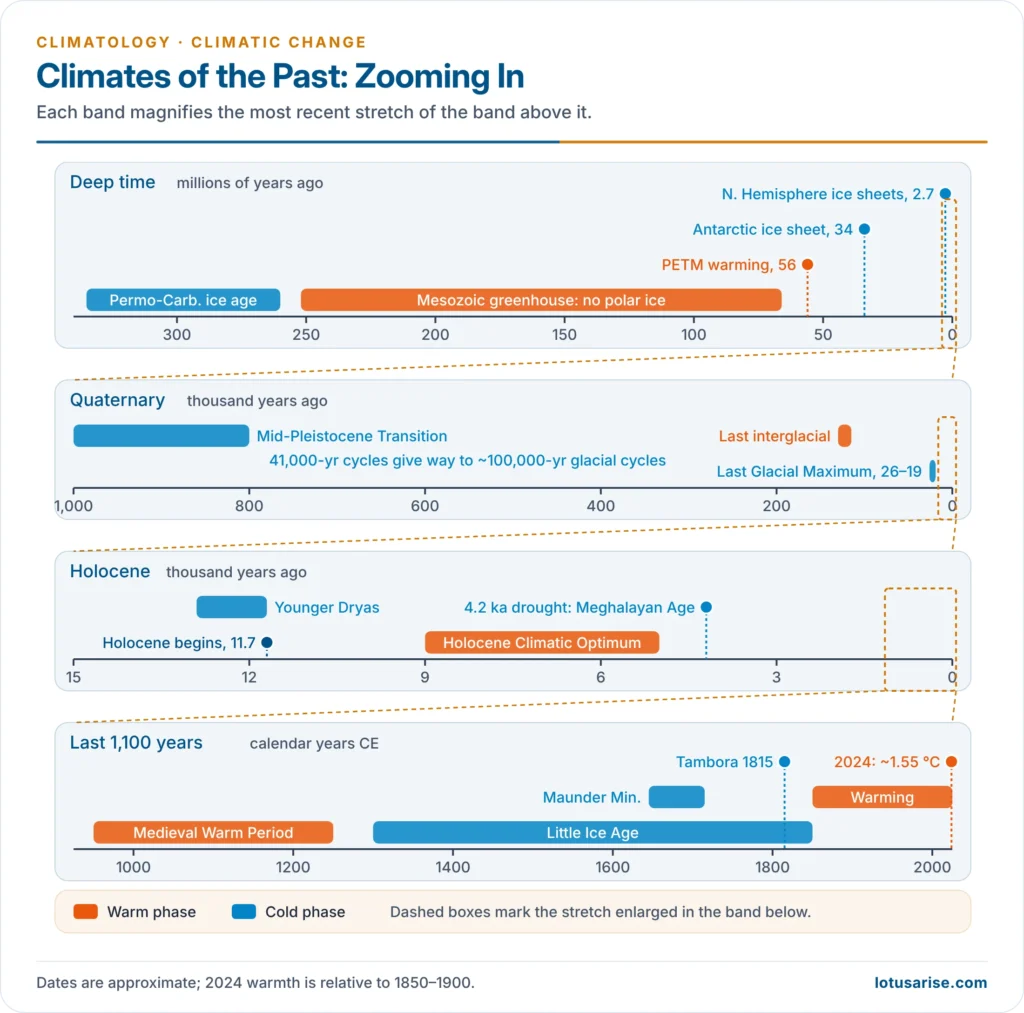
- The study of past climates is palaeoclimatology. It rests on instrumental records for the last ~170 years and on proxy evidence (ice, sediments, pollen, tree rings) for everything older.
- Causes are astronomical, solar, volcanic, atmospheric, tectonic and oceanic, amplified or damped by feedbacks. Human forcing now dominates present warming.
Evidence of Climatic Change

Instrumental and Historical Records
- Instruments: the thermometer and barometer date from the mid-17th century; homogeneous global temperature series begin around 1850.
- They show a warming from the 1830s to the 1930s, a pause in the mid-20th century, and rapid warming since the 1970s. 2015–2025 were the 11 warmest years on record.
- Historical documents: harvest dates, famine chronicles, ship logs, river freezing dates, and the levels of the Caspian Sea and Nile.
Proxy (Palaeoclimatic) Evidence
- A proxy is a natural record that responds to climate and can be dated.
| Proxy | What it records | Time reach | Resolution |
|---|---|---|---|
| Ice cores | Temperature from oxygen and hydrogen isotopes; past CO2 and CH4 in trapped air bubbles; volcanic ash and dust | ~800,000 years (EPICA Dome C); >1.2 million years (Beyond EPICA, 2025) | Annual to centuries |
| Marine sediments | δ18O in foraminifera shells records ice volume and ocean temperature | Tens of millions of years | Centuries to millennia |
| Pollen and peat bogs | Vegetation, hence temperature and rainfall | ~Last 100,000 years | Decades to centuries |
| Tree rings and lake varves | Ring width and density, or annual lake layers, record rainfall and summer warmth | ~Last 10,000 years | Annual |
| Corals and speleothems | Isotopes in coral bands and cave stalagmites record sea temperature and monsoon rainfall | Centuries to ~500,000 years | Annual to decadal |
| Landforms | Moraines, erratics, raised beaches, dry lake shorelines, fossil dunes | Millions of years | Coarse |
- Dating tools: radiocarbon dating (Willard Libby, 1949) for the last ~50,000 years; layer counting and uranium-series dating beyond.
- Pollen sequences: Axel Blytt (1876) and Rutger Sernander used Scandinavian peat bogs to define the post-glacial phases (Boreal, Atlantic, Sub-Boreal, Sub-Atlantic). The method was turned into quantitative pollen analysis by Lennart von Post (1916).
- Indian evidence:
- pollen in the salt lakes of Rajasthan (Sambhar, Didwana, Lunkaransar) shows a wetter Thar in the early and middle Holocene
- a stalagmite from the Mawmluh Cave, Meghalaya dates the global 4.2-thousand-year drought
- Kashmir Karewa lake beds record alternating glacial and interglacial phases
- Talchir tillites of Odisha are ice-age deposits about 300 million years old, now lying in the tropics
Climates of the Past
Before the Quaternary
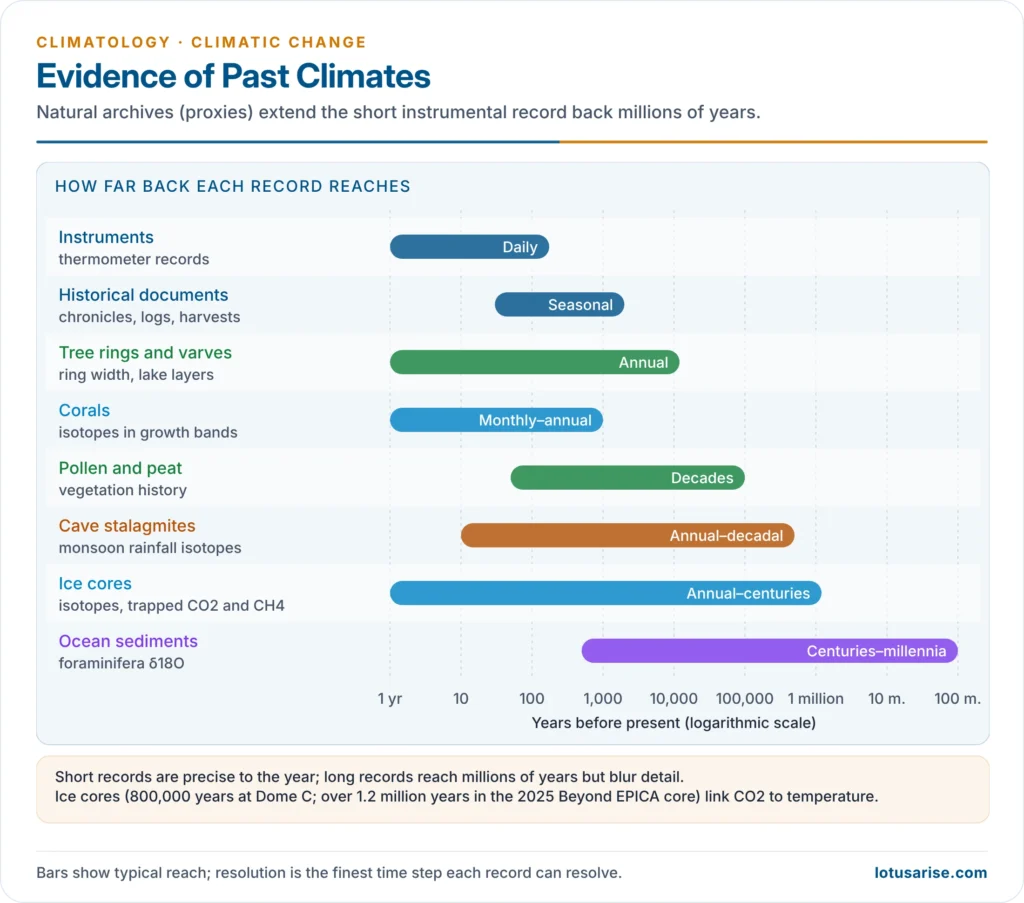
- Precambrian: near-global “Snowball Earth” glaciations (~720–635 million years ago).
- Permo-Carboniferous glaciation (~300 million years ago): ice covered southern Gondwanaland, leaving tillites in India, Africa, South America, Australia and Antarctica.
- Mesozoic: a long greenhouse world with no permanent polar ice.
- Cenozoic cooling:
- A sudden carbon-driven warming, the Palaeocene–Eocene Thermal Maximum, struck ~56 million years ago.
- The Antarctic ice sheet formed ~34 million years ago.
- Northern Hemisphere ice sheets grew from ~2.7 million years ago.
The Quaternary (Pleistocene) Ice Age
- The Quaternary began 2.58 million years ago. It is not one glaciation but dozens of glacial–interglacial cycles, read from the marine isotope record.
- Cycles lasted ~41,000 years until about a million years ago, then lengthened to ~100,000 years (the Mid-Pleistocene Transition).
- The classical Alpine scheme of four glaciations, Günz, Mindel, Riss and Würm, was set out by Albrecht Penck and Eduard Brückner (1901–1909). It survives as a regional label, but the ocean record shows many more cycles.
- Last Glacial Maximum (~26,000–19,000 years ago):
- Centres of ice:
- Laurentide ice sheet over Hudson Bay, burying Canada and the northern USA under ice up to ~3 km thick
- Cordilleran ice over the Rockies
- Scandinavian ice reaching Britain, Denmark and northern Germany
- Alpine ice cap
- Smaller ice caps on the Himalaya, Central Asia, the Andes and East African peaks
- Ice covered about a third of the land, against ~10% today; sea level was ~120–130 m lower, exposing land bridges such as Beringia and the shelf linking Sri Lanka to India.
- Global mean temperature was roughly 6 °C lower.
- Centres of ice:
- Pluvials: the subtropics were wetter during glacials as storm tracks shifted equatorward.
- The Great Basin lakes of North America (Lake Bonneville) expanded, and East African lake phases (Kafuan, Kamasian, Gamblian) were correlated with the Alpine stages.
- In India, glacials were drier and windier: Thar dunes were active and the monsoon weak.
The Holocene (Last 11,700 Years)
- Younger Dryas (~12,900–11,700 years ago): an abrupt return to near-glacial cold in the North Atlantic. It is linked to meltwater from Lake Agassiz weakening the Atlantic overturning circulation.
- Holocene Climatic Optimum (~9,000–5,000 years ago): warmer summers in the north and a stronger monsoon; the Sahara was green and Thar lakes were full.
- Post-glacial phases from peat bogs:
- a warm, moist Atlantic phase
- a drier Sub-Boreal, with long droughts
- a cooler, rainier Sub-Atlantic from about 500 BC, when bogs grew and lake villages flooded
- The 4.2-kiloyear event (~4,200 years ago): a multi-century drought from the Mediterranean to India. It defines the Meghalayan Age (ratified in 2018 from the Mawmluh stalagmite) and is linked to the decline of urban Harappan cities and of Old Kingdom Egypt.
Historical Times
- Medieval Warm Period / Medieval Climate Anomaly (~950–1250 CE):
- storm-free seas and Viking voyages; Greenland settled (~985 CE) and Iceland farmed
- 1200–1400 CE: floods, droughts, North Sea storms and expanding Arctic sea ice; the Norse Greenland colonies died out in the 15th century.
- Little Ice Age (~14th to mid-19th century, coldest in the 1600s):
- Alpine and Icelandic glaciers advanced to their furthest post-glacial positions around 1750 and the 1850s.
- The Thames froze (frost fairs).
- It coincides with the Maunder Minimum of sunspots (1645–1715) and clusters of large eruptions such as Tambora (1815).
- It was a cooling of well under 1 °C, uneven in space and time, not a global ice age.
- Since about 1850: glaciers have retreated worldwide; the slow natural recovery from the Little Ice Age has been overtaken by greenhouse warming.
Causes of Climatic Change
| Cause | Time scale | Mechanism | Example |
|---|---|---|---|
| Plate tectonics | 10–100 million years | Moves continents across latitudes, opens or closes ocean gateways, raises mountains | Permo-Carboniferous ice in India |
| Orbital (Milankovitch) cycles | 20,000–400,000 years | Redistribute sunlight by season and latitude | Pleistocene glacial cycles |
| Atmospheric composition | Decades to millions of years | Greenhouse gases change the heat trapped | Glacial CO2 at ~180 ppm |
| Ocean circulation | Decades to millennia | Redistributes heat between hemispheres | Younger Dryas |
| Solar variability | 11 years to centuries | Changes total solar output | Maunder Minimum |
| Volcanic eruptions | 1–3 years | Stratospheric sulphate aerosols reflect sunlight | Pinatubo 1991 |
Astronomical (Orbital) Theory
- Proponents: James Croll (1864–1875) first linked ice ages to the orbit. Milutin Milanković (1920–1941), a Serbian scientist, calculated the insolation changes in his Canon of Insolation (1941); Wladimir Köppen and Alfred Wegener (1924) used his curves for Alpine glaciations.
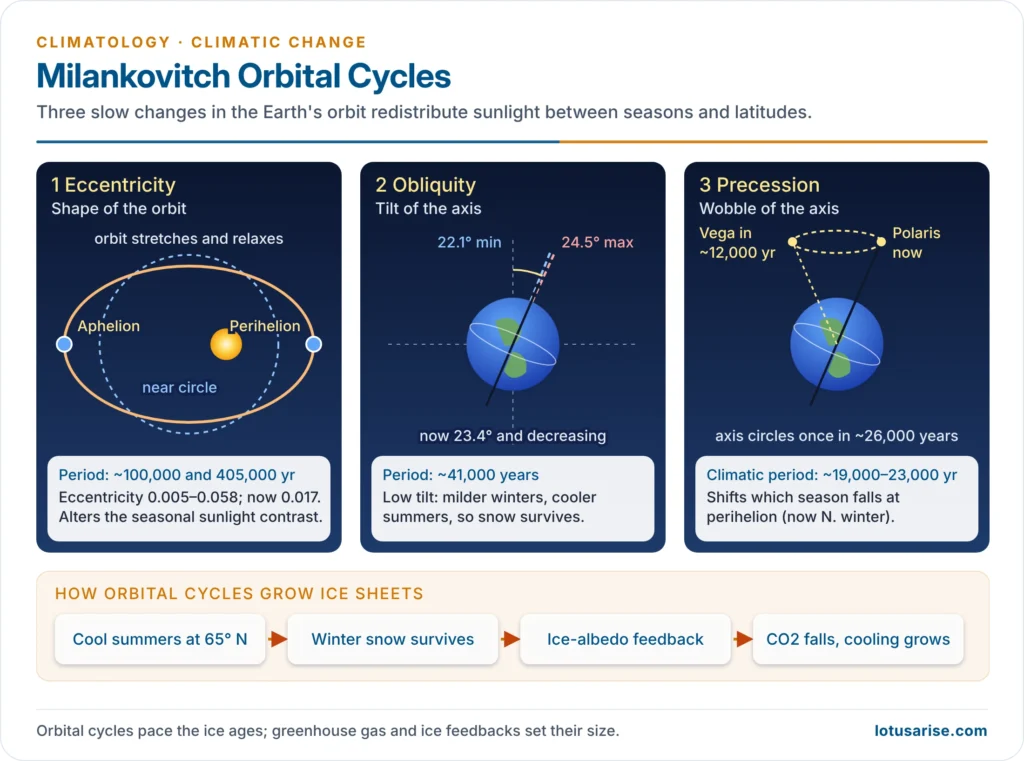
- Assumption: ice sheets grow when summers at about 65° N are cool, so that winter snow survives the summer. Total yearly sunlight matters less than its seasonal distribution.
- The three cycles:
- Eccentricity (~100,000 and ~405,000 years):
- The orbit changes from nearly circular to more elliptical. Today perihelion and aphelion differ by ~6–7% in sunlight; at maximum eccentricity by ~20–30%.
- Obliquity (~41,000 years):
- The axial tilt varies between 22.1° and 24.5°; it is now ~23.4° and decreasing.
- Lower tilt means milder winters and cooler summers: more snowfall in moist, mild winters and less summer melting, so ice sheets grow.
- Precession (~19,000–23,000 years for the climate effect):
- The axis wobbles like a top, completing one circuit in about 26,000 years; the pole star changes from Polaris to Vega about 12,000 years from now.
- The season that falls at perihelion shifts. Today the Northern Hemisphere has winter near perihelion (early January); in ~11,000 years it will have summer there, with hotter summers and colder winters.
- Eccentricity (~100,000 and ~405,000 years):
- Evidence: James Hays, John Imbrie and Nicholas Shackleton (1976) found the 100,000-, 41,000- and 23,000-year periodicities in deep-sea δ18O records and called the orbit the “pacemaker of the ice ages”. Ice cores later confirmed it.
- Criticism:
- Orbital changes in global annual insolation are tiny (<0.5%). They need feedbacks (ice albedo, CO2) to produce a 6 °C swing.
- The “100,000-year problem”: eccentricity is the weakest forcing yet dominates the last million years, and the Mid-Pleistocene Transition is not explained by the orbit alone.
- Current view: orbital cycles pace glaciations; CO2 and ice-albedo feedbacks set their size. Under present orbital conditions the next glaciation is not expected for tens of thousands of years, and fossil CO2 postpones it further.
Solar Variability
- Variable-sun theory: changes in the Sun’s output alter the energy received.
- Sunspots are intense magnetic storms on the photosphere. More sunspots mean a slightly brighter Sun overall, because bright faculae outweigh the dark spots.
- Cycles: the 11-year Schwabe cycle (Heinrich Schwabe, 1843) and the 22-year Hale magnetic cycle, with longer grand minima.
- Supporting evidence:
- The Maunder Minimum (1645–1715) overlaps the coldest part of the Little Ice Age.
- Small Alpine glacier advances over the last millennium correlate with solar lows.
- Criticism: satellite measurements since 1978 show total solar irradiance (~1,361 W/m²) varies only ~0.1% over a cycle. Solar output has not risen since the 1950s, while temperature has risen sharply. The IPCC attributes almost none of the warming since 1850–1900 to the Sun.
Volcanic Activity
- Mechanism: explosive eruptions inject sulphur dioxide into the stratosphere, where it forms sulphate aerosols that reflect sunlight. The surface cools for 1–3 years, while long-wave radiation passes the aerosols almost unhindered.
- Examples:
- Tambora (1815): 1816, the “Year Without a Summer”, with crop failures in Europe and New England
- Krakatoa (1883): red sunsets for two years
- Pinatubo (1991): global cooling of about 0.5 °C in 1992
- Toba (~74,000 years ago): the largest eruption of the Quaternary; its ash bed is found across peninsular India
- Criticism: the effect is short-lived. Clusters of eruptions can deepen cool spells such as the Little Ice Age but cannot sustain an ice age.
Changes in Atmospheric Composition
- Carbon dioxide theory:
- T. C. Chamberlin (1899) argued that changing CO2 drives world-wide climatic change, building on John Tyndall (1859) and Svante Arrhenius (1896).
- CO2 and water vapour are transparent to incoming short-wave radiation but absorb outgoing long-wave radiation, producing the greenhouse effect that keeps the planet’s heat budget in balance at a habitable temperature.
- The old criticism no longer holds:
- The objection that past CO2 “cannot be ascertained” has been answered by ice cores.
- They show CO2 at ~180–190 ppm in glacials and ~280 ppm in interglacials, moving in step with temperature over 800,000 years.
- In glacial cycles CO2 acts mainly as an amplifier of orbital forcing.
- Today: CO2 has risen to about 424 ppm (2024), far outside the ice-core range. Human emissions make atmospheric composition the dominant present cause of climatic change.
Plate Tectonics and Geographical Changes
- Continental drift:
- Alfred Wegener (1912–1915) explained glacial deposits in tropical India, Africa, South America and Australia by placing them together near the South Pole in Pangaea.
- The theory lacked a driving force until plate tectonics (1960s) supplied one; movement of a few centimetres a year explains only very long-term change, not glacial cycles.
- Geographical (topographic) theories:
- Uplift of continents and mountain building lowers temperature and changes winds and ocean currents.
- Ocean gateways:
- The opening Drake Passage isolated Antarctica inside a circumpolar current.
- Closing of the Isthmus of Panama (~3 million years ago) strengthened the Gulf Stream and moisture supply to northern ice sheets.
- Himalaya–Tibet uplift:
- It intensified the Indian monsoon.
- According to Maureen Raymo and William Ruddiman (1992), it drew down CO2 through enhanced chemical weathering, cooling the late Cenozoic.
Ocean Circulation and the AMOC
- The Atlantic Meridional Overturning Circulation (AMOC) carries warm surface water north (the Gulf Stream and North Atlantic Drift). There it cools, sinks and returns south at depth, moving about 1 petawatt of heat northward.
- It has switched abruptly in the past: meltwater pulses weakened it during the Younger Dryas and in Heinrich events of the last glacial.
- Current state:
- The IPCC (AR6, 2021) judged it very likely to weaken this century, with medium confidence of no abrupt collapse before 2100.
- Studies in 2025–2026 using extended model runs find eventual collapse after 2100 more likely under high emissions; the AMOC is now treated as a tipping element.
- Consequences of a collapse:
- sharp cooling of north-west Europe despite global warming
- southward shift of the ITCZ, weakening the Indian, East Asian and West African monsoons and drying the Sahel
- extra sea-level rise along the North American east coast
- weaker ocean uptake of CO2 and disrupted North Atlantic fisheries
Feedbacks and the Cryosphere
- Positive (amplifying) feedbacks:
- Ice–albedo:
- Snow and ice reflect up to 80–90% of sunlight, open ocean less than 10%.
- Melting exposes darker surfaces, which absorb more heat.
- This is the main reason the Arctic warms several times faster than the globe.
- Water vapour: warmer air holds ~7% more moisture per °C, and water vapour is itself a greenhouse gas.
- Carbon-cycle feedbacks: warmer oceans dissolve less CO2; permafrost (holding roughly twice the carbon now in the atmosphere) releases CO2 and methane; forests burn.
- Cloud feedback: slightly positive, the largest uncertainty in models.
- Ice–albedo:
- Negative (stabilising) feedbacks:
- Planck response: a warmer Earth radiates more.
- Faster chemical weathering removes CO2 over very long times.
- The cryosphere’s role in global climate:
- It controls the albedo of high latitudes and mountains.
- Ice sheets and glaciers hold ~69% of fresh water; their melt raises sea level (Greenland ~7 m, Antarctica ~58 m equivalent).
- Sea-ice formation makes dense, salty water that drives the thermohaline circulation.
- Permafrost stores carbon.
- Snow and glaciers regulate river flow: the Himalaya (the “Third Pole”) feeds the Indus, Ganga and Brahmaputra. Its glaciers lost mass 65% faster in 2011–2020 than in the previous decade.
Studying Climate Change Today
- The World Climate Research Programme (WCRP) was set up in 1980 by the WMO and the International Council for Science, joined by UNESCO’s IOC in 1993. It coordinates research on how predictable climate is and how far humans influence it.
- Core projects:
- CLIVAR: ocean–atmosphere variability (ENSO, monsoons)
- CliC: climate and cryosphere
- GEWEX: energy and water exchanges
- APARC (formerly SPARC): atmospheric processes, including the stratosphere and ozone
- ESMO: Earth system modelling and observations
- RIfS: regional climate information, including the CORDEX downscaling experiment, whose South Asia node is at IITM Pune
- WCRP’s Coupled Model Intercomparison Project (CMIP) supplies the model projections assessed by the IPCC.
Previous Year Questions
2026Discuss the potential consequences of the collapse of the Atlantic Meridional Overturning Circulation (AMOC) for the world.2016Discuss the significance of the World Climate Research Programme (WCRP) and its core projects in the understanding of climatic change.2012Impact of Cryosphere on global climate.2009Explain factors contributing to the Global Climate Change.




