

- Man’s relation with the natural environment is two-sided. People remain subject to natural controls and events, yet they have also become the dominant force in many of the Earth’s physical and biological systems.
- Over time the balance has shifted: man has become steadily more capable of altering the physical environment to suit himself.
- This is the central paradox of the man–environment relationship: the same species is both shaped by natural systems and reshaping them, at every scale from a field to the planet.
- Man has been a factor in environmental change for at least 40,000 years, since the late stages of the Pleistocene ice age, through hunting and the use of fire.
- The scale of impact has risen sharply since the Industrial Revolution, and most steeply since about 1950.
- Most alterations were meant to improve living conditions. Some have created long-term problems; others have been catastrophic, both for nature and for people.
- Human impact is now so large that many scientists describe the present as the Anthropocene, the age in which humanity acts as a geological and planetary force.
Scale and Drivers of Human Impact

Scale and scope of human impact
- Four pressures underlie most environmental change:
- Overpopulation: rising numbers drive resource extraction, habitat loss and waste generation, the root pressure behind most change.
- Pollution: chemical, biological and physical contaminants in air, water and soil, with cascading effects through ecosystems.
- Burning fossil fuels: releases stored carbon, raises atmospheric CO₂, and drives climate change, acid rain and urban smog.
- Deforestation: removes vegetation cover, triggers soil erosion, disrupts water cycles, reduces biodiversity and releases stored carbon.
- Consequences at the global scale: climate change, soil erosion, poor air quality and undrinkable water.
- These changes feed back on human behaviour itself, prompting migration and conflicts over clean water and arable land.
- The footprint today:
- About 75% of the land surface has been significantly altered, about 66% of the ocean faces cumulative impacts, and over 85% of the wetlands present in 1700 had been lost by 2000 (IPBES Global Assessment, 2019).
- Around 1 million species face extinction, many within decades.
- Monitored wildlife populations fell by an average of 73% between 1970 and 2020 (Living Planet Index, 2024).
- By weight, humans (36%) and livestock (60%) make up 96% of all mammals on Earth; wild mammals are only 4% (Yinon Bar-On and colleagues, 2018).
- Around 2020, the mass of human-made materials (concrete, metals, plastics, asphalt) came to equal the entire living biomass of the planet.
The Anthropocene
- The term was popularised by the atmospheric chemist Paul Crutzen and the ecologist Eugene Stoermer (2000), and set out by Crutzen in “Geology of mankind” (2002).
- It names a proposed new epoch following the Holocene, in which human activity rivals the great forces of nature in shaping the Earth system.
- Candidate start dates reflect different views of when human impact became global:
| Proposed start | Marker | Argument |
|---|---|---|
| About 8,000–5,000 years ago | Early farming, forest clearance, rice paddies | William Ruddiman’s (2003) early anthropogenic hypothesis: CO₂ and methane rose with agriculture |
| 1610 | “Orbis spike”: a dip in CO₂ | Simon Lewis and Mark Maslin (2015): depopulation of the Americas after European contact let forests regrow |
| About 1800 | Industrial Revolution, coal | Crutzen’s original suggestion: steam engine and fossil carbon |
| 1950s | Plutonium from nuclear tests, plastics, fly ash | The Great Acceleration; the formal proposal chose 1952 |
- Formal status:
- The Anthropocene Working Group proposed (October 2023) a base at 1952, marked by the rise in plutonium in the varved sediments of Crawford Lake, Ontario (Canada).
- The Subcommission on Quaternary Stratigraphy rejected the proposal, and the decision was confirmed in March 2024. The Anthropocene is therefore not a formal unit of the Geologic Time Scale.
- It remains a widely used informal concept for the age of human dominance.
The Great Acceleration
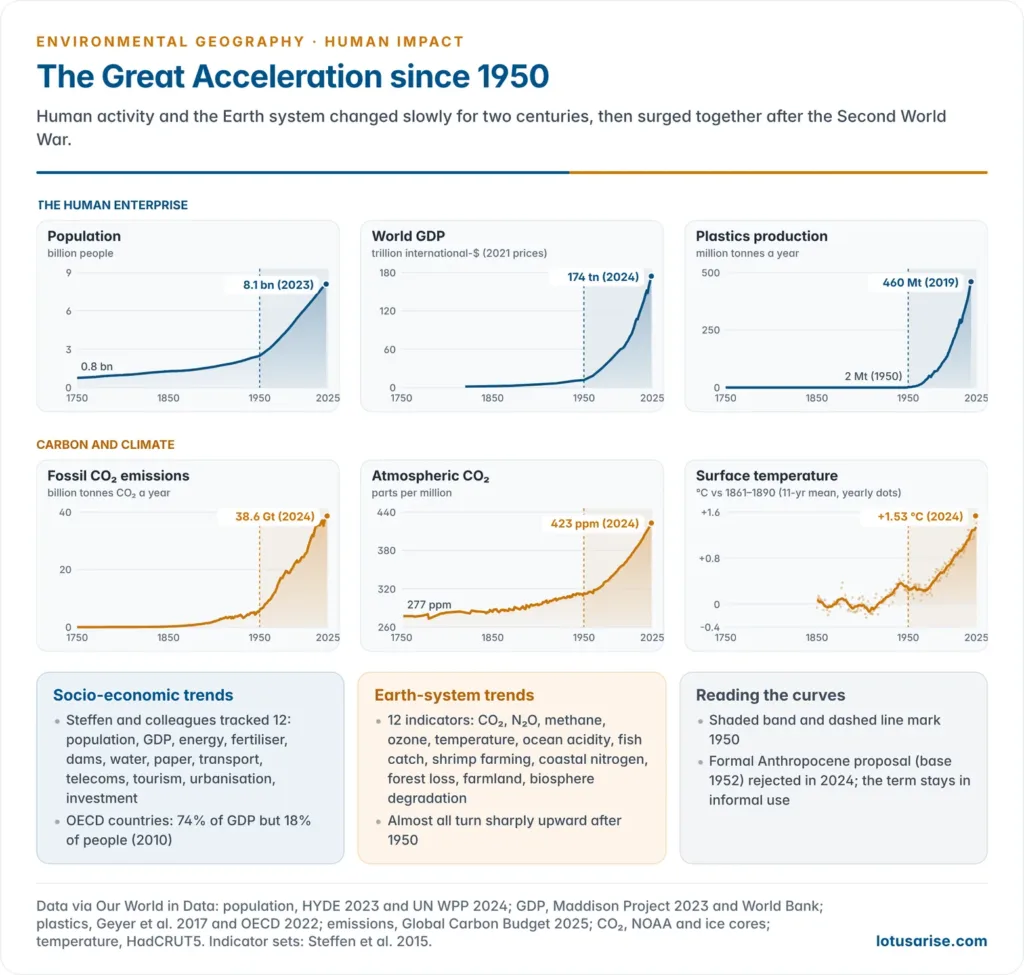
- Will Steffen and colleagues (2004, updated 2015) charted 24 indicators from 1750 to 2010:
- 12 socio-economic trends: population, real GDP, foreign direct investment, urban population, primary energy use, fertiliser consumption, large dams, water use, paper production, transportation, telecommunications and international tourism.
- 12 Earth-system trends: carbon dioxide, nitrous oxide, methane, stratospheric ozone, surface temperature, ocean acidification, marine fish capture, shrimp aquaculture, nitrogen to coastal zones, tropical forest loss, domesticated land and terrestrial biosphere degradation.
- Almost every curve is flat for two centuries and then turns sharply upward after about 1950. The term “Great Acceleration” captures this simultaneous, interlinked surge across the socio-economic and biophysical spheres.
- The equity question: humanity does not act as one. In 2010 the OECD countries held 74% of global GDP but only 18% of the population, so most of the imprint came from a wealthy minority.
- Since about 2000, much of the growth (vehicles, paper, fertiliser) has shifted to the emerging economies.
- Current data extend the curves:
- World population rose from about 2.5 billion (1950) to over 8 billion (passed on 15 November 2022).
- Fossil CO₂ emissions rose from about 6 billion tonnes (1950) to 38.6 billion tonnes (2024).
- Atmospheric CO₂ reached a global mean of 423.9 ppm in 2024, the record annual rise (3.5 ppm) since measurements began (WMO Greenhouse Gas Bulletin, 2025).
- Plastics output grew from about 2 million tonnes (1950) to about 460 million tonnes (2019).
Population growth and the environment
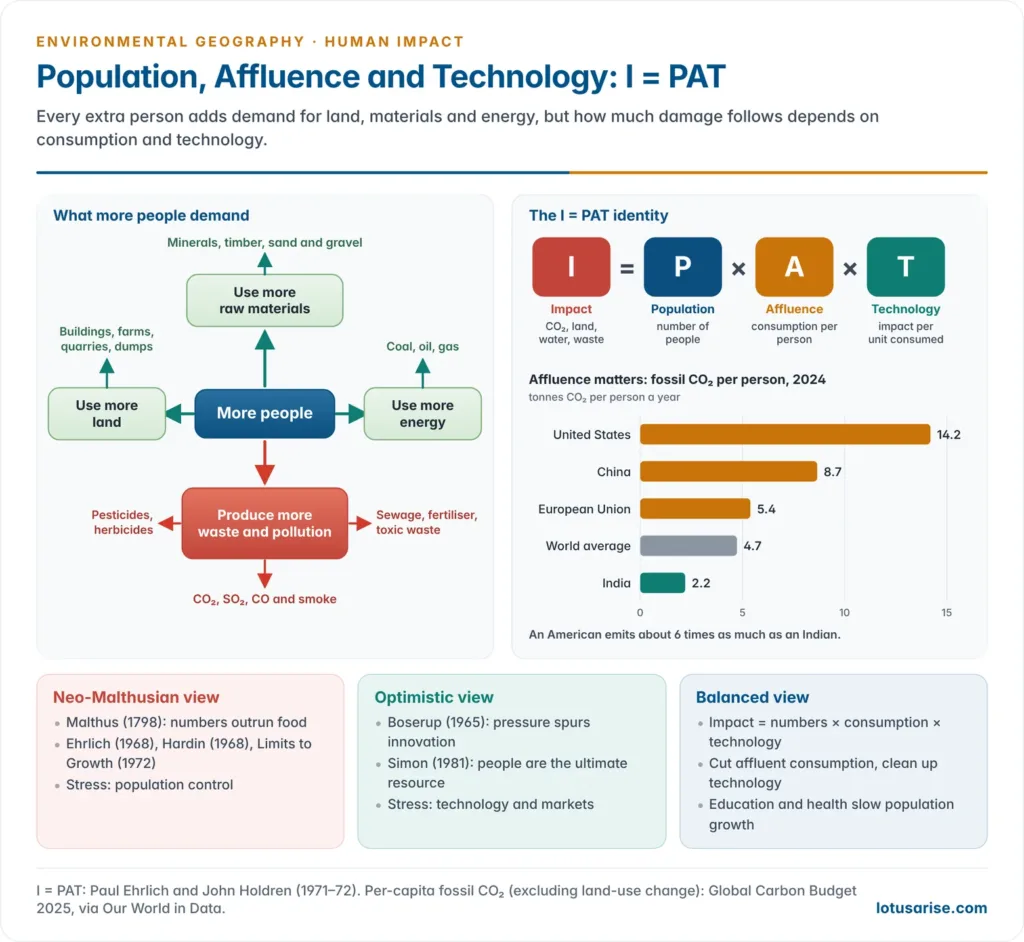
- More people means more demand on every part of the environment:
- they use more land for buildings, farms, quarries and dumps;
- they use more raw materials, chiefly minerals;
- they use more energy, mostly fossil fuels;
- they produce more waste and pollution: pesticides and herbicides, sewage, fertiliser and toxic waste, and CO₂, SO₂, CO and smoke.
- Thomas Robert Malthus (1798) argued that population grows geometrically while food grows arithmetically, so numbers must outrun resources until checked by famine, disease or “moral restraint”. Every later debate starts from this theory of population.
- Neo-Malthusian view:
- Paul Ehrlich‘s The Population Bomb (1968) predicted mass famine.
- Garrett Hardin (1968) showed how open-access resources are overused in the “tragedy of the commons”.
- The Limits to Growth model of Donella Meadows and colleagues (1972) projected overshoot and collapse within a century if growth continued.
- Optimistic counter-views:
- Ester Boserup (1965) argued that population pressure drives agricultural innovation and intensification.
- Julian Simon (The Ultimate Resource, 1981) held that human ingenuity makes people the ultimate resource. He won his 1980–1990 wager with Ehrlich on falling metal prices.
- Present trend: the UN’s World Population Prospects (2024) projects world population to peak at about 10.3 billion in the mid-2080s.
- India became the most populous country in 2023; its total fertility rate has fallen to 2.0 (NFHS-5, 2019–21), below replacement level.
I = PAT: population, affluence and technology
- The identity: I = P × A × T
- I = environmental impact (for example CO₂ emitted, land used, resources consumed);
- P = population;
- A = affluence, consumption per person (often GDP per capita);
- T = technology, impact per unit of consumption.
- Origin: Paul Ehrlich and John Holdren (1971) argued in “Impact of Population Growth” that population, affluence and technology all matter and interact. They wrote the formula as I = P × A × T in their 1972 critique of Barry Commoner.
- Commoner (The Closing Circle, 1971) blamed faulty post-war technology (synthetic chemicals, detergents, plastics) far more than population.
- Uses: IPAT separates the drivers and shows that cutting any one factor cuts impact. Halving T through clean technology can offset a doubling of A.
- Limitations:
- It is an accounting identity, not a causal model: the factors are not independent (affluence changes technology, and both change fertility).
- It treats humanity as an average and hides inequality between rich and poor consumers.
- It ignores institutions, prices and policy, which shape how people use resources.
- Later refinements include STIRPAT, a statistical version by Thomas Dietz and Eugene Rosa (1990s), and the Kaya identity of Yoichi Kaya, which breaks CO₂ emissions into population × GDP per person × energy per unit of GDP × CO₂ per unit of energy.
- Affluence often outweighs numbers:
- Fossil CO₂ per person in 2024 was about 14.2 t in the USA, 8.7 t in China, 5.4 t in the EU and 2.2 t in India, against a world average of 4.7 t.
- The richest 10% of humanity account for about half of consumption emissions, and the richest 1% for about 16% (Oxfam, 2023).
| Basis | Population control is the key | Population control alone is not enough |
|---|---|---|
| Core claim | Fewer people means less pressure on finite resources | Consumption and technology decide most of the impact |
| Evidence | Land and water stress in densely settled, fast-growing regions | High-consumption countries with slow growth emit most per head |
| Policy stress | Family planning, girls’ education, health | Sustainable consumption, clean technology, redistribution |
| Weakness | Blames the poor; ignores consumption | Numbers still multiply every per-capita impact |
- Balanced view: controlling population growth helps and is best achieved through education, health and women’s empowerment. On its own it is not a sustainable solution.
- It must be combined with lower per-capita consumption by the affluent and cleaner technology for all; IPAT itself shows why all three levers matter.
Consumerism and the “use and throw” culture
- “Use and throw” describes a throwaway economy in which goods are designed for short life, used briefly and discarded, instead of being repaired, reused or recycled.
- Life magazine celebrated “Throwaway Living” as modern convenience in 1955; by the 1960s critics such as Vance Packard (The Waste Makers, 1960) attacked it.
- Its forms:
- Planned obsolescence: products built to fail or to go out of fashion, a strategy openly proposed by Bernard London in 1932 to revive demand.
- Single-use plastics: packaging, cutlery, carry bags and sachets.
- Fast fashion: cheap clothes worn a few times. The equivalent of one garbage truck of textiles is landfilled or burnt every second (Ellen MacArthur Foundation, 2017).
- Short-lived electronics: phones and gadgets replaced every few years.
- Environmental cost:
- Plastic waste: about 353 million tonnes a year (2019), of which only about 9% was recycled, with about 22% mismanaged, much of it ending in rivers and the sea (OECD Global Plastics Outlook, 2022).
- E-waste: a record 62 million tonnes in 2022, of which only 22.3% was formally collected and recycled (Global E-waste Monitor, 2024). It carries lead, mercury and cadmium.
- Resources: global material extraction has more than tripled since 1970 to over 100 billion tonnes a year.
- Overshoot: in 2026 humanity used nature about 1.73 times faster than ecosystems regenerate; Earth Overshoot Day fell on 30 July (Global Footprint Network).
- Link with economic status:
- “Use and throw” rises with income. Affluent households and countries generate far more waste per head, so the ecological footprint tracks wealth more closely than numbers.
- Poorer households practise reuse and repair from necessity, and India’s informal kabadiwala and waste-picker network recovers much of what richer consumers discard.
- The burden is unequal: waste and e-waste flow to poorer neighbourhoods and countries, where informal recycling harms health.
- Rising middle classes in emerging economies now adopt the throwaway habit, so the problem spreads with growth.
- Responses:
- The circular economy (reduce, reuse, repair, recycle), extended producer responsibility (EPR) and right-to-repair rules.
- India: the ban on identified single-use plastic items (1 July 2022), EPR under the Plastic Waste Management Rules and the E-Waste (Management) Rules, 2022, and Mission LiFE (Lifestyle for Environment, 2022), which promotes mindful consumption.
- Critical view: the fault lies less in individual choice than in production systems and markets that reward disposability. Lasting change needs product design, pricing and regulation, not only awareness.
Human Impact by Sphere
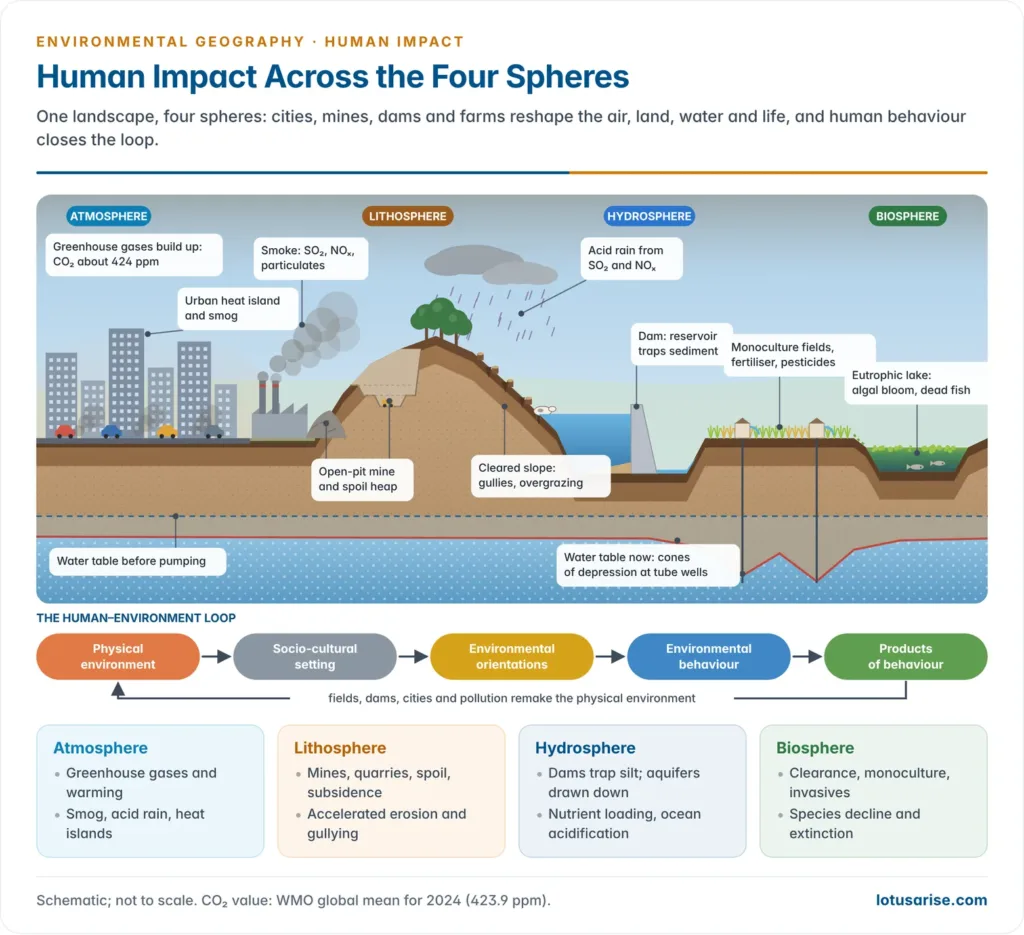
- Man’s impact covers three classical, interlocking domains: modification of landforms, of the atmosphere and of ecosystems.
- A fourth sphere, the hydrosphere, is now treated in its own right because of dams, groundwater depletion and ocean change.
- Human behaviour toward nature is itself a loop:
- the physical environment is filtered through the socio-cultural environment;
- this shapes environmental orientations (perceptions, attitudes and values), which guide environmental behaviour;
- its products (fields, dams, cities, pollution) remake the physical environment, and the loop begins again.
- How perception, attitude, value and emotion steer this loop is the basis of behavioural approaches to environmental management.
Modification of landforms (lithosphere)
- Mining and quarrying, deforestation, the introduction of exotic plants and animals, farm machinery, roads and tracks, and the overgrazing of pastures have, singly and together, profoundly altered landforms and accelerated erosion and deposition.
- The study of these changes is anthropogenic geomorphology.
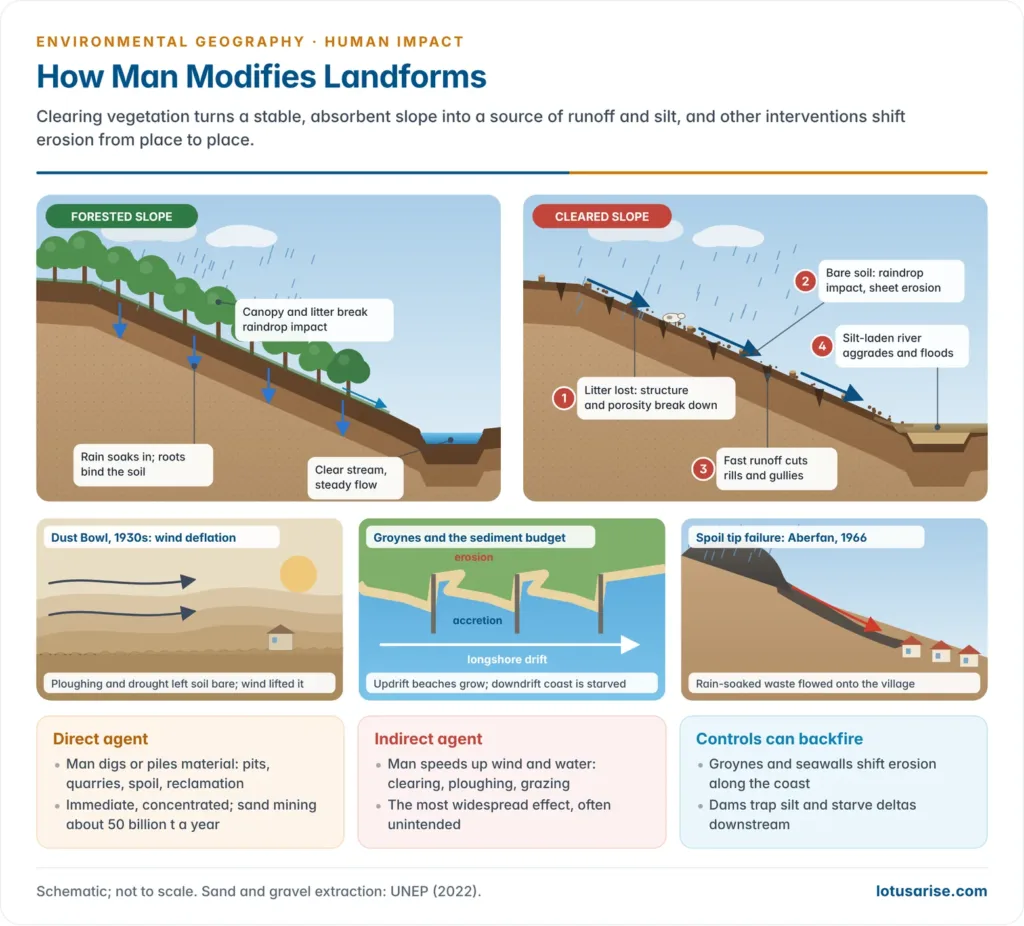
- Man acts in two modes:
- Direct agent: man excavates or piles up material himself (open-pit mines, quarries, land reclamation, waste heaps). The effect is immediate and spatially concentrated.
- Indirect agent: man makes natural processes (wind action, water erosion) speed up or slow down. This is by far the most widespread mode, and much of it happens accidentally, as a by-product of another purpose.
- Conscious attempts to control landform processes, such as coastal groynes or re-afforestation, are expensive and limited in extent.
Activities that modify landforms
- Mining and quarrying: excavation creates craters, tunnels and waste heaps.
- Deforestation: loss of forest cover accelerates sheet wash, rill formation and gully erosion on slopes.
- Exotic species: invasive plants and animals alter soil stability and vegetation structure.
- Farm machinery: heavy machines compact soils, destroy structure and increase runoff.
- Roads and tracks: cut through slopes, disrupt drainage and open new erosion pathways.
- Overgrazing: destroys protective vegetation, exposing bare soil to rain splash and wind deflation.
Direct alteration of landforms
- Man shapes landforms directly by excavating and piling up earth, reclaiming land from the sea, and causing subsidence through mining. These activities have multiplied since the Industrial Revolution with enormous machine power and explosives.
- Land scarification is the general term for disturbances made by extracting minerals: open-pit mines, quarries, and sand and gravel pits.
- Strip-mining removes whole layers of the surface to reach the minerals below. It destroys topsoil permanently, alters drainage and leaves barren, unstable land that is very hard to restore.
- Coal tips and other spoil heaps are as obvious as the pits themselves. Many are geomorphologically unstable.
- When saturated by heavy rain, spoil tips slide and flow, supplying sediment that clogs stream channels.
- At Aberfan (Wales) in 1966, a saturated colliery tip flowed onto a village school and killed 144 people, 116 of them children.
- Sand and gravel are now the most extracted solid materials on Earth, at about 50 billion tonnes a year. River-bed sand mining deepens channels, lowers water tables and undermines bridges.
- The environmental effects of large dams and mining are the largest direct alterations:
- Dams trap sediment and starve deltas downstream, and large reservoirs can induce earthquakes.
- Mining leaves pits, spoil and subsidence, as in the burning, sinking coalfields of Jharia.
| Human activity | Type of alteration | Landform effect | Example |
|---|---|---|---|
| Open-pit mining | Excavation (direct) | Pits, waste heaps, subsidence | Jharia coalfield, Jharkhand; Kudremukh iron ore |
| Strip-mining | Excavation (direct) | Topsoil destroyed, unstable terrain | Appalachian coalfields, USA; Wardha valley, India |
| Land reclamation | Filling (direct) | New land surfaces, altered coast | Mumbai’s reclaimed islands; Netherlands polders |
| Deforestation | Vegetation removal (indirect) | Accelerated erosion, rills and gullies | North-east India; Amazon Basin |
| Road construction | Slope cutting (direct and indirect) | Landslides, slope instability | Himalayan highways and debris flows |
| Overgrazing | Vegetation loss (indirect) | Compaction, deflation, desertification | Rajasthan; the Sahel |
Indirect effects: slopes and rivers
- The most important of all man’s effects on landforms come from his interference with natural vegetation, above all the clearing of forests for farming.
- There is a close link between vegetation cover and erosion rates on hillslopes, and hence the sediment in streams.
- A stable vegetation cover regulates natural erosion. It shields the ground from raindrop impact, absorbs part of the runoff and makes the slope more cohesive.
- When vegetation is removed, a chain of effects follows:
- Loss of protective plant litter: soil structure, cohesion and porosity break down.
- Bare soil exposed: raindrops strike unimpeded and sheet erosion begins.
- Runoff accelerates: overland flow cuts shoestring rills and gullies into hillsides.
- Sediment load rises: rivers receive excess material, so channels clog, flood and aggrade.
- Impact on rivers: changing infiltration and runoff on slopes affects rivers in two ways: it raises both discharge and sediment supply.
- Rivers then flood more often, carry more suspended load and deposit more in their lower reaches, silting reservoirs, damaging farmland and destroying aquatic habitats.
- Himalayan rivers:
- The Ganga, Kosi and Brahmaputra carry some of the heaviest sediment loads in the world. The Kosi, the “sorrow of Bihar”, shifts and aggrades its channel and floods catastrophically.
- Hill deforestation and road cutting add to these loads locally.
- Jack Ives and Bruno Messerli (The Himalayan Dilemma, 1989) showed that most of the sediment is natural, from tectonic uplift, steep slopes and monsoon storms. Blaming plains floods mainly on hill farmers’ tree-felling overstates the human share.
Wind deflation: the Dust Bowl
- The Dust Bowl of the Great Plains of the USA in the 1930s is the classic case of man-induced land erosion.
- The region was grassland on rich brown and chestnut soils. A great expansion of wheat in the early 1930s was followed by a run of droughts.
- Three causes combined:
- Overgrazing: cattle removed the native grass cover and exposed bare soil to the wind.
- Deep ploughing: it broke up soil aggregates and made them easy to deflate.
- Drought: prolonged dry years removed the soil moisture that held particles together.
- Result: soil largely exhausted of its natural fertility was blown hundreds of kilometres in “black blizzards”. Farms were abandoned and families (the “Okies“) migrated west to California.
- It led to the US Soil Conservation Service (1935) under Hugh Hammond Bennett.
- The Dust Bowl is not unique. In the marginal lands around today’s hot deserts, such as the Thar of India and Pakistan and the Egyptian desert, grazing animals initiate much of the deflation.
- Overgrazing in semi-arid margins is among the most consistent triggers of desertification worldwide.
Coastal erosion and deposition
- Man has little influence on waves, tides and currents, but he alters erosion and deposition at the shoreline by building structures and by removing beach material for ballast or construction.
- Groynes, breakwaters and seawalls are built to check marine erosion. They are costly to build and maintain, and they often defeat their own purpose: checking erosion in one place increases it elsewhere.
- The engineering paradox: groynes trap sand on their updrift side and starve the downdrift coast. The net loss can extend over a longer stretch of shore than the structure protects. This is the classic disruption of the coastal sediment budget.
- Chennai: the harbour breakwaters, built from the late nineteenth century, trapped the northward drift of sand. Marina Beach widened to the south, while the coast north of the harbour (Royapuram to Ennore) has eroded ever since.
- Chellanam near Kochi suffers severe erosion and sea surges, which seawalls have only partly checked.
Modification of the hydrosphere
- Dams and diversions regulate most of the world’s large rivers. They fragment river habitats, change flow and temperature, and trap sediment that deltas need.
- Groundwater depletion: India is the world’s largest user of groundwater, drawing about a quarter of the global total.
- In 2025, extraction stood at 60.63% of annual recharge nationally, but at 156% in Punjab, 147% in Rajasthan and 137% in Haryana; 10.8% of assessment units were over-exploited.
- Wetland loss and drainage for farms and cities remove natural flood buffers and filters.
- Pollution and nutrient loading: sewage, industrial effluent and farm runoff degrade rivers and lakes, and eutrophication turns lakes green.
- Ocean change: the ocean has absorbed about a quarter of human CO₂ emissions. Its surface pH has fallen by about 0.1, about a 30% rise in acidity, and overfishing and plastics add to the stress.
Modification of the atmosphere
- The global heat balance has changed over recent decades, and much of that change comes from human pollution of the atmosphere.
- Pollution has marked local effects and, increasingly, cumulative global effects.
- Three categories of man-made atmospheric change:
- introduction of pollutants, solids and gases not normally present;
- changes in the proportions of natural constituent gases;
- alterations of the surface that change the air above it.
Pollutants in the atmosphere
- To city-dwellers, pollution is the most obvious human effect on the atmosphere.
- Particulate matter: solid and liquid particles.
- Gases: sulphur dioxide (SO₂), nitrogen oxides (NO and NO₂, together NOₓ), carbon monoxide (CO) and hydrocarbons.
- Not all pollution comes from cities:
- Isolated industries leave a footprint of polluted air in the countryside downwind.
- Mining and quarrying throw large amounts of mineral dust into the air.
- Man-made forest and grass fires, and crop-residue and bonfire burning, add heavily to particulates in certain seasons.
| Type | Pollutant | Source | Reaction or effect |
|---|---|---|---|
| Primary | Sulphur dioxide (SO₂) | Coal combustion, smelting | Oxidises with water droplets to sulphuric acid; acid rain, corrosion |
| Primary | Nitrogen oxides (NOₓ) | Vehicles, power plants | With sunlight and hydrocarbons forms ozone and smog; nitric acid |
| Primary | Carbon monoxide (CO) | Incomplete combustion | Binds haemoglobin; cuts oxygen transport in blood |
| Primary | Hydrocarbons (VOCs) | Petrol, solvents, burning | Precursors of smog; some (benzene) carcinogenic |
| Primary | Particulate matter | Mining, construction, fires, combustion | Respiratory damage; reduced visibility; absorbs and scatters sunlight |
| Secondary | Sulphuric acid (H₂SO₄) | SO₂ + O₂ + H₂O | Acid rain; damages limestone buildings, forests, lakes |
| Secondary | Ground-level ozone (O₃) | Sunlight acting on NOₓ and hydrocarbons | Lung irritant; damages crops |
| Secondary | Peroxyacetyl nitrate (PAN) | Photochemical reactions | Eye irritant; toxic to plants |
- Photochemical smog is a double hazard: sunlight acting on nitrogen oxides and hydrocarbons produces ground-level ozone and PAN.
- Many pollutants irritate the eyes and endanger the respiratory system; they also damage plants and animals.
Changes in atmospheric gases
- Among the natural constituent gases, carbon dioxide and oxygen are the most critical, because both take part in the biochemical cycles between the air and the Earth’s surface.
- Nitrogen makes up about four-fifths of the atmosphere, but its chemical inertness keeps it out of this role.
- Oxygen and CO₂ were added to the early atmosphere by outgassing from the interior. Over geological time, plants removed CO₂ and stored it as coal and other fossil organic matter. Burning fossil fuels returns that carbon to the air in a few centuries.
- The CO₂ trajectory:
| Period | CO₂ concentration | Change |
|---|---|---|
| Pre-industrial (before about 1750) | About 278–280 ppm | Balanced by natural sinks (forests, oceans) |
| 1958 (start of Mauna Loa record) | About 315 ppm | Steady rise from coal and oil |
| 2024 | 423.9 ppm (global mean) | About 52% above pre-industrial; record yearly rise |
| Future | Depends on emissions | Over 500 ppm this century in high-emission pathways |
- The greenhouse effect: CO₂ absorbs long-wave (infrared) radiation, so more CO₂ warms the lower atmosphere. This is the core of man-made global warming: global surface temperature in 2024 was about 1.55 °C above 1850–1900, the first calendar year above 1.5 °C.
- Oxygen: burning fuel withdraws oxygen and turns it into CO₂ and water vapour. The decline is measurable but tiny, a few parts per million a year out of about 209,000. It poses no threat to breathing; its value is as a tracer of fossil-fuel burning.
- Water vapour: combustion and changes in vegetation alter it locally, but humans do not control its global amount.
- The air holds about 7% more water vapour for each 1 °C of warming, so water vapour acts as a feedback that amplifies CO₂ warming, not as an independent driver.
| Gas | Natural role | Human enhancement | Climate effect |
|---|---|---|---|
| CO₂ | Carbon cycle; taken up by plants and oceans | Fossil fuels, cement, deforestation | Absorbs long-wave radiation; main driver of warming |
| Methane (CH₄) | Wetlands, termites | Rice paddies, livestock, landfills, gas leaks | Strong, short-lived greenhouse gas |
| Nitrous oxide (N₂O) | Soil microbes | Nitrogen fertilisers, manure | Greenhouse gas; now the main ozone-depleting emission |
| Water vapour | Natural greenhouse gas | Little direct global effect | Amplifies warming (positive feedback) |
| Oxygen (O₂) | Respiration, oxidation | Consumed by combustion | Tiny decline; no climatic or health effect |
Alterations to the surface and microclimates
- Processes near the ground are highly sensitive to the character of the surface. Deforestation, farming and urbanisation therefore change the air above them:
- Evapotranspiration: clearing a forest sharply cuts transpiration, so less vapour returns to the air; local rainfall and regional water cycles change. Amazon forests recycle much of their own rain, and large-scale clearing risks drying the region.
- Urban heat islands: closely built cities stay several degrees warmer than the countryside, most of all on calm, clear nights. Concrete and asphalt absorb and store heat, and there is little vegetation to cool by evaporation.
- Wind: trees and hedges break the wind, reducing evaporation and changing CO₂ exchange near the ground. Removing windbreaks increases wind erosion and crop desiccation.
- Indian cities:
- Delhi shows a clear heat island, with the dense core much warmer than its rural fringe on summer nights.
- Bengaluru has replaced lakes and green cover with impervious surfaces; encroachment on lakes such as Bellandur and Ulsoor has cut evaporative cooling.
Modification of ecosystems (biosphere)
- With the beginnings of agriculture, man introduced far-reaching changes, obvious and subtle, into ecosystems. He gradually learnt how far to modify a system to harvest the crop he wanted. In doing so he has:
- simplified ecosystems, reducing species diversity to serve crop production;
- disrupted nutrient cycling, removing biomass without returning nutrients;
- introduced alien species, which may outcompete native plants and animals;
- eliminated native species through habitat destruction, hunting and pesticides;
- caused pollution through chemical inputs to soil and water.
- A historical blind spot: only recently have these consequences been widely recognised. Earlier, damage was treated as a necessary cost of progress.
Ecosystem simplification: the most general effect
- Man’s most general effect is to simplify ecosystems.
- His aim is to direct energy and materials toward himself so he can crop them easily. Species other than the crop are treated as weeds or pests and removed.
- Hence a reduction in species diversity, often to a single-species population, is the hallmark of human impact.
- Simplification also weakens stability. A diverse system has many pathways for energy and many checks on any one species; a simplified one has few, so a single shock spreads through it.
| Type of human use | Degree of simplification | Stability | Risk |
|---|---|---|---|
| Hunter-gatherers | Minimal; may add a trophic level | High: natural structure kept | Low |
| Shifting cultivation | Temporary; plot abandoned after a few years | Recovers if fallow is long | Low to moderate |
| Pastoralism | High: grassland turned to pasture | Moderate; depends on management | High: overgrazing, desertification |
| Monoculture agriculture | Extreme: one species over large areas | Very low | Very high: disease, pests, parasites |
| Plantation forestry | Extreme: one species, uniform age | Very low | Very high: pest outbreaks, soil decline |
- The monoculture trap: a single-species population, such as a field of wheat or a herd of cattle, gives disease, pests and parasites an easy path to spread.
- The Irish Potato Famine (1845–52) followed the attack of the water mould Phytophthora infestans on a genetically narrow potato crop. About a million people died and over a million emigrated.
Eutrophication
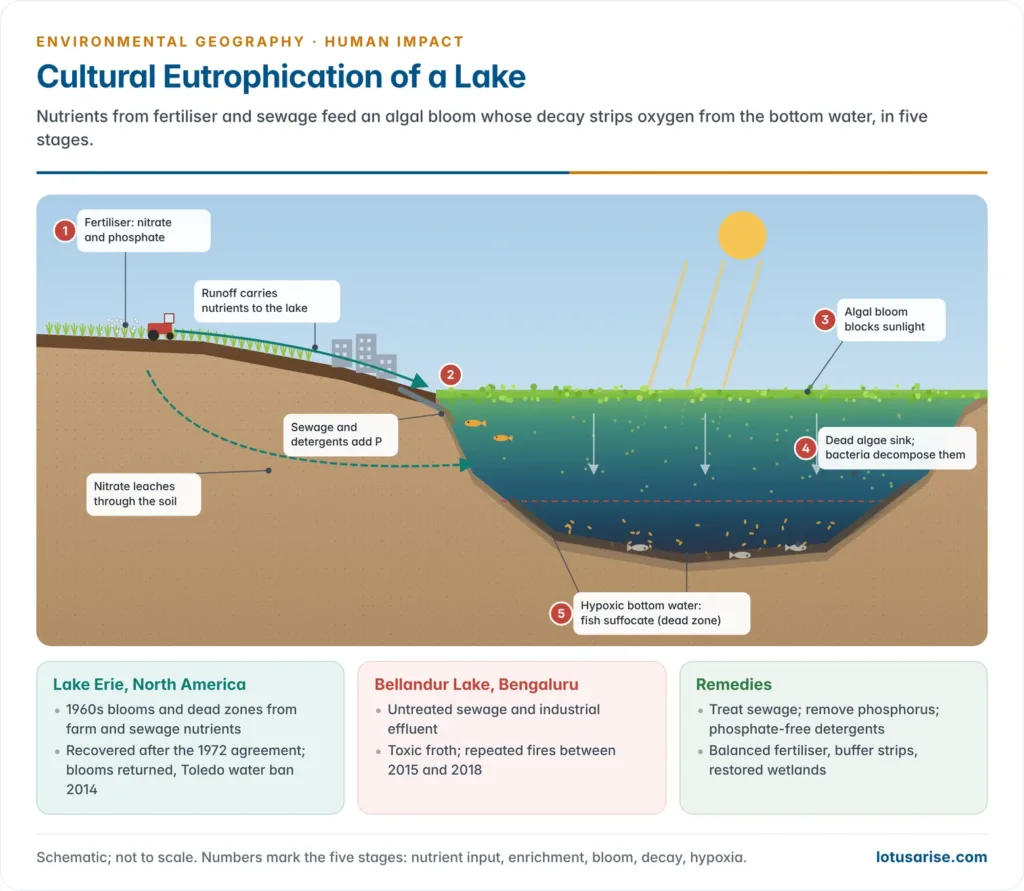
- When chemical fertilisers are applied, many of their elements are held by the soil in the clay–humus complex, but some ions are not. The most important is nitrate.
- Nitrate is added from fertilisers and nitrogen-fixing crops faster than denitrifying bacteria can break it down. Being soluble, it leaches into rivers and lakes.
- Phosphate, from fertiliser runoff, eroded soil, detergents and sewage, is usually the limiting nutrient in fresh water, so even small additions trigger growth.
- This nutrient enrichment and the rise in plant productivity it causes is eutrophication. Natural ageing of lakes is slow; the man-made form is called cultural eutrophication.
- It proceeds in five stages:
- Fertiliser application: excess nitrate and phosphate are not retained by the soil and leach into water.
- Nutrient enrichment: algae, phytoplankton and aquatic plants grow rapidly.
- Algal bloom: a dense green scum covers the surface and blocks sunlight from submerged plants, which die.
- Oxygen depletion: bacteria decompose the dead algae and use up dissolved oxygen.
- Hypoxia and anoxia: oxygen falls critically and fish and invertebrates suffocate, leaving a dead zone.
- Lake Erie (North America):
- In the 1960s, phosphorus and nitrogen from farm runoff and sewage caused massive blooms. Decaying organic matter covered large stretches of the shore, and dead zones formed in the deep water.
- The Great Lakes Water Quality Agreement (1972) cut phosphorus, and the lake recovered. Farm runoff has since revived the blooms: in 2014 toxic algae shut down the drinking water of Toledo for about half a million people.
- India:
- Bellandur Lake (Bengaluru), fed by untreated sewage and industrial effluent, produced toxic froth and repeatedly caught fire between 2015 and 2018.
- Dal Lake, Hussain Sagar and many urban tanks show the same signs.
- The wider dead zones in coastal seas, such as the Gulf of Mexico and the Baltic, arise the same way from river-borne nutrients.
Effects on individual species
- The extinction or decline of plant and animal populations is a familiar consequence of human impact.
- Species are endangered less by deliberate hunting than by the disruption and fragmentation of habitats.
- Large predators need an extensive area of specialised habitat to breed and hunt, so habitat fragmentation hits them hardest.
- The marsh harrier (Circus aeruginosus), a large raptor of reed beds and fens, lost much of its habitat to wetland drainage for farming; with persecution and pesticides, Britain’s population fell to a single breeding pair in 1971 before recovering.
- Alien species: accidental or deliberate introductions have often succeeded at the expense of native species, thanks to wide tolerance and high reproductive rates.
- Shrinking habitat also pushes animals into farms and villages, fuelling human–wildlife conflict.
| Mechanism | Process | Example |
|---|---|---|
| Habitat destruction | Removal of specialist habitat, especially wetland drainage and forest clearance | Marsh harrier; Great Indian Bustard (grassland conversion, power lines) |
| Habitat fragmentation | Continuous habitat split into patches too small for viable populations | Tiger corridors in central India; Asiatic lion confined to Gir |
| Invasive alien species | Introduced species outcompete natives | Lantana camara in Indian forests; water hyacinth in lakes; Nile perch in Lake Victoria |
| Hunting and poaching | Killing for food, sport or trade | Rhinos; Indian pangolin; tiger |
| Pesticides and drugs | Bioaccumulation and biomagnification up food chains | DDT thinning raptor eggshells; diclofenac killing over 95% of India’s Gyps vultures |
Signs of ecosystem imbalance
- Under natural conditions, ecosystems tend toward ecological equilibrium. Under growing human pressure their essential traits change, and signs of imbalance or declining efficiency appear:
- progressive devastation of once-fertile farm or grazing land by over-intensive use;
- fewer species where secondary forest replaces primary forest;
- a general loss of biological productivity;
- an increasing amount and geographic spread of pollution.
- Accumulated, these imbalances become global and regional ecological changes: by the 2023 assessment, six of the nine planetary boundaries had been crossed.
Human Impact by Activity
- Each stage of economy has added a new kind of impact; the changing balance between man and environment runs from small, local effects to planetary ones.
| Activity | Main impacts | Example |
|---|---|---|
| Hunting and fire | Megafaunal extinctions; fire-maintained grasslands | Late Pleistocene extinctions in Australia and the Americas |
| Agriculture | Forest clearance, erosion, salinisation, agrochemicals, groundwater depletion | Green Revolution in Punjab and Haryana |
| Pastoralism | Overgrazing, trampling, desertification | Sahel; western Rajasthan |
| Industry and mining | Air and water pollution, spoil, subsidence | Jharia; Vapi |
| Urbanisation | Sealed surfaces, heat islands, flooding, waste | Bengaluru lakes; Chennai floods |
| Transport | Emissions, fragmentation, roadkill | Highways through tiger corridors |
| Tourism | Waste, water stress, habitat disturbance | Himalayan treks; coastal resorts |
Hunting and fire
- Fire was the first tool with which humans transformed whole landscapes, clearing forest, driving game and keeping grasslands open.
- Paul S. Martin (1967) proposed the overkill hypothesis: the arrival of skilled hunters caused the late Pleistocene extinction of megafauna (mammoths, giant ground sloths, giant marsupials) in Australia and the Americas. Climate change probably acted together with hunting.
- Hunter-gatherers otherwise modified ecosystems little, often adding themselves as a top consumer without simplifying the system.
Agriculture and the Green Revolution
- Agriculture, beginning about 10,000–12,000 years ago, made the first lasting transformation of ecosystems. Today about half of the world’s habitable land is farmed, and farming is the leading cause of habitat loss.
- The nitrogen revolution: the Haber–Bosch process (Fritz Haber, 1909; industrialised by Carl Bosch, 1913) made synthetic fertiliser possible. It now feeds about half of humanity, but it has doubled the flow of reactive nitrogen, causing eutrophication and N₂O emissions.
- Modern agricultural technology, including high-yielding varieties (HYVs), fertilisers, pesticides, irrigation and machinery, raised output enormously but carries environmental costs:
- Soil: loss of organic matter, micronutrient deficiency, compaction, salinisation and waterlogging;
- Water: groundwater depletion and nitrate and pesticide pollution;
- Biodiversity: loss of traditional crop varieties and of farmland birds, insects and pollinators;
- Air: methane from paddy, N₂O from fertiliser and smoke from residue burning.
The Green Revolution in Punjab and Haryana
- The Green Revolution began in 1966–67 with Mexican dwarf wheat bred by Norman Borlaug, and was promoted in India by M. S. Swaminathan. Punjab, Haryana and western Uttar Pradesh, with assured canal and tube-well irrigation, led the change.
- Gains: India turned from food deficit to surplus; the region became the granary of the nation and the backbone of public grain procurement.
- Ecological costs:
- Groundwater:
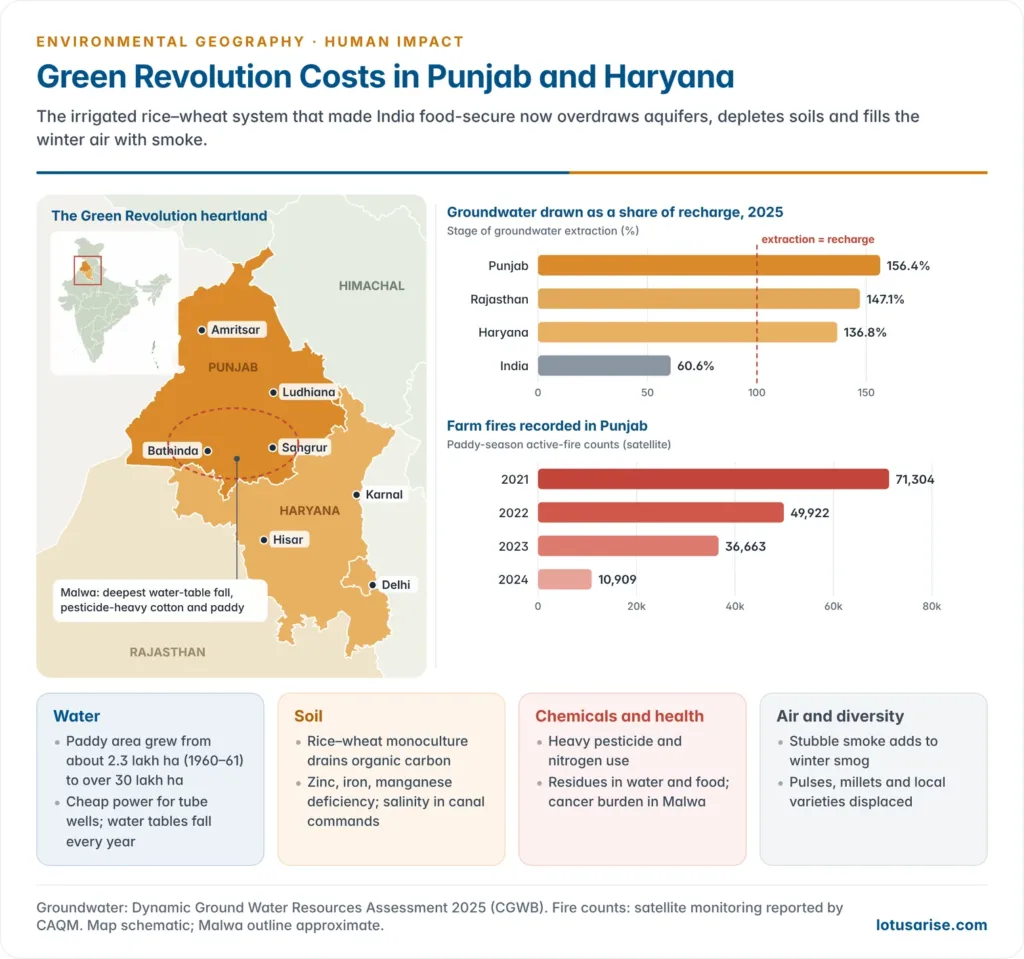
- Paddy, not native to the semi-arid north-west, spread from about 2.3 lakh ha in 1960–61 to over 30 lakh ha in Punjab.
- Free or cheap power for tube wells led to pumping far beyond recharge: 156% in Punjab and 137% in Haryana in 2025.
- Water tables in central Punjab fall year after year.
- Soil:
- The rice–wheat monoculture and heavy, nitrogen-biased use of fertiliser have depleted organic carbon and caused zinc, iron and manganese deficiency.
- Salinity and waterlogging affect canal commands in the south-west of Punjab and in Haryana.
- Agrochemicals and health:
- Punjab is among India’s heaviest users of pesticides per hectare. Residues have been found in water, food and breast milk.
- High cancer incidence in the Malwa region gave the Bathinda–Bikaner train the name “cancer train“.
- Air:
- Burning of paddy stubble in October–November, made worse by short sowing windows and combine harvesting, adds to the winter smog of the Indo-Gangetic Plain and Delhi.
- Recorded farm fires in Punjab fell from 71,304 (2021) to 10,909 (2024).
- Biodiversity: pulses, oilseeds, millets and maize gave way to two cereals, and hundreds of traditional rice and wheat varieties disappeared from fields.
- Groundwater:
- Responses:
- The Punjab and Haryana Preservation of Subsoil Water Acts (2009) delay paddy transplanting to the monsoon to cut pumping.
- Crop diversification, direct-seeded rice, the Happy Seeder and other in-situ residue management machines, and soil health cards.
- Calls for an “evergreen revolution” that raises yields without destroying the ecological basis of food production.
- Moving from the old model to sustainable farming is the core of Swaminathan’s evergreen idea: maximise production without destroying the ecological base on which it rests.
Pastoralism
- Grazing economies simplify grassland into pasture. Where herds exceed carrying capacity, overgrazing and trampling strip cover and compact soil, opening the way to wind erosion and desertification, as in the Sahel and western Rajasthan.
- Mobile pastoralism is often well adapted: herds move with the rains and spare pastures to recover.
- Damage usually follows when mobility is blocked by borders, sedentarisation, enclosure of commons or the loss of grazing land to farms. These ecological adaptations differ sharply from intensive, fenced ranching.
Industry and mining
- Industry concentrates pollution: smoke and gases over industrial towns, effluents in rivers, and solid and hazardous waste.
- Clusters such as Vapi and Ankleshwar (Gujarat) have long ranked among India’s most critically polluted areas.
- Mining removes vegetation and topsoil, leaves pits and spoil, lowers water tables, causes acid mine drainage and subsidence, and fouls the air with dust. Coal fires have burnt beneath Jharia for over a century.
Urbanisation
- More than half of humanity has lived in towns and cities since about 2008.
- India was 31% urban in 2011 and urbanising fast.
- Impacts:
- sealing of soil under concrete and asphalt;
- flash flooding, as rain runs off instead of soaking in;
- encroachment on lakes, wetlands and floodplains;
- heat islands;
- air pollution from traffic and construction;
- huge volumes of sewage and solid waste.
- Bengaluru lost much of its lake network to building; Chennai (2015) and other cities have flooded where drainage channels and wetlands were built over.
Transport
- Transport burns much of the world’s oil and produces about a fifth of energy-related CO₂, along with the NOₓ and particulates of urban smog.
- Linear infrastructure (highways, railways, canals and power lines) fragments habitats, blocks animal movement and kills wildlife on roads.
- Wildlife underpasses on national highways through central Indian tiger corridors are one remedy.
Tourism
- Tourism is one of the fastest-growing activities. International arrivals were about 1.4 billion in 2024, and tourism accounts for about 8% of global greenhouse gas emissions.
- Mass tourism concentrates people in fragile places: mountains, coasts, coral reefs and islands.
- It brings solid waste and sewage, water shortages, crowding, and disturbance to wildlife.
- Himalayan pilgrim towns and trekking routes, Goa’s beaches and the hill stations of the Western Ghats show the pressure. Joshimath (2023) showed how unplanned building strains mountain ecosystems.
- Well-managed ecotourism can instead fund conservation and local livelihoods.
Positive Effects and Critical Evaluation
Positive effects of human activities
- Not every human effect is harmful. Conservation, technological innovation and policy have begun to reverse some damage:
- Recycling and waste reduction: recycling paper, plastic and metal, and clearing litter from public spaces, cut pollution and the demand for raw materials.
- Ocean plastic clean-up: Boyan Slat conceived a device to sweep floating plastic from the sea as a teenager in 2011 and founded The Ocean Cleanup in 2013. It aims to remove 90% of floating ocean plastic by 2040, though stopping plastic at source matters more.
- Afforestation and re-greening:
- India’s National Afforestation Programme and Green India Mission;
- China’s Three-North Shelterbelt (the “Great Green Wall”, begun 1978) and Africa’s Great Green Wall across the Sahel;
- India’s pledge to restore 26 million ha of degraded land by 2030 under the Bonn Challenge.
- India’s forest and tree cover stood at 25.17% of its area in the India State of Forest Report 2023.
- Protected areas: tiger reserves, biosphere reserves and sanctuaries have let species recover. India’s tiger count rose to about 3,682 in 2022, the world’s largest wild population, and its tiger reserves now number more than 55.
- Renewable energy: in 2025 India reached 50% of its installed power capacity from non-fossil sources, five years ahead of its NDC target, and aims for 500 GW of non-fossil capacity by 2030.
- International policy:
- The Montreal Protocol (1987), the first treaty ratified by every country, has put the ozone layer on course to recover to 1980 levels by about 2066 over Antarctica.
- The Paris Agreement (2015) commits nearly every country to hold warming well below 2 °C and pursue efforts to limit it to 1.5 °C.
- Traditional practices also show positive human influence: sacred groves, the Bishnoi protection of trees and blackbuck, and terraced and water-harvesting landscapes sustain biodiversity and soil.
Critical evaluation
- Human impact is not new, but its rate and scale are. People have always altered their environment; what is unprecedented since 1950 is the speed and global reach of change.
- “Man” is not one agent.
- The Anthropocene language can hide that a wealthy minority drives most of the impact while the poor bear much of the harm.
- Critics such as Andreas Malm and Jason W. Moore, drawing on the Marxian view of nature, prefer “Capitalocene“, blaming an economic system rather than the species.
- Neither doom nor complacency fits the evidence.
- Neo-Malthusian forecasts of mass famine did not come true, partly because of the Green Revolution, which created new ecological debts.
- Technological optimism must reckon with overshoot, biodiversity loss and climate change.
- The way forward lies in sustainable development: decoupling well-being from resource use, cutting the consumption of the affluent, clean technology, and restoring degraded ecosystems. Above all, human use must stay within the carrying capacity of the environment that sustains it.
Previous Year Questions
2026“Anthropogenic impacts have caused major global and regional changes and imbalances in ecosystem.” Elucidate with examples.2020Compare and contrast the Malthusian and Neo-Malthusian perspectives in the context of population growth, resource use, and environmental impact.2018“Controlling population growth is the sustainable solution to environmental problems.” Express your views with suitable arguments.2016Write a critical note on the tendency of “use and throw” in the context of economic status and environment.2016“India has paid heavily for achievement of Green Revolution in the form of economic, social and ecological cost.” Discuss.1998Examine the impact of advanced agricultural technology on environment. Support your answer with examples.1995‘Man must realize the importance of maximizing agricultural production without destroying the ecological basis on which our entire food production systems rest’. Explain with examples.1992Define ecosystem and describe briefly its various components. Also discuss how and to what extent the modern man has affected the various types of ecosystems.1988Discuss, in detail, man’s impact on ecosystem as a result of the modern technological advancement.





BEST
thank u so much…