

- The biosphere has entered what many scientists call the Anthropocene: an age in which human activity has become the dominant force shaping Earth’s physical, chemical and biological systems.
- The term was popularised by Paul Crutzen and Eugene Stoermer (2000). In March 2024 the stratigraphers’ Subcommission on Quaternary Stratigraphy voted not to make it a formal epoch, but it remains the standard shorthand for a human-dominated planet.
- Climate is warming, wildlife populations are shrinking, pollution reaches every ecosystem, and societies face new risks from sea-level rise, disease, food insecurity and climate extremes.
- These shifts work at two scales:
- Global changes alter Earth-system processes everywhere at once: the climate, the ozone layer, ocean chemistry and the nitrogen cycle.
- Regional changes are concentrated in particular places, such as a drying lake, a deforested basin or a degraded dryland, but add up to global significance.
- When such changes push an ecosystem beyond its capacity to absorb them, the result is an ecological imbalance.
Ecological Change and Imbalance: Concept and Drivers

Ecological balance and imbalance
- Ecological balance is the state of dynamic equilibrium among the living and non-living components of an ecosystem. Populations, energy flow and nutrient cycles stay within a stable range, and change slowly, through processes such as succession.
- It is maintained by self-regulation: the feedback, homeostasis and resilience that keep an ecosystem’s structure and functions within bounds.
- Ecological imbalance is the disruption of this equilibrium when a disturbance exceeds the system’s ability to absorb it.
- The usual drivers are industrialisation, irrational resource use, deforestation, overexploitation and pollution.
- The result is a new, usually less productive and less diverse state: a forest becomes scrub, a lake becomes a salt flat, a clear lake turns eutrophic.
- Ecological change is the broader term: any shift in the composition, structure or functioning of ecosystems. Change becomes imbalance when it is rapid, large and self-reinforcing, and when the system can no longer recover on a human timescale.
- Billie Lee Turner II and colleagues (1990) distinguished two kinds of global environmental change:
| Basis | Systemic change | Cumulative change |
|---|---|---|
| Nature | Alters a globally connected system | Local changes repeated across the world |
| How it acts | An emission anywhere affects everyone | Each case is local; the sum is global |
| Examples | Greenhouse gases, ozone depletion, ocean acidification | Deforestation, desertification, wetland loss, groundwater depletion, species loss |
| Management | International treaties | Regional and national action, coordinated globally |
Global environmental change as a science
- Global environmental change science is highly multidisciplinary. It joins physical scientists who study the climate, oceans, atmosphere and geology with biologists who study physiology, evolution and ecology.
- Its drivers work across scales: from the physiology of individual organisms to population dynamics, community structure and whole-ecosystem functioning.
- Peter Vitousek (1994) identified three components of global change that are certain:
- rising atmospheric CO₂;
- alteration of the global nitrogen cycle;
- ongoing land use and land cover change.
- These, he argued, drive the further changes of biodiversity loss and biological invasions, and they act together.
- Earth-system research programmes of the International Council for Science (ICSU) built on this agenda:
- the World Climate Research Programme (1980, with the World Meteorological Organization), the International Geosphere-Biosphere Programme (1987–2015), DIVERSITAS (1991) on biodiversity, and the International Human Dimensions Programme on society;
- they joined in the Earth System Science Partnership (2001), which treated the Earth as a single self-regulating system, and were folded into Future Earth after Rio+20 (2012). ICSU became part of the International Science Council in 2018.
- Three changes long stood out as the most critical global ecological changes: ozone depletion, global warming and loss of biodiversity. They form an interlocking crisis, each reinforcing the others through feedbacks. The planetary boundaries framework widens this list to nine processes.
Planetary boundaries
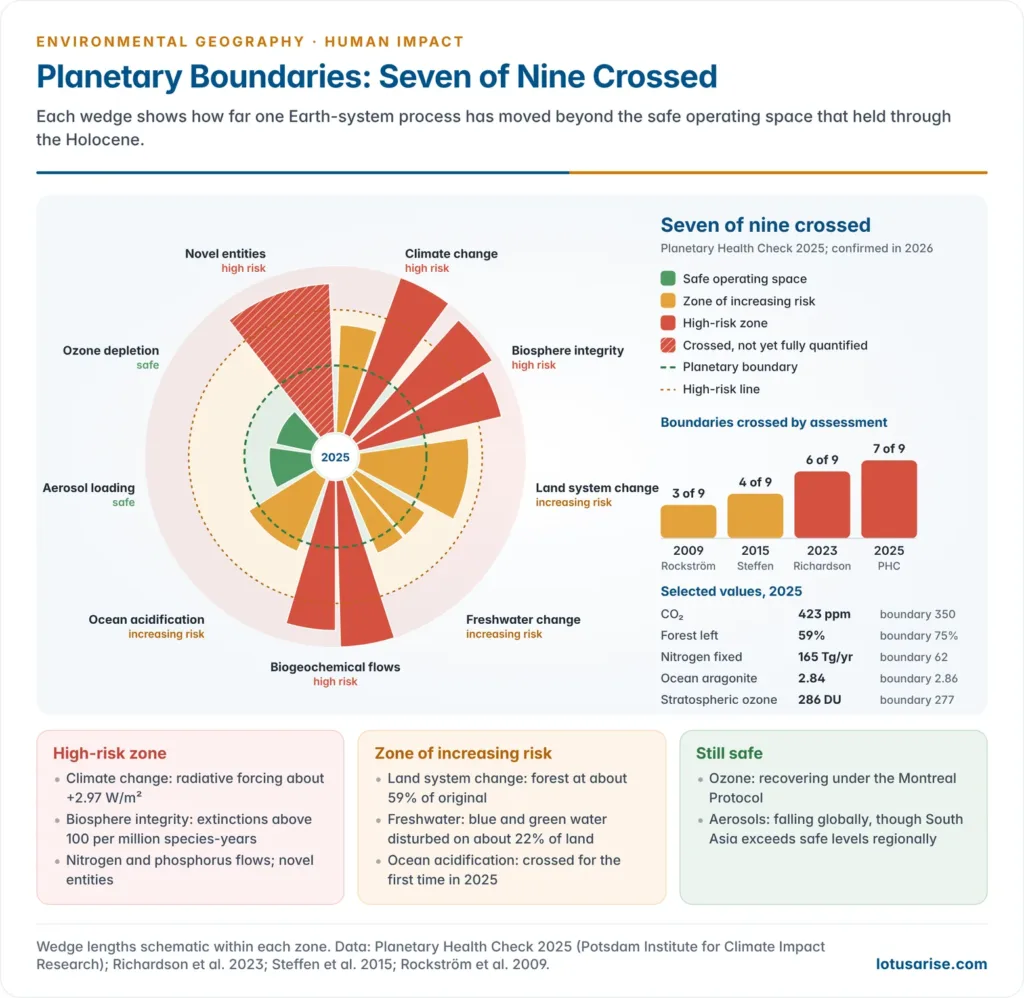
- The planetary boundaries framework of Johan Rockström and colleagues (2009) defines a “safe operating space for humanity”. It sets limits for the nine Earth-system processes that kept the planet in the stable state of the Holocene (the last about 11,700 years).
- It was updated by Will Steffen and colleagues (2015). Katherine Richardson and colleagues (2023) quantified all nine for the first time and found six of nine transgressed.
- The Planetary Health Check 2025 (Potsdam Institute for Climate Impact Research, September 2025) found seven of nine crossed: ocean acidification was judged transgressed for the first time. The 2026 check (September 2026) again found seven of nine crossed, all with worsening trends.
- Zones: within the boundary lies the safe operating space; beyond it the zone of increasing risk; and beyond a second line the high-risk zone, where irreversible shifts become likely.
| Boundary | Control variable | Boundary | Status (2025) | Zone |
|---|---|---|---|---|
| Climate change | Atmospheric CO₂; radiative forcing | 350 ppm; +1 W/m² | 423 ppm; +2.97 W/m² | High risk |
| Biosphere integrity | Extinction rate; human use of plant production (HANPP) | 10 E/MSY; 10% | Over 100 E/MSY; 30% | High risk |
| Land system change | Forest left, share of original | 75% | About 59% | Increasing risk |
| Freshwater change | Area with disturbed streamflow (blue) and soil moisture (green) | 12.9%; 12.4% | 22.6%; 22.0% | Increasing risk |
| Biogeochemical flows | Nitrogen fixed for farming; phosphorus applied | 62 Tg N/yr; 6.2 Tg P/yr | 165 Tg N/yr; 18.2 Tg P/yr | High risk |
| Ocean acidification | Surface aragonite saturation | 2.86 | 2.84 | Increasing risk (crossed 2025) |
| Novel entities | Synthetic chemicals released untested | 0% | Transgressed | High risk |
| Aerosol loading | Inter-hemispheric aerosol difference | 0.10 | 0.063 | Safe |
| Ozone depletion | Stratospheric ozone | About 277 DU | About 286 DU | Safe |
- Why it matters: the processes interact (forest loss weakens the carbon sink; warming and acidification together stress corals), and the two boundaries still safe are those where the world acted collectively: the Montreal Protocol and air-quality rules.
- Criticism:
- Global averages hide regional thresholds; South Asia, for example, breaches safe aerosol levels regionally.
- Some boundaries (novel entities, biosphere integrity) are hard to quantify.
- The framework says little about who is responsible. Kate Raworth’s “doughnut” adds a social foundation beneath the ecological ceiling, so equity and limits are read together.
Drivers of global ecological change
- The drivers fall into four groups: population and consumption, energy use, land use change and pollution. All are tied to the scale of human numbers and of economic activity.
Population and consumption
- About 8.2 billion people lived on Earth in 2024. The UN’s World Population Prospects 2024 projects about 9.7 billion by 2050 and a peak of about 10.3 billion in the mid-2080s, followed by a slight decline.
- Numbers alone do not decide impact. Affluence (consumption per person) and technology (impact per unit of consumption) matter as much.
- The I = P × A × T identity of Paul Ehrlich and John Holdren (1971) captures this: the influence of man on ecology grows with consumption and technology as much as with headcount.
- This is why the USA, with far fewer people than China or India, long had a larger impact: high A and T multiply the effect of each person.
- Joel E. Cohen (1995) noted that between 1860 and 1991 the world’s population roughly quadrupled while use of inanimate energy rose about 93-fold. Rising consumption, not population alone, drove energy demand.
- India, China and the USA compared:
- China overtook the USA as the largest CO₂ emitter around 2006, through rapid industrial growth and rising affluence rather than population growth.
- India is now the third-largest emitter by total volume, yet its per capita emissions (about 2 t CO₂) are a fraction of the USA’s (about 14 t) and well below the world average.
Energy use
- Fossil fuels (oil, coal and natural gas) still supply about four-fifths of the world’s primary energy.
- Burning them released about 38 billion tonnes of CO₂ a year in 2024–25 (about 10 billion tonnes of carbon), and the curve has not yet turned down.
- The top emitters, China, the USA, India, the EU and Russia, produce well over half of global emissions.
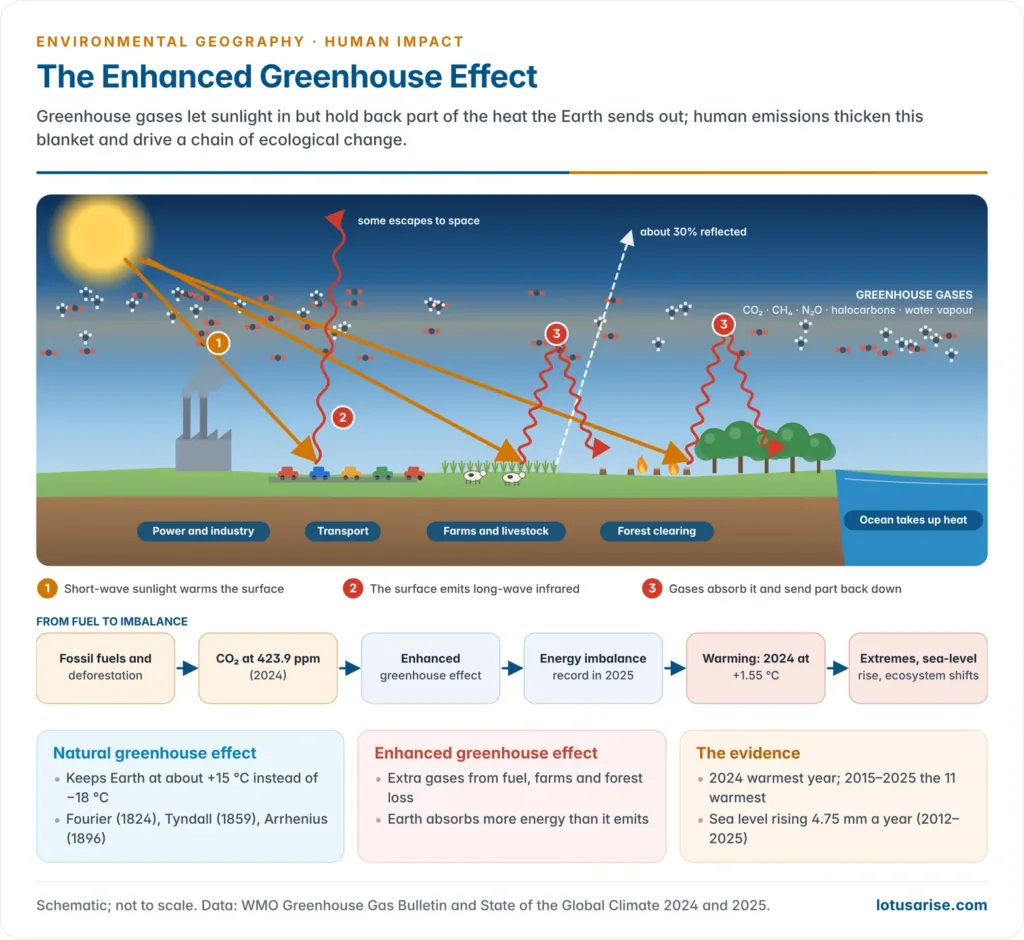
- The causal chain from fuel to imbalance is direct: combustion → rising CO₂ → enhanced greenhouse effect → warming → extremes, sea-level rise and ecosystem shifts.
Land use change
- Natural land covers (forests, grasslands, wetlands and drylands) are being converted to human-dominated ecosystems: cropland, pasture, plantations and cities.
- Human use now directly affects more than 70% of the ice-free land surface (IPCC Special Report on Climate Change and Land, 2019).
- Deforestation slowed to about 10.9 million ha a year in 2015–2025, from 17.6 million ha a year in 1990–2000 (FAO Global Forest Resources Assessment 2025). It is still concentrated in the tropics.
- How land use change alters the biosphere:
- It reduces native habitat, so many species can no longer survive.
- Clearing removes vegetation that took up CO₂ through photosynthesis.
- It speeds the decomposition of soil organic matter, releasing more greenhouse gas. Land use change contributes roughly a tenth of today’s CO₂ emissions, and a much larger share of cumulative emissions since 1850.
- Clearing fragments habitats into isolated patches whose small populations are vulnerable to local extinction.
- The sequence of land use changes, and its ecological effects, is treated in detail under regional changes below.
Pollution
- Environmental pollution is a principal by-product of economic development: substances and wastes harmful to human and ecological health.
- It rose with the petroleum age of the 20th century, as plastics, pesticides, solvents and industrial chemicals became central to modern life.
| Pollution | Main sources | Agents | Ecological impact |
|---|---|---|---|
| Air | Coal and oil power, vehicles, industry, crop burning | NOx, SO₂, particulates, CO, ground-level ozone | Acid rain, smog, crop and forest damage, respiratory disease |
| Heavy metals | Mining, fuel combustion, paints, batteries, e-waste | Mercury, lead, cadmium, arsenic | Bioaccumulation in food chains; neurotoxicity |
| Nutrients | Fertilisers, sewage, livestock waste | Nitrogen, phosphorus | Eutrophication of lakes, rivers and coasts; dead zones |
| Plastics | Packaging, consumer goods, fishing gear | Macro- and microplastics | Marine debris; ingestion and entanglement of wildlife |
| Radioactive | Nuclear accidents, weapons testing, waste | Uranium, plutonium, caesium-137 | Long-lived soil and water contamination; genetic damage |
- Humans now dominate global material flows:
- Human fixation of nitrogen, chiefly through fertilisers, now exceeds natural fixation on land: about 165 Tg N a year is fixed for agriculture alone, against a boundary of 62 Tg.
- The Great Pacific Garbage Patch covers an estimated 1.6 million km², about three times the area of France; similar accumulations occur in the other subtropical gyres.
Factors affecting regional ecological change
- Regional ecological change is the alteration of ecosystems over a particular area: a river basin, a mountain range, a dryland or a coast. It is decided by the interaction of natural events, human pressures and the region’s own sensitivity.
| Group | Factors | Regional examples |
|---|---|---|
| Natural | Climatic variability (ENSO, monsoon failure), droughts, cyclones, earthquakes, volcanic eruptions, natural fires, pest outbreaks | Sahel droughts of 1968–74 and the early 1980s; Mount Pinatubo (1991) cooling the globe by about 0.5 °C for a year |
| Demographic | Population growth, density and migration into frontier zones | Settlement of the Amazon along highways; hill migration in north-east India |
| Land use | Agricultural expansion, deforestation, shifting cultivation with shortened fallows, urban sprawl | Indonesian peatland drainage for oil palm; urban sprawl of Bengaluru and Delhi |
| Water development | Large dams, canal irrigation, groundwater mining, inter-basin diversion | Aral Sea; Punjab–Haryana water tables; Indira Gandhi Canal salinity |
| Extraction | Mining, quarrying, overfishing, overgrazing, logging | Jharia coalfield; Aravalli mining; collapse of the Newfoundland cod fishery (1992) |
| Pollution | Industrial effluents, sewage, agrochemicals, air pollution | Ganga and Yamuna; Indo-Gangetic Plain smog |
| Biological | Invasive species, loss of keystone species | Lantana camara and Prosopis juliflora in India; water hyacinth in Lake Victoria |
| Socio-economic | Poverty, markets and trade, subsidies, insecure tenure, weak governance | Soy and beef demand driving Amazon clearing; free power and assured procurement locking in paddy in Punjab |
| Climate change | Global warming expressed regionally | Arctic sea ice loss; Himalayan glacier retreat; coral bleaching |
- Distant drivers: demand in one region (for soy, palm oil, beef or timber) drives clearing in another, so regional change often has global causes.
- Sensitivity decides the outcome. The same pressure does more damage in fragile systems:
- mountains (steep slopes, thin soils);
- drylands (low, variable rainfall);
- coasts, deltas and small islands (sea level, storms);
- wetlands and polar regions.
- Effects on human health follow from these changes, because environment and human health are bound together through disease ecology:
- Vector-borne disease: irrigation canals and reservoirs spread malaria; warming and urbanisation have carried dengue to new areas and higher altitudes.
- Zoonoses: forest clearing in Karnataka’s Shimoga district exposed people to Kyasanur Forest Disease (1957); Nipah in Kerala is linked to fruit bats and habitat change; SARS (2003) and COVID-19 showed that no country is immune to diseases crossing from animals to people.
- Air pollution and heat: respiratory and cardiovascular illness and heat stress; in India air pollution was linked to about 1.67 million deaths in 2019 (The Lancet Planetary Health, 2020).
- Water and food: arsenic and fluoride in groundwater, diarrhoeal disease after floods, and malnutrition after crop failure.
Global Ecological Changes
Ozone layer depletion
- The atmosphere is layered into the troposphere (from the surface to about 12 km on average), the stratosphere (to about 50 km) and the mesosphere (to about 80 km); the structure of the atmosphere sets where ozone forms and stays.
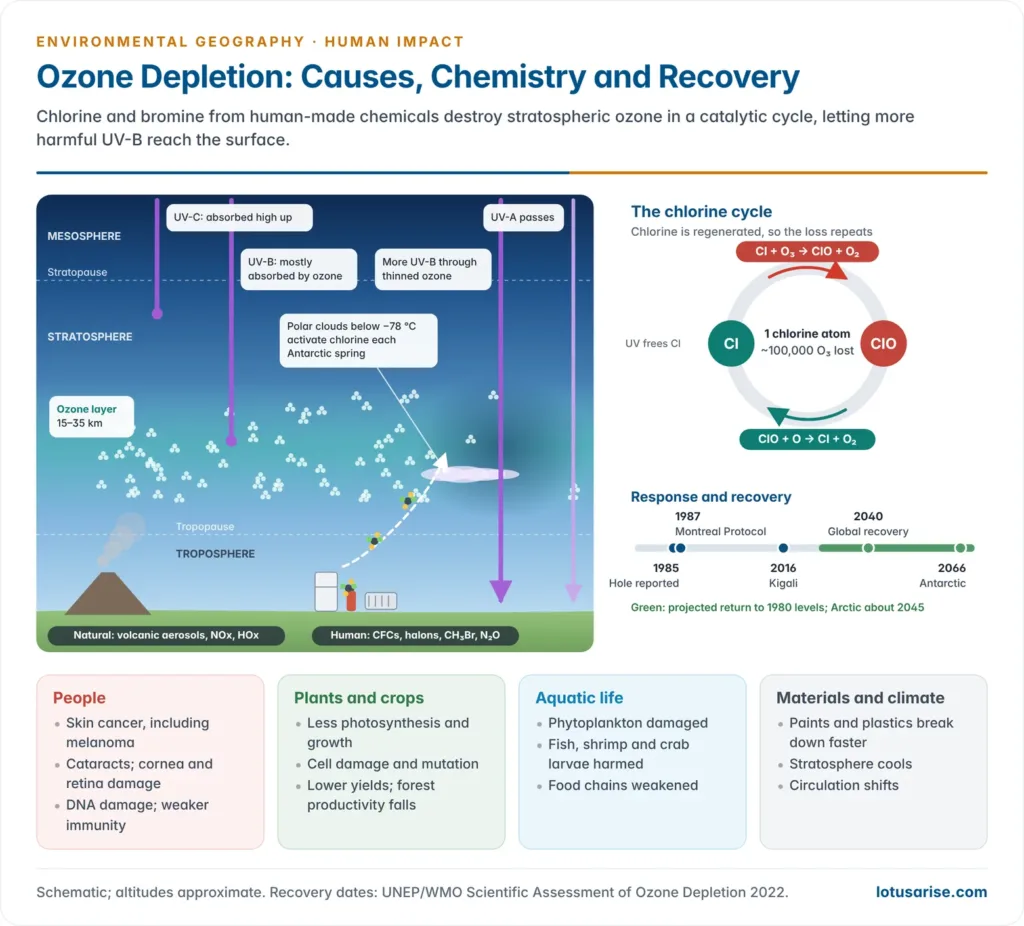
- The ozone layer, concentrated between about 15 and 35 km in the stratosphere, filters harmful ultraviolet radiation (UV-B) from the Sun.
- Any thinning lets more UV-B reach the surface, with dangerous consequences for living organisms.
The ozone hole
- The ozone hole is a seasonal thinning of stratospheric ozone over Antarctica each southern spring (September–November).
- It was reported by Joseph Farman, Brian Gardiner and Jonathan Shanklin (1985) of the British Antarctic Survey.
- Mario Molina and F. Sherwood Rowland (1974) had already shown that CFCs could destroy stratospheric ozone. They shared the 1995 Nobel Prize in Chemistry with Paul Crutzen.
- Why over Antarctica:
- The polar winter vortex isolates very cold air.
- Polar stratospheric clouds form below about −78 °C. On their surfaces, chlorine is converted into active forms.
- Returning spring sunlight releases chlorine atoms, which destroy ozone rapidly.
Causes of ozone depletion
- Natural causes: hydrogen oxides (HOx), methane, hydrogen gas and nitrogen oxides (NOx). Chlorine compounds and sulphate aerosols from volcanic eruptions also catalyse ozone-destroying reactions.
- Anthropogenic causes:
- Chlorofluorocarbons (CFCs), once used as refrigerants, aerosol propellants and foam-blowing agents, are the most damaging.
- Halons (fire extinguishers), carbon tetrachloride, methyl chloroform and methyl bromide (a fumigant) add chlorine and bromine.
- Nitrous oxide from fertilisers is now the largest ozone-depleting emission not controlled by the Montreal Protocol.
- The mechanism:
- Ultraviolet light splits a CFC molecule in the stratosphere and frees a chlorine atom.
- Cl + O₃ → ClO + O₂, then ClO + O → Cl + O₂: the chlorine atom is regenerated.
- A single chlorine atom can therefore destroy about 100,000 ozone molecules before it is locked away.
Effects of ozone depletion
- Human health: higher risk of skin cancer (including melanoma), cataracts and damage to the cornea and retina, DNA damage, and suppression of the immune system.
- Plants, forests and crops: UV-B damages chlorophyll, inhibits photosynthesis and growth, and can cause mutation. It lowers yields of sensitive crops such as soybean, rice and wheat, and forest productivity falls.
- Aquatic life: UV-B penetrates surface water and damages phytoplankton, the base of marine food chains, and the larvae of fish, shrimp and crabs.
- Materials and climate: UV-B speeds the breakdown of plastics, paints and building materials. Ozone loss also cools the stratosphere and alters atmospheric circulation; the Antarctic hole has shifted Southern Hemisphere westerlies southward.
International response: the Montreal Protocol and beyond
- Concerted international action produced what is widely regarded as the most successful environmental agreement in history:
| Year | Instrument | Key step |
|---|---|---|
| 1985 | Vienna Convention | Framework for protecting the ozone layer |
| 1987 | Montreal Protocol | Binding phase-out of CFCs and other ozone-depleting substances; in 2009 it and the Vienna Convention became the first UN treaties ratified by every country |
| 1989 | Helsinki Declaration | Commitment to phase out CFCs by 2000 |
| 1990, 1992 | London and Copenhagen Amendments | Faster phase-outs; HCFCs listed |
| 2016 | Kigali Amendment | Phase-down of HFCs, ozone-safe but powerful greenhouse gases |
- HCFCs were approved as temporary substitutes: less damaging than CFCs, but not ozone-safe. HFCs replaced them, and the Kigali Amendment now phases these down too.
- India’s schedule under Kigali: freeze in 2028 and an 85% cut by 2047.
- Avoided HFC warming of up to about 0.4 °C by 2100 makes Kigali a climate treaty as well.
- Recovery: the UNEP/WMO Scientific Assessment of Ozone Depletion (2022) found the layer on track to return to 1980 values by about 2040 for most of the globe, 2045 over the Arctic and 2066 over the Antarctic, if current policies hold.
- India ended CFC production and consumption in August 2008, ahead of the 2010 deadline. It ratified Kigali in 2021 and prepared the India Cooling Action Plan (2019) to curb cooling demand and refrigerant use.
- Why it worked: clear science, available substitutes, a multilateral fund for developing countries and trade measures against non-parties; conditions much harder to meet for carbon.
Global warming and climate change
- Instrumental records establish that the Earth is progressively getting warmer, and the attribution of present change to human activity is now unequivocal (IPCC AR6, 2021).
- Carbon dioxide (CO₂) is the key greenhouse gas. Methane, nitrous oxide and halocarbons (CFCs, HFCs), though present in far smaller quantities, are much more potent per molecule. Water vapour acts as a feedback.
| Gas | Concentration in 2024 | Warming potency (100-year GWP) | Main human sources |
|---|---|---|---|
| CO₂ | 423.9 ppm | 1 | Fossil fuels, cement, deforestation |
| Methane (CH₄) | 1,942 ppb | About 27–30 | Livestock, paddy, landfills, fossil fuel leaks |
| Nitrous oxide (N₂O) | 338.0 ppb | About 273 | Fertilisers, manure, industry |
| Halocarbons | Parts per trillion | Hundreds to thousands | Refrigerants, foams, solvents |
- All three main gases are at their highest levels in at least 800,000 years (WMO). CO₂ has been tracked continuously at Mauna Loa since Charles David Keeling (1958).
The greenhouse effect: mechanism
- The greenhouse effect is a natural process essential for life. Without it, Earth’s average surface temperature would be about −18 °C instead of about +15 °C.
- Joseph Fourier (1824) first reasoned that the atmosphere traps heat. John Tyndall (1859) measured the heat absorption of CO₂ and water vapour, and Svante Arrhenius (1896) calculated the warming from doubled CO₂.
- How it works:
- Short-wave solar radiation passes through the atmosphere and is absorbed by the surface.
- The warmed surface re-emits long-wave infrared radiation.
- Greenhouse gases absorb this infrared and re-radiate part of it downward, warming the lower atmosphere.
- The enhanced greenhouse effect is the extra trapping caused by human additions of greenhouse gases. It is upsetting the radiation balance: Earth now absorbs more energy than it emits, and its energy imbalance reached a record in 2025. The heat budget of the Earth is thus out of balance.
The evidence now
- 2024 was the warmest year on record, about 1.55 ± 0.13 °C above 1850–1900 and the first calendar year above 1.5 °C (WMO State of the Global Climate 2024).
- One year above 1.5 °C does not breach the Paris goal, which refers to 20-year averages.
- 2025 was the second or third warmest year, at about 1.43 ± 0.13 °C. 2015–2025 are the eleven warmest years on record (WMO State of the Global Climate 2025).
- Oceans have absorbed more than 90% of the excess heat. Ocean heat content set a new record in 2025, and the rate of ocean warming in 2005–2025 was more than double that of 1960–2005.
- Sea level rose at about 4.75 mm a year in 2012–2025, against 2.65 mm a year in 1993–2011. The Arctic sea-ice winter maximum of 2025 was the lowest on record, and glacier mass loss in 2024–25 was among the five worst years measured.
Effects on living beings
- The productivity paradox: more CO₂ can raise photosynthesis (“CO₂ fertilisation”). But weeds may spread at the expense of crops, insect pests multiply in warmer winters, and heat and drought cut yields of wheat and rice.
- Range shifts: species are moving poleward and upslope. In the Himalaya, treelines, montane plants and butterflies are shifting upward, an early warning of changing species distributions.
- Phenological mismatch: earlier flowering and insect emergence fall out of step with pollinators and migrant birds.
- Coral bleaching: marine heatwaves make corals expel their symbiotic algae (zooxanthellae).
- The fourth global bleaching event (from 2023) exposed about 84% of the world’s reef area to bleaching-level heat stress.
- Lakshadweep, the Gulf of Mannar and the Andamans have bleached repeatedly. Coral reefs are among the first ecosystems expected to cross a tipping point.
- Sea-level rise from thermal expansion and melting ice is projected (IPCC AR6) at about 0.3–0.6 m by 2100 under low emissions and 0.6–1.0 m under very high emissions. It threatens deltas, coastal cities and small islands.
- Water-cycle disruption: heavier rain in high latitudes and monsoon bursts, harsher droughts in the subtropics, and glacier melt that raises river flows now but threatens them later.
- Extreme events (heatwaves, floods, wildfires and intense cyclones) are more frequent and more intense. At 1.5 °C, about 14% of the world’s people would face a severe heatwave at least once every five years; at 2 °C, about 37% (IPCC Special Report on 1.5 °C, 2018).
Mitigating the greenhouse effect
- Energy efficiency in power plants, buildings, industry and vehicles: the cheapest near-term step.
- Renewable and low-carbon energy: solar, wind, hydro, nuclear and green hydrogen, with storage and grids.
- Halting deforestation and protecting peatlands, so the land carbon sink is not lost.
- Afforestation and restoration as carbon sinks; mangroves, seagrass and salt marshes store “blue carbon”.
- Carbon pricing and markets to internalise the cost of emissions, on the road to carbon neutrality and net zero.
- Cutting short-lived climate pollutants: methane, black carbon and HFCs, which also clean the air.
- Demand change: India’s Mission LiFE (Lifestyle for Environment) promotes mindful consumption.
India and the global regime
- National Action Plan on Climate Change (2008): eight missions, among them Solar, Enhanced Energy Efficiency, Water, Himalayan Ecosystem and Green India.
- Updated NDC (August 2022):
- cut the emissions intensity of GDP by 45% from 2005 levels by 2030;
- reach 50% of installed power capacity from non-fossil sources by 2030 (a share India crossed in mid-2025);
- create an extra carbon sink of 2.5–3 billion tonnes of CO₂ equivalent through forests.
- Net zero by 2070 (announced at COP26, Glasgow, 2021), and the Carbon Credit Trading Scheme (2023).
- Recent COPs:
- COP28, Dubai (2023): the first Global Stocktake; a call to transition away from fossil fuels in energy systems, and to triple renewable capacity and double energy efficiency by 2030. India stressed equity and the right to development.
- COP29, Baku (2024): a new finance goal of at least US$300 billion a year by 2035.
- COP30, Belém (2025): a call to triple adaptation finance by 2035, and the launch of the Tropical Forest Forever Facility to pay countries for standing forests.
How global warming differs from region to region
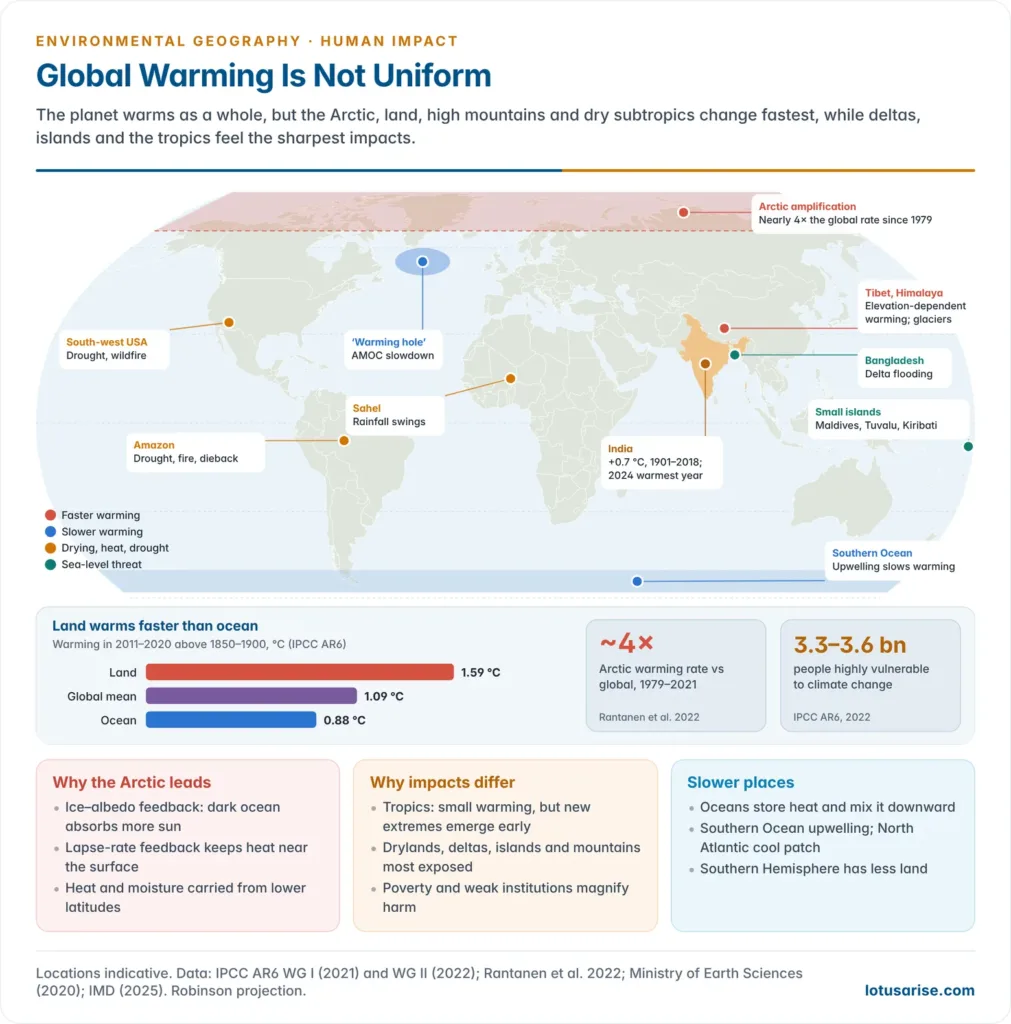
- Warming is global in cause but uneven in rate and impact. Both the physical warming and the ecological and human consequences vary from place to place.
Uneven warming
- Arctic amplification: the Arctic has warmed nearly four times faster than the globe since 1979 (Mika Rantanen and colleagues, 2022).
- The ice–albedo feedback is the main reason: melting snow and sea ice expose darker land and ocean, which absorb more sunlight and melt more ice.
- The lapse-rate feedback helps: in the stable polar air, warming concentrates near the surface.
- More heat and moisture arrive from lower latitudes, and thinner ice lets the ocean release heat to the air in winter.
- Land warms faster than ocean: in 2011–2020, land was about 1.59 °C and the ocean about 0.88 °C above 1850–1900, against a global mean of about 1.09 °C (IPCC AR6).
- Water has a high heat capacity, mixes heat downward and cools by evaporation; dry land has none of these buffers.
- The Northern Hemisphere, with more land, therefore warms faster than the Southern.
- Slow and cool spots:
- The Southern Ocean warms slowly because cold deep water wells up and carries heat down.
- A “warming hole” south of Greenland reflects a weakening Atlantic overturning circulation.
- High mountains warm faster than the surrounding lowlands (elevation-dependent warming), because snow-albedo and moisture feedbacks act strongly there. The Hindu Kush Himalaya and the Tibetan Plateau, the “Third Pole”, are leading examples.
- Continental interiors and the subtropics heat and dry more; the Mediterranean, south-western USA, southern Africa and parts of Australia are drying hotspots.
- Cities add their own urban heat island of a few degrees on top of regional warming, a feature of urban climates.
- India warmed by about 0.7 °C in 1901–2018 (Ministry of Earth Sciences, 2020), less than the global land average, partly because aerosols and irrigation have masked some warming over the north. 2024 was India’s warmest year since 1901.
Uneven impacts
- Small rises, large effects: the tropics warm less in degrees, but their natural variability is small. New extremes therefore emerge sooner there, and humid heat approaches the limits of human tolerance in South Asia and the Persian Gulf.
- Cryosphere regions: permafrost thaw in Siberia and Canada releases methane and CO₂; Arctic sea ice and Greenland melt; Himalayan glaciers retreat, threatening the rivers of South Asia.
- Coasts, deltas and small islands: sea-level rise and storm surges threaten Bangladesh, the Sundarbans, Maldives, Tuvalu and Kiribati, and the Nile, Mekong and Ganga–Brahmaputra deltas.
- Drylands: more frequent and severe drought, from the Sahel and the Horn of Africa to western India.
- Monsoon Asia: fewer rainy days but more extreme downpours, with longer breaks; floods and droughts in the same season.
- Some cold regions gain longer growing seasons (Canada, Scandinavia, Russia), offset by pests, fires and permafrost damage.
- Vulnerability, not exposure alone, decides harm. IPCC AR6 places 3.3–3.6 billion people in highly vulnerable contexts, concentrated in West, Central and East Africa, South Asia, Central and South America, small island states and the Arctic.
- The countries that emitted least suffer most: the core climate-justice problem.
Loss of biodiversity
- Biodiversity is the variety of life at all levels: genetic, species and ecosystem diversity. Its levels and patterns are the starting point here.
- The term was coined by Walter G. Rosen (1985) while planning the 1986 National Forum on BioDiversity in Washington. Edward O. Wilson popularised it as editor of the forum’s volume, BioDiversity (1988).
- It is more than a catalogue of species: it is the sum of evolutionary adaptations that give life its capacity to sustain itself.
Ecological function of biodiversity
- Biodiversity boosts ecosystem productivity. Every species, however small, has a role, and it is the combination of species that lets an ecosystem resist and recover from disturbance.
- Diverse ecosystems are more resilient, more productive over time and better at providing ecosystem services than species-poor ones. This is the “insurance” effect: if one species fails, another performs its function.
The scale of loss
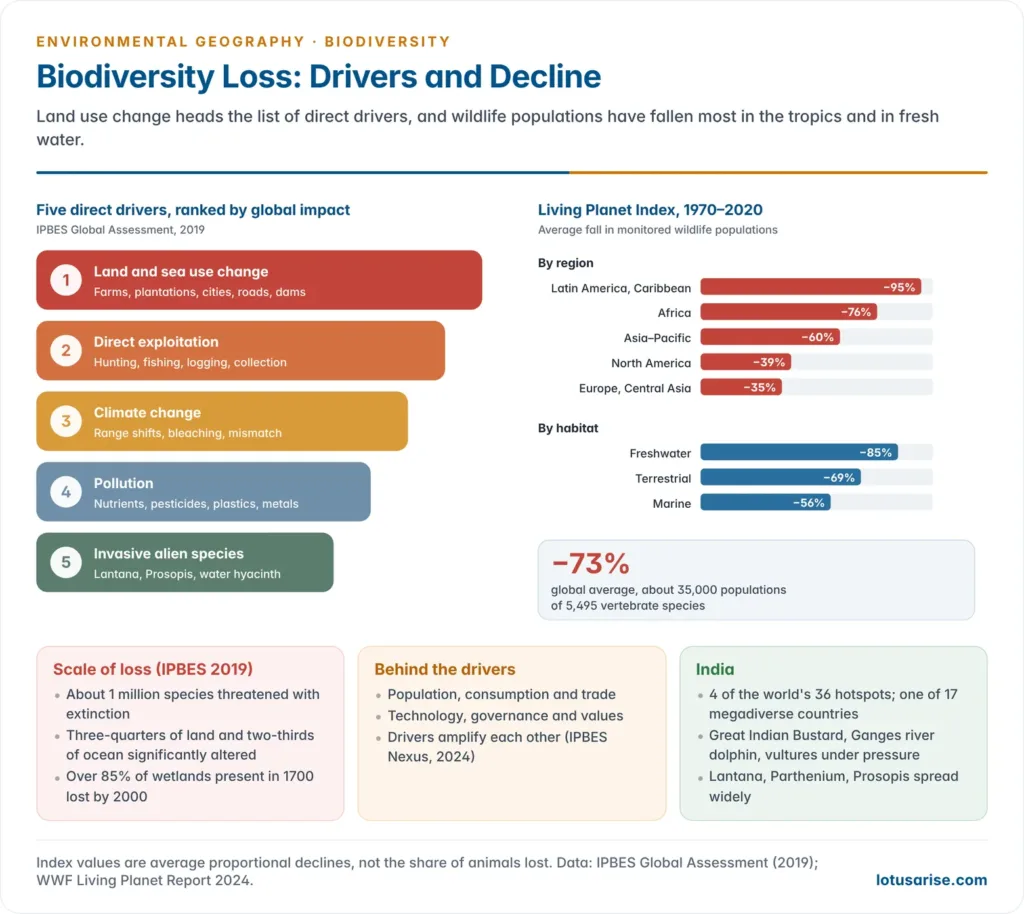
- The IPBES Global Assessment (2019) found that:
- about 1 million species are threatened with extinction, many within decades;
- three-quarters of the land surface and two-thirds of the ocean area have been significantly altered by human action;
- over 85% of the wetlands present in 1700 had been lost by 2000.
- The Living Planet Report 2024 recorded an average 73% decline in monitored wildlife populations between 1970 and 2020, from about 35,000 populations of 5,495 vertebrate species.
- The decline was steepest in Latin America and the Caribbean (95%), then Africa (76%) and Asia–Pacific (60%).
- Freshwater populations fell most (85%), followed by terrestrial (69%) and marine (56%).
- The extinction rate is now tens to hundreds of times the background rate, which is why biosphere integrity sits in the high-risk zone of the planetary boundaries.
Drivers of biodiversity loss
- IPBES (2019) ranked five direct drivers by global impact:
- Land and sea use change: conversion of habitats to farms, plantations, cities and infrastructure. It is the leading driver globally and in India.
- Direct exploitation of organisms: hunting, fishing, logging and collection. Overexploitation threatens about 72% of threatened and near-threatened species assessed (Sean Maxwell and colleagues, 2016).
- Climate change: shifts in range, phenology and food webs, which ecosystems cannot follow fast enough.
- Pollution: nutrients, pesticides, plastics and heavy metals degrade habitats.
- Invasive alien species: introduced through trade and travel, they outcompete natives, especially on islands and in fresh water.
- Indirect drivers stand behind them: population, consumption, trade, technology, governance and values. The IPBES Nexus and Transformative Change assessments (December 2024) found that the crises of biodiversity, water, food, health and climate amplify each other and must be tackled together.
- Response: the Kunming–Montreal Global Biodiversity Framework (2022) set 23 targets for 2030, including protecting 30% of land and sea (“30×30”) and restoring 30% of degraded ecosystems, so linking biodiversity and sustainable development.
Biodiversity loss in India
- India holds 4 of the world’s 36 biodiversity hotspots: the Himalaya, Indo-Burma (north-east), the Western Ghats–Sri Lanka and Sundaland (Nicobar Islands).
- It is one of the 17 megadiverse countries, with 7–8% of recorded species on 2.4% of the world’s land.
- Flagship species under pressure:
- the Great Indian Bustard, from power lines and grassland loss in Rajasthan and Gujarat;
- the Ganges river dolphin, from dams, sand mining and pollution;
- the snow leopard, from habitat change and conflict.
- Vultures crashed by over 95% in the 1990s–2000s after poisoning by the veterinary drug diclofenac, a case of wildlife problems driven by a single pollutant.
- Invasive species such as Lantana camara, Parthenium hysterophorus and Prosopis juliflora cover large areas of forests, grasslands and drylands, suppressing native recovery and wildlife forage.
Nitrogen and phosphorus overload
- Human activity has roughly doubled the nitrogen cycling through land ecosystems and greatly increased phosphorus flows. Biogeochemical flows are thus in the high-risk zone.
- Nitrogen fixed for agriculture is about 165 Tg a year, over two and a half times the boundary.
- Mined phosphorus applied to cropland is about 18.2 Tg a year, about three times the boundary.
- Where it goes: crops take up only a part. Much of the rest leaches into groundwater, runs off into rivers or escapes to the air as ammonia, NOx and nitrous oxide.
- Consequences:
- Eutrophication of lakes, rivers and coasts: algal blooms, oxygen loss and fish kills.
- Dead zones (hypoxic waters), counted at over 400 worldwide by Robert Diaz and Rutger Rosenberg (2008). The largest are the Baltic Sea and the northern Gulf of Mexico off the Mississippi.
- Nitrate pollution of drinking water, soil acidification, and nitrous oxide that both warms the climate and depletes ozone.
- India: heavily subsidised urea encourages nitrogen-heavy fertiliser use. Nitrogen-use efficiency in cereals is low, and nitrate is rising in the groundwater of Punjab, Haryana and other intensively farmed states.
Ocean acidification
- The oceans have absorbed roughly a quarter of human CO₂ emissions. Dissolved CO₂ forms carbonic acid, lowering pH and the carbonate ions that shell-builders need.
- Surface ocean pH has fallen by about 0.1 since pre-industrial times, a 30–40% rise in acidity. In 2025 the surface aragonite saturation (2.84) slipped below the boundary of 2.86.
- Effects:
- corals, molluscs, pteropods and some plankton struggle to build shells and skeletons;
- polar and upwelling waters are corrosive first;
- combined with warming and deoxygenation, it forms the “deadly trio” of ocean threats.
Regional Ecological Changes and Imbalances
Land use and land cover change
- Land cover is the physical surface of the land (forest, grassland, water, built-up area). Land use is the human purpose to which it is put (farming, grazing, settlement, conservation).
- Land use and land cover (LULC) change happens by conversion (forest to cropland) or modification (thinning a forest, intensifying a farm).
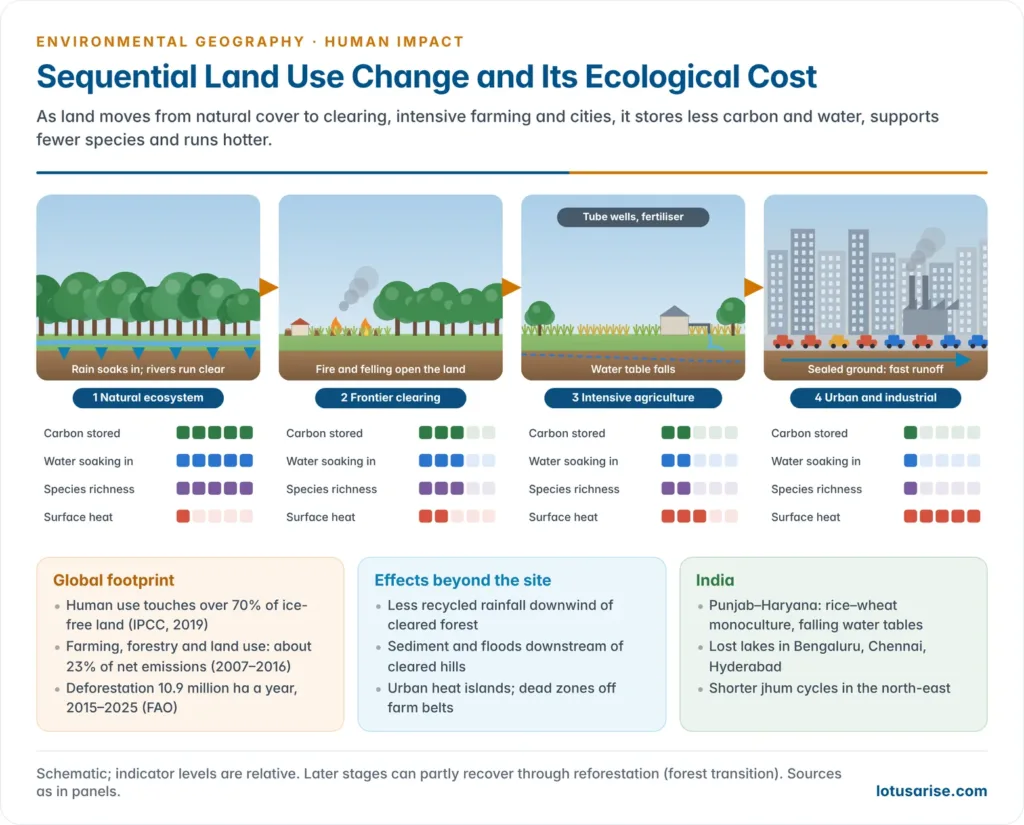
- Sequential change: across history and across regions, land use moves through a broadly similar sequence:
- Natural ecosystems with hunting, gathering and low-density use.
- Frontier clearing: shifting cultivation, pastoralism and logging open the land.
- Settled and then intensive agriculture: permanent fields, irrigation, fertilisers and monocultures.
- Urban, industrial and infrastructure use on the best and flattest land.
- In rich regions, partial recovery: farm abandonment, reforestation and protected areas.
- Jonathan Foley and colleagues (2005) framed this as a land use transition, and Alexander Mather (1992) described the forest transition: forest cover falls with development and then recovers once agriculture intensifies and people move to cities.
- Each step changes ecological functions:
| Function | How LULC change alters it | Consequence |
|---|---|---|
| Carbon | Clearing and drainage release stored carbon; sinks shrink | More CO₂ and warming |
| Energy balance | Albedo and evapotranspiration change; sealing by concrete | Local warming or cooling; urban heat islands |
| Water | Less infiltration, faster runoff, lower groundwater recharge, less recycled rainfall | Flash floods, droughts, falling water tables |
| Soil | Exposure, tillage and overgrazing | Erosion, compaction, salinisation, fertility loss |
| Biodiversity | Habitat loss, fragmentation, edge effects | Local extinction; invasion by weeds |
| Nutrients | Fertilisers, manure and sewage | Eutrophication and dead zones |
| Health | New contact between people, livestock and wildlife; stagnant water | Zoonoses, malaria, dengue |
- Global consequences of regional LULC change:
- Agriculture, forestry and other land use (AFOLU) produced about 23% of net human greenhouse gas emissions in 2007–2016 (IPCC, 2019).
- Habitat conversion is the leading driver of biodiversity loss.
- Large-scale clearing can alter rainfall far away: Amazon forests recycle moisture that feeds rainfall across South America (“flying rivers”).
- Regional consequences: Himalayan forest loss raises sediment and floods downstream; dryland clearing feeds desertification; wetland drainage removes flood buffers; urban sprawl seals farmland and recharge zones.
- India:
- Net sown area has stayed at about 140 million ha for decades. Change has come through intensification (irrigation, double cropping), the spread of built-up land, and conversion of commons, wetlands and forests, as the changes in land use pattern in India show.
- Examples:
- the Green Revolution belt of Punjab and Haryana, with its rice–wheat monoculture and falling water tables;
- plantations and hill stations replacing shola grasslands in the Western Ghats;
- shortened jhum cycles in the north-east;
- lake and wetland loss in fast-growing cities such as Bengaluru, Chennai and Hyderabad, which deepens urban flooding;
- mining landscapes of the Chotanagpur plateau and the Aravallis.
- ISRO’s National Remote Sensing Centre maps LULC repeatedly from satellite data, making change detection a routine planning tool.
Deforestation
- Forests cover about 31–32% of the land. Net loss has slowed, but tropical primary forests continue to fall to cattle ranching, soy, oil palm, mining, logging and fire.
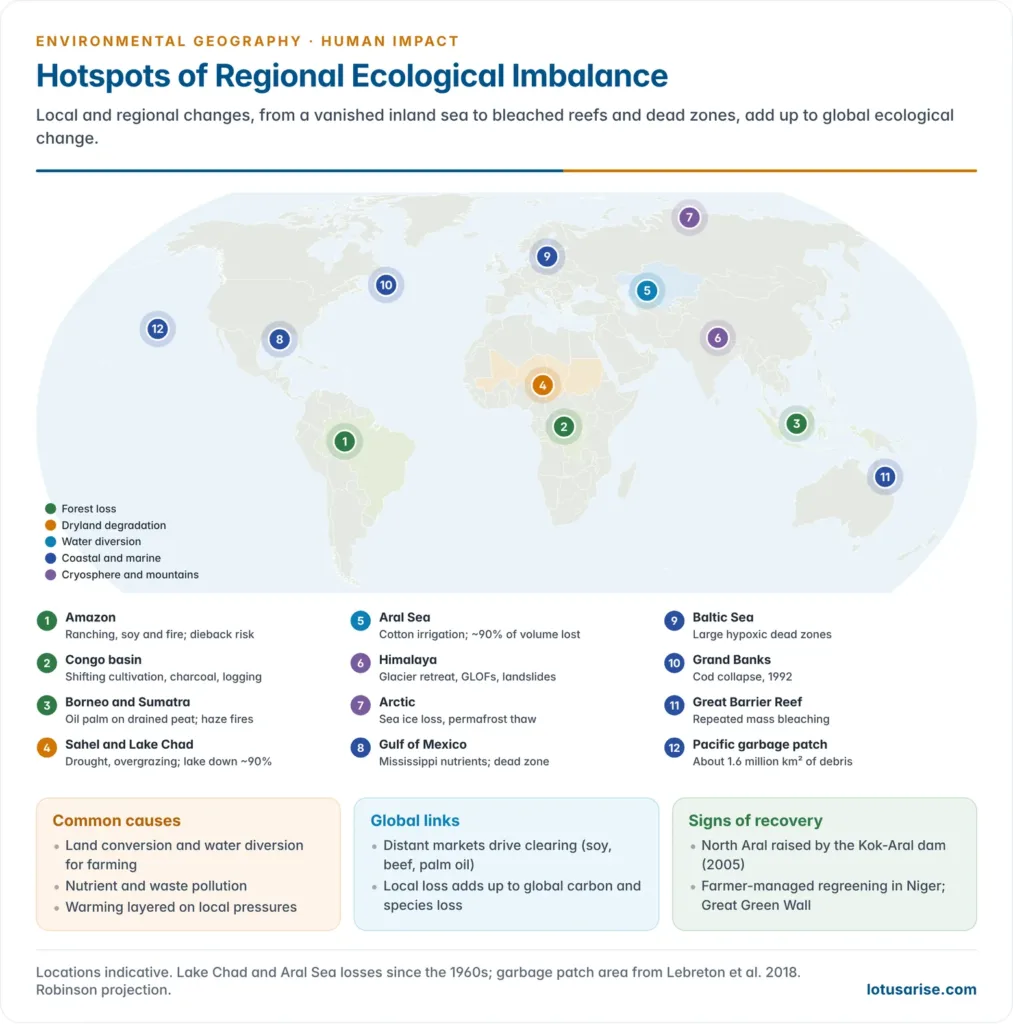
- Amazon:
- Nearly a fifth of the original forest has been cleared. Scientists warn that loss of 20–25%, combined with warming and fire, could tip parts of it into degraded savanna.
- Parts of the south-eastern Amazon already emit more carbon than they absorb.
- Brazil cut clearing sharply from 2023, but record droughts in 2023–24 fuelled fires.
- Congo basin: shifting cultivation, charcoal and logging. It is still a large net carbon sink.
- South-east Asia: oil palm and pulp plantations on drained peatlands in Indonesia and Malaysia; peat fires (as in 2015) spread haze across the region.
- Ecological effects: tropical deforestation releases carbon, dries regional climates, and leaves fragmented habitats whose edges are invaded by fire and weeds.
Desertification and land degradation
- Desertification is land degradation in arid, semi-arid and dry sub-humid areas from climatic variations and human activities (UNCCD, 1994). It is not the advance of deserts but the decline of drylands in place.
- It results from recurrent droughts combined with over-exploitation: overgrazing, cutting of woody vegetation, cultivation of marginal land and faulty irrigation.
- Desert lands are sometimes grouped by rainfall and origin:
| Type | Rainfall | Character |
|---|---|---|
| Rainless desert | Rain not an annual event | Extreme aridity, as in the core of the Sahara and the Atacama |
| Run-off desert | Below about 100 mm, low and variable | Life depends on run-off from surrounding areas |
| Rainfall desert | About 100–200 mm | Too dry for rain-fed crops |
| Man-made desert | About 200–350 mm | Semi-arid land turned desert-like by over-use |
- Reversal is costly. It needs the biological recovery of vegetation and soil, natural or assisted. The USA, Australia and Israel built up early experience, and the Sahel’s farmer-managed natural regeneration has shown that low-cost restoration can work.
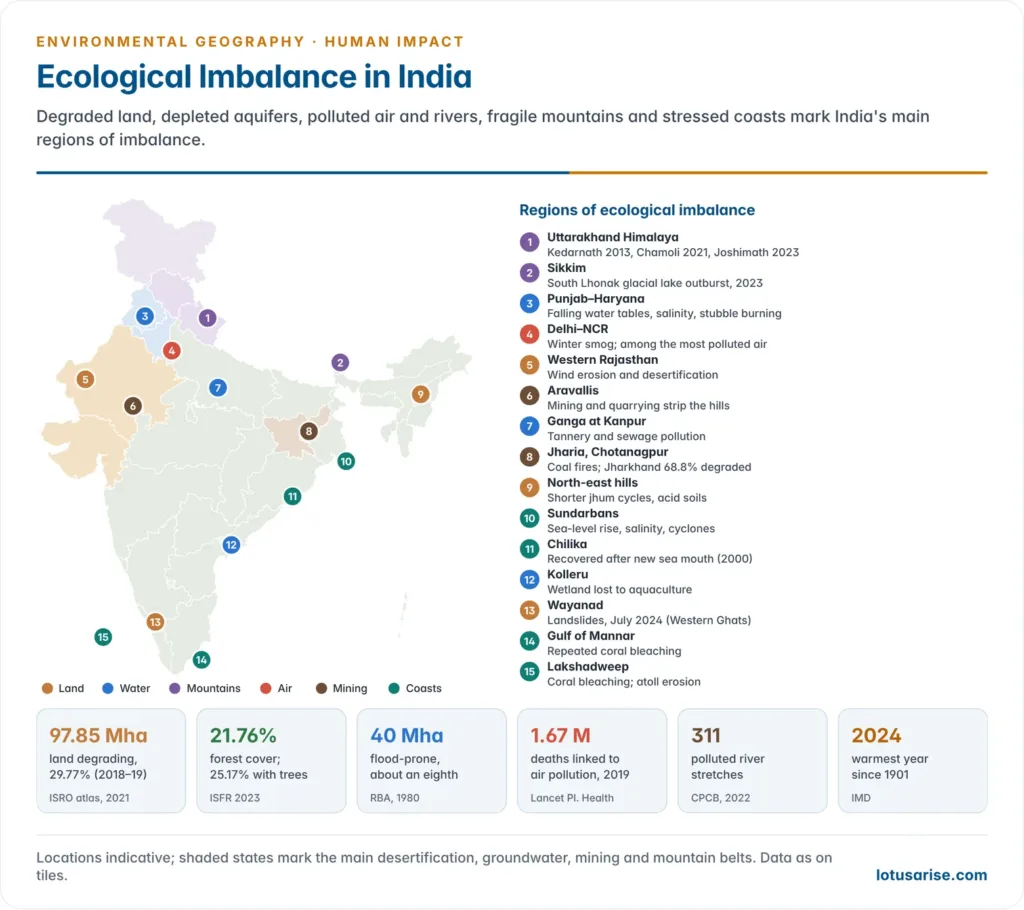
- India: about 97.85 million ha (29.77%) was undergoing land degradation in 2018–19, including 83.69 million ha of desertification in drylands (ISRO Desertification and Land Degradation Atlas, 2021).
- Jharkhand, Rajasthan, Delhi, Goa and Gujarat have the highest shares of their area degraded, mostly through soil erosion and land degradation by water and wind.
Wetland loss
- Wetlands are among the most productive and most threatened ecosystems.
- About 22% of the world’s wetlands (411 million ha) have been lost since 1970, and about a quarter of the rest are in poor condition (Ramsar Global Wetland Outlook, 2025).
- Losses come from drainage for farming and cities, upstream diversion, pollution and invasive weeds.
- Consequences: lost flood storage and groundwater recharge, collapse of fisheries and waterbirds, and release of stored carbon from peat.
- India: encroachment on Kolleru for aquaculture, the shrinking of urban lakes, and sewage-fed East Kolkata Wetlands under pressure. Chilika shows recovery: a new sea mouth cut in 2000 restored salinity and fisheries, and the lake was removed from the Montreux Record of threatened sites in 2002.
Coastal and marine imbalance
- Coral reefs: warming, acidification and pollution have caused repeated mass bleaching, most recently the global event that began in 2023.
- Overfishing: about 38% of assessed marine fish stocks were overfished in 2021 (FAO, 2024). The Newfoundland cod collapse of 1992 is the classic case of a fishery that never fully recovered.
- Mangroves and deltas: clearing for shrimp ponds and ports, and sediment starved by upstream dams, leave deltas sinking and eroding. The Sundarbans face rising salinity and sea level.
Regional case studies
The Aral Sea
- Once the world’s fourth-largest lake (about 68,000 km²), it lies between Kazakhstan and Uzbekistan.
- From the 1960s, Soviet planners diverted the Amu Darya and Syr Darya to irrigate cotton. The sea split into parts, lost about 90% of its volume, and its eastern basin dried out completely by 2014.
- Imbalance:
- salinity multiplied and the fishery collapsed;
- the exposed bed became the Aralkum desert, whose salt and pesticide dust storms harm crops and health far around;
- the local climate grew more continental, with hotter summers and colder winters.
- Partial recovery: the Kok-Aral dam (2005) raised the North Aral, salinity fell and fishing returned. The South Aral remains largely lost. It is a textbook case of water development without ecological limits.
The Sahel and Lake Chad
- The Sahel, the semi-arid belt south of the Sahara, suffered severe droughts in 1968–74 and the early 1980s, with famine and mass migration.
- Jule Charney (1975) argued that overgrazing raised surface albedo, which suppressed rainfall: a human–climate feedback. Later work showed that Atlantic and Indian Ocean temperatures drove most of the drought, with land degradation amplifying it.
- Lake Chad has shrunk by about 90% since the 1960s, through drought and irrigation withdrawals, deepening conflict over water and pasture.
- Responses: the African Union’s Great Green Wall (2007), a mosaic of restored land across the continent, aims to restore 100 million ha by 2030. Farmer-managed natural regeneration has re-greened millions of hectares in Niger.
The Amazon
- The largest tropical forest, which recycles much of its own rainfall and stores vast carbon.
- Drivers: cattle pasture, soy, roads, mining and fire. Ecological imbalance: habitat loss, a weakened carbon sink, longer dry seasons, and the risk of dieback if deforestation and warming cross a threshold.
The Himalaya and the Arctic
- Himalaya: deforestation, road cutting, hydropower and tourism load fragile mountain ecosystems whose glaciers are retreating. The result is landslides, glacial lake outburst floods and flash floods, as at Kedarnath (2013), Chamoli (2021) and South Lhonak, Sikkim (2023), alongside the Joshimath subsidence (2023).
- Arctic: loss of sea ice threatens polar bears, walrus and the Inuit way of life, and permafrost thaw destabilises ground and releases carbon, a regional change with global feedback.
Wider impacts of ecological imbalance
- The impacts of imbalanced ecosystems are pervasive, crossing the boundaries of ecology, health, economics and geopolitics, and reaching people regardless of country or race.
Soil degradation
- Soil, the base of productivity, degrades through erosion where cover is cleared, acidification from acid rain and fertilisers, salinisation and waterlogging where irrigation lacks drainage, and chemical contamination by persistent pollutants (DDT, PCBs) and radioactive substances.
- India: salt-affected soils lie mainly in the canal commands of Uttar Pradesh, Punjab and Haryana and in coastal Gujarat.
Genetic resource depletion
- The genes in domesticated crops, trees, livestock, fish and micro-organisms are the raw material for breeding better yield, nutrition and disease resistance.
- Intensive selection for high performance and uniformity has made the genetic base of food production dangerously narrow.
- Old varieties and wild relatives are disappearing before they can be studied or used: genetic erosion.
- India lies in one of Nikolai Vavilov’s centres of origin of cultivated plants. The Green Revolution’s few high-yielding wheat and rice varieties displaced thousands of traditional landraces.
- The National Gene Bank of the National Bureau of Plant Genetic Resources (New Delhi) conserves several lakh accessions, an ex-situ conservation measure against genetic erosion.
Contamination of food
- Chemicals reach food and feed from many sources: pesticide residues on crops; veterinary drugs and growth promoters in meat and milk; preservatives such as sodium nitrite; packaging chemicals; and industrial effluents.
- Centralised processing spreads contamination widely, and crops also take up airborne industrial deposits and sewage used for irrigation.
Economic and social effects
- Lost ecosystem services (pollination, flood control, fisheries, clean water) hit the rural poor hardest.
- Climate migration: the World Bank’s Groundswell report (2021) projected up to 216 million internal climate migrants by 2050 without strong action; shrinking water and pasture already fuel conflict around Lake Chad.
Ecological Imbalance in India
- India’s ecological imbalance is driven by five interconnected factors, operating together and reinforcing one another.
Degradation of land and soil erosion
- Heavy population pressure has turned forests and permanent pastures into cropland, encouraged indiscriminate grazing and stripped protective vegetation.
- About 29.8% of India’s land was undergoing degradation in 2018–19 (ISRO). Water erosion is the leading process, followed by vegetation degradation and wind erosion in the arid north-west.
- An older ICAR estimate (2010) put degraded and wasteland at about 120 million ha, most of it eroded by water and wind; figures differ with method and scale.
Deforestation
- Large-scale deforestation continued after Independence through over-exploitation and mismanagement.
- In the first two decades of planning (1951–1972), India lost about 3.4 million ha of forest, roughly 70% of it to river valley projects, roads, communications and industries.
- Deforestation in the Himalaya from Kashmir to the north-east led to accelerated erosion, flash floods and biodiversity loss.
- Official versus real forest cover:
- The National Committee on Environmental Planning had judged that adequate tree cover was not more than about 12% of the geographical area, against an official figure of over 22%.
- The India State of Forest Report 2023 puts forest cover at 21.76% and forest and tree cover at 25.17%.
- The gap lies in definition: any patch over 1 ha with at least 10% canopy counts as forest, including plantations and orchards that give far fewer ecosystem services than natural forest. Very dense forest is only about 3% of the country.
Faulty use of water resources
- India receives abundant monsoon rain yet suffers from both floods and droughts, partly because of the way water has been used.
- Large dams have:
- displaced millions, many of them tribal people;
- submerged rich forests;
- not prevented floods, and sometimes worsened downstream flash floods when released in emergencies.
- About 40 million ha, about an eighth of the country, is flood-prone (Rashtriya Barh Ayog, 1980). Encroachment on floodplains and drainage channels has raised flood losses.
- Canal irrigation without drainage has caused waterlogging and salinity in the Indo-Gangetic plains of Uttar Pradesh, Punjab and Haryana and in the Indira Gandhi Canal command.
- Groundwater mining for paddy has lowered water tables across Punjab, Haryana and western Uttar Pradesh.
Faulty mining practices
- Large-scale mineral extraction turns farmland and forest into pits, dumps, townships and haul roads, strips topsoil, fills the air with mineral dust, sends acid and metal-laden run-off into streams, and causes subsidence and the coal fires of Jharia, with respiratory disease among mining communities.
- The National Mineral Policy of 1993 first asked for reclamation; the National Mineral Policy 2019 and District Mineral Foundations now require sustainable mining and restoration.
Industrial and atmospheric pollution
- Unplanned industrial growth and heavy traffic create severe air pollution.
- Main pollutants: CO₂, CO, nitrogen oxides, SO₂, hydrocarbons, particulates and metallic traces.
- Specific sources: cement and lime dust, urea dust from fertiliser plants, emissions from thermal power and brick kilns, crop-residue burning, and lead (now largely gone after unleaded petrol, 2000).
- Industrial wastes from fertiliser factories, paper mills, tanneries and distilleries are discharged into rivers, lakes and seas.
- The Central Pollution Control Board (2022) identified 311 polluted river stretches on 279 rivers.
- River action plans began with the Ganga Action Plan (1986) and now run through Namami Gange (2014), which has added sewage treatment capacity, though stretches near Kanpur, Varanasi and Kolkata remain critical.
Recent signals of imbalance in India
- Heat: 2024 was India’s warmest year since 1901; Churu touched 50.5 °C on 28 May 2024. Heatwaves have grown more frequent and longer since the 1980s.
- Mountain disasters: the South Lhonak GLOF (October 2023), the Joshimath subsidence (2023) and repeated monsoon landslides in Himachal Pradesh and Uttarakhand; outside the Himalaya, the Wayanad landslides (July 2024) in the Western Ghats.
- Air: winter smog over the Indo-Gangetic Plain and Delhi–NCR, from vehicles, industry, dust and crop burning, trapped by inversions.
Management of Ecological Imbalances
- Management aims to keep human use within ecological limits and to restore what has been degraded, through ecosystem management of whole systems rather than single resources.
Principles
- Prevention before cure: the precautionary principle and polluter pays principle.
- Ecosystem approach: manage whole watersheds, landscapes and seascapes, with people as part of them.
- Carrying capacity and limits: keep within planetary and regional boundaries.
- Restoration: reverse degradation, as in the UN Decade on Ecosystem Restoration (2021–2030).
- Equity: “common but differentiated responsibilities” between countries, and fairness to local communities.
- Integration: climate, biodiversity, land and water treated together, since their drivers are shared.
Levels of action
| Level | Measures | Examples |
|---|---|---|
| Global | Treaties, finance, technology transfer | Montreal Protocol; UNFCCC and Paris Agreement; CBD and Kunming–Montreal Framework; UNCCD; Ramsar; CITES |
| Regional and transboundary | Basin and regional programmes | Great Green Wall; North Aral restoration; Baltic Sea action plan; Hindu Kush Himalaya cooperation |
| National | Laws, policies, missions, monitoring | NAPCC; Green India Mission; Namami Gange; National Clean Air Programme; CAMPA; wetland rules |
| Local and community | Participation, rights, traditional knowledge | Joint Forest Management; sacred groves; Chipko; watershed committees |
- India’s main instruments:
- the environmental legislations and the National Green Tribunal;
- environmental impact assessment for projects;
- restoration of 26 million ha of degraded land by 2030;
- the Green Credit Programme (2023), MISHTI for mangroves (2023) and Amrit Dharohar for wetlands (2023);
- Mission LiFE.
Specific remedies
- Climate: emission cuts, renewable energy, efficiency, carbon pricing, protecting sinks, and adaptation (heat action plans such as Ahmedabad’s of 2013, early warning, resilient crops).
- Ozone: completing HCFC phase-out and the Kigali HFC phase-down; stopping illegal CFC emissions.
- Biodiversity: protected areas and corridors, 30×30, control of invasive species, community conservation.
- Land: watershed management, agroforestry, conservation agriculture, dune stabilisation, mine reclamation.
- Water: integrated water resource management, groundwater regulation, drip irrigation, wetland protection, environmental flows below dams.
- Pollution: cleaner fuels, effluent and sewage treatment, circular economy and extended producer responsibility.
- Knowledge: remote sensing and GIS monitoring, and environmental management tools such as audits and carrying-capacity studies.
Evaluation
- Successes: the Montreal Protocol shows that a global imbalance can be reversed. Forest cover has stabilised or grown in China and India, and local restoration in Niger, Sukhomajri and Ralegan Siddhi shows what communities can achieve.
- Failures and gaps:
- emissions are still near record highs;
- biodiversity targets for 2010 and 2020 (the Aichi targets) were largely missed;
- finance falls short;
- enforcement is weak;
- development projects often override environmental safeguards.
- The way forward lies in integrating environment into development planning, valuing ecosystem services, giving local communities rights and a stake, and acting on consumption as well as population, within the safe operating space defined by the planetary boundaries.
Previous Year Questions
2026“Anthropogenic impacts have caused major global and regional changes and imbalances in ecosystem.” Elucidate with examples.2023What are the factors affecting regional ecological changes ? How do these affect human health ?2022Sequential changes in land use and land cover have brought global and regional ecological changes and imbalances. Elucidate.2016Give a reasoned account on how the impact of Global Warming differs from one part of the Earth to the other.2012Answer the following: Programmes initiated by the International Council of Science on Earth system studies.2006Discuss the global ecological imbalances and their management.1989Examine the causes of ecological imbalances and briefly explain the measures taken to rectify them.





Good One!