

- A model is an idealised, simplified and structured representation of reality. It keeps what seems significant, leaves out the rest, and so makes a complex world easier to understand, test and predict.
- Geography needs models because the earth’s surface is too varied and too large to be grasped whole. Physical and cultural landscapes change in space and time, and geographical data keep growing.
- Richard J. Chorley and Peter Haggett’s Models in Geography (1967) made model-building a central programme of the discipline, and the quantitative revolution supplied the method.
- Most of this unit is a set of models, each simple, each useful and each open to criticism. Models also tie the branches of geography together, since the same forms recur in physical and human study.
Meaning of a Model

Definitions and Features
- Chorley and Haggett (1967): a simplified structure of reality that brings out, in general form, the features and relations thought significant. It may be a theory, law, hypothesis or structured idea.
- Russell L. Ackoff and colleagues (1962): a theory or law stated formally in the language of logic, sets and mathematics.
- David Harvey (1969): a formal representation of a theory.
- A narrower view treats any device that generates a prediction as a model. On this view modelling, like observation and experiment, is a way of testing theories.
| Feature | Meaning | Example |
|---|---|---|
| Selective | A partial picture; some features stressed, others dropped | Johann Heinrich von Thünen keeps distance and drops soil |
| Structured | Selected parts are shown through their connections | Alfred Weber’s triangle of material and market |
| Suggestive | Hints at extensions and predictions | William J. Reilly’s law leads to the breaking point |
| Approximate | Simple enough to use, complex enough to represent | Walt Whitman Rostow’s five stages |
| Analogical | Different from the real world, and likened to something familiar | Trips treated as gravity |
| Reapplicable | Conclusions return to the real world for checking | Walter Christaller tested in south Germany |
- A model is judged by whether it is appropriate, stimulating or significant, rather than true or false.
Theory, Law and Model
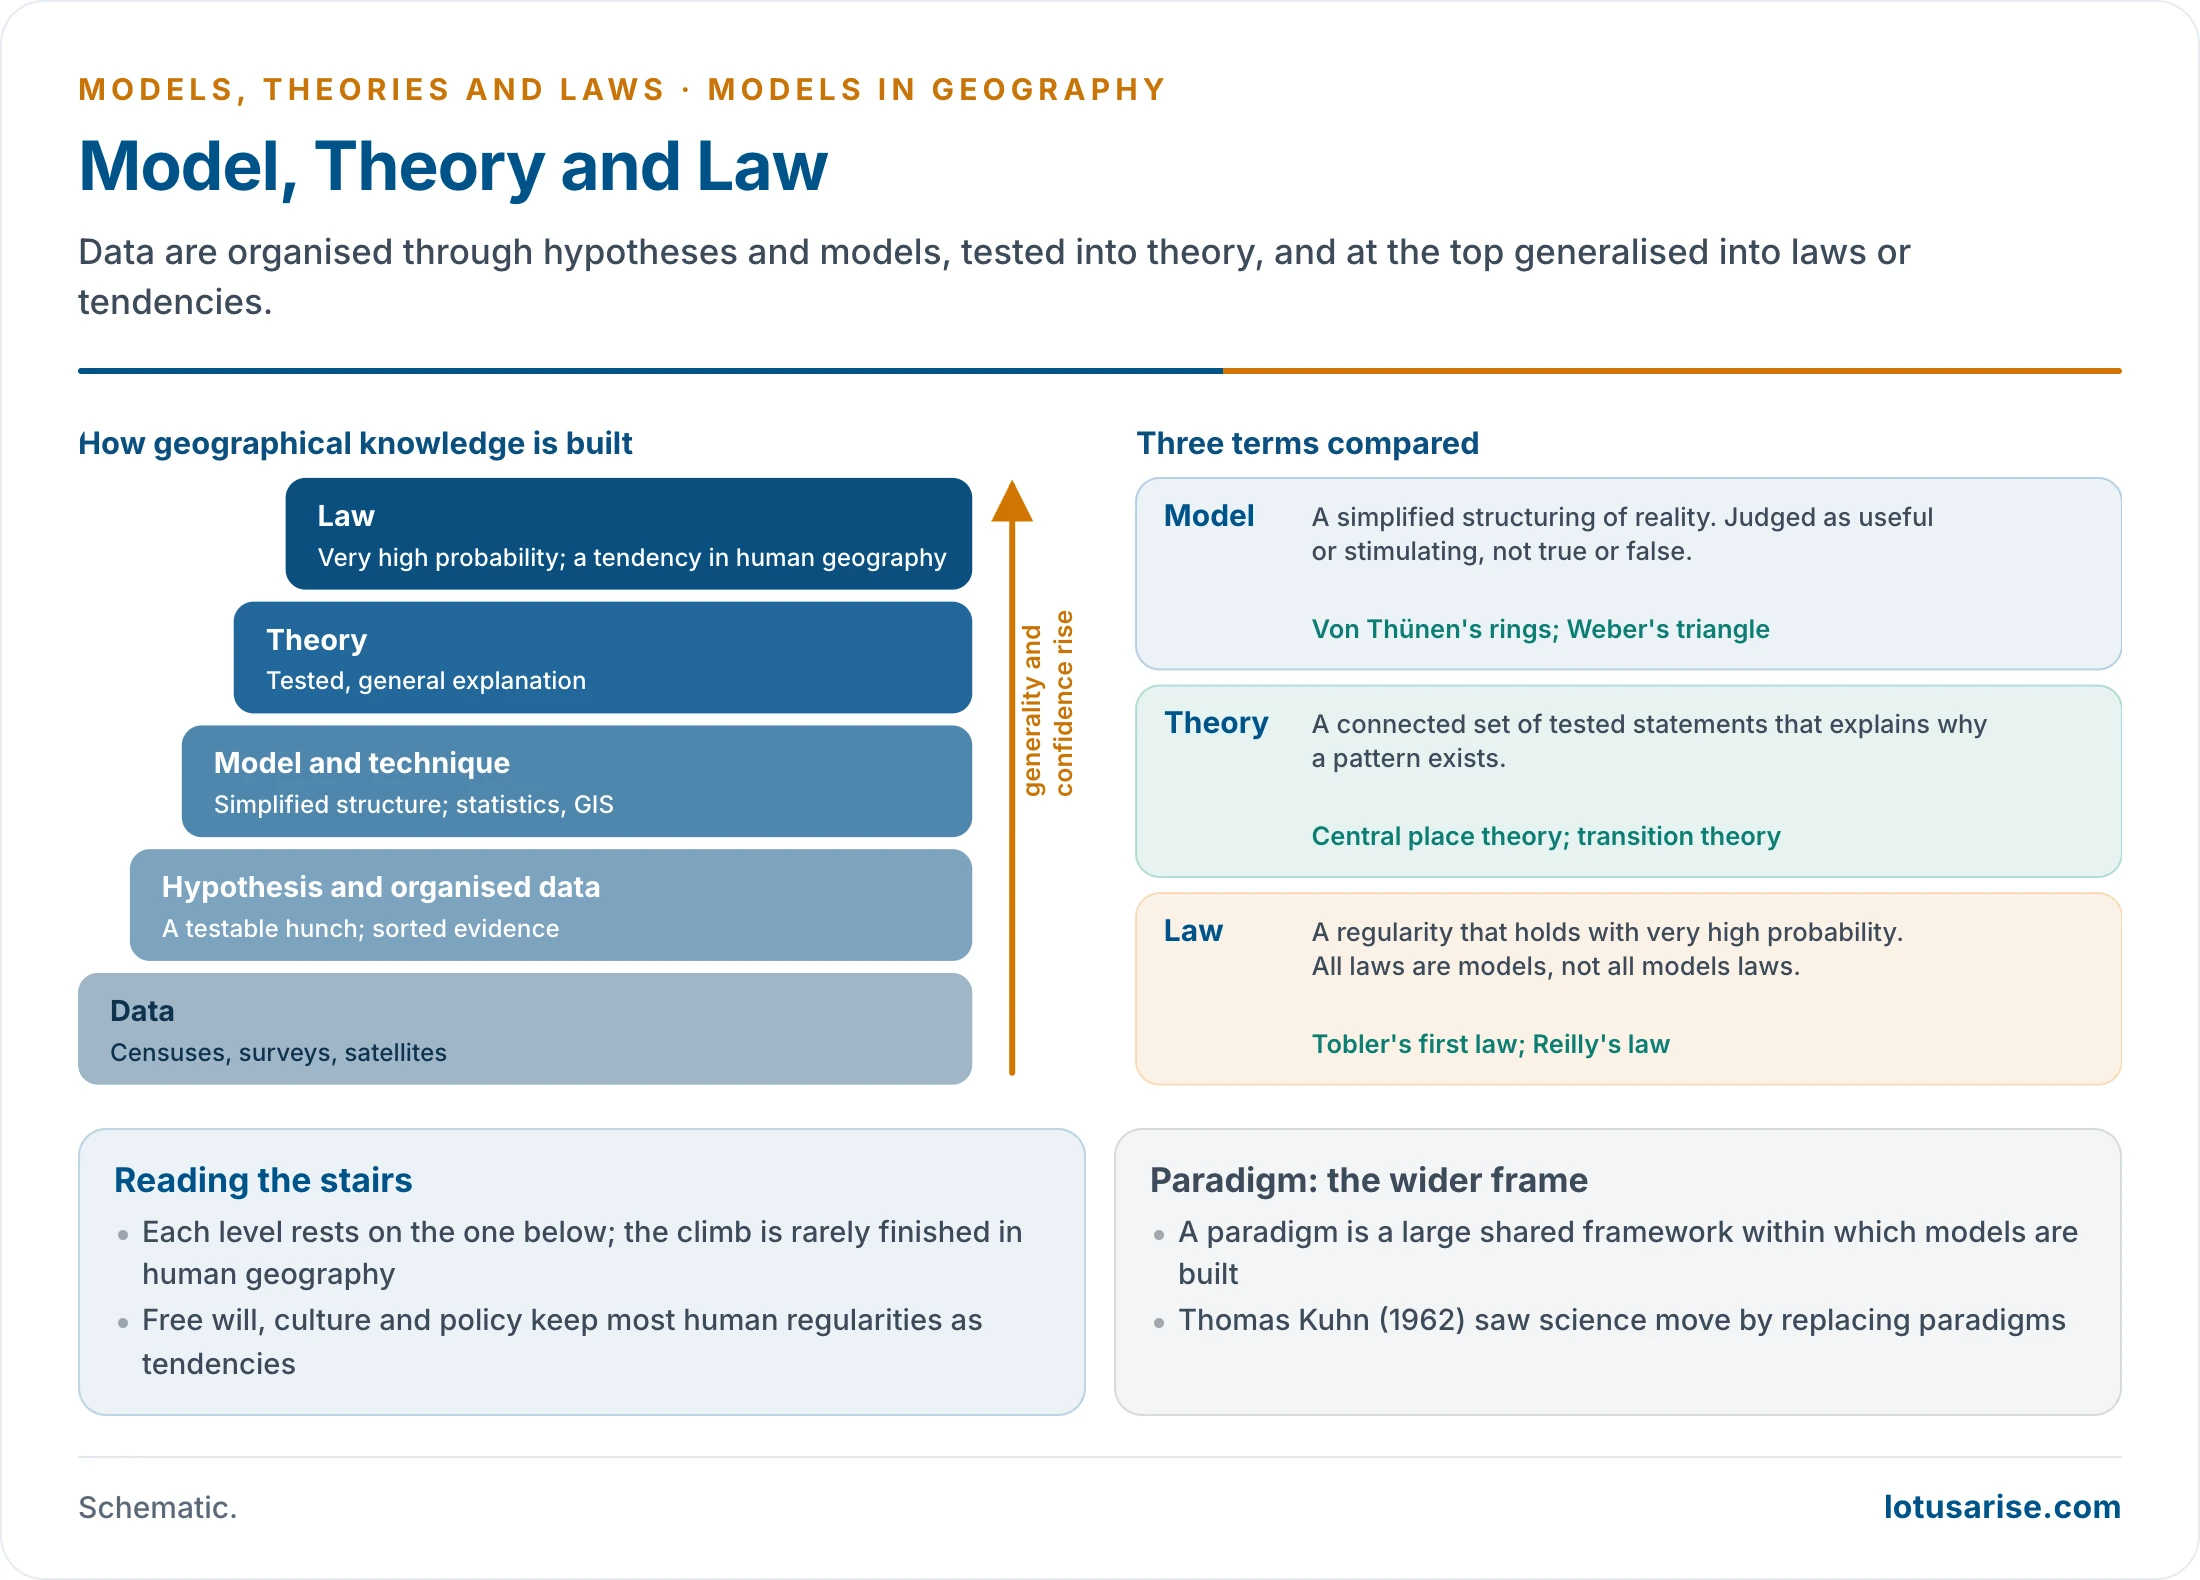
| Term | What it is | Standing | Geographical example |
|---|---|---|---|
| Hypothesis | A testable statement | Tentative | Trade falls with distance |
| Model | Simplified structure of reality | A tool, judged by usefulness | Von Thünen’s rings |
| Theory | Connected, tested statements that explain | Survives repeated testing | Central place theory |
| Law | A regularity of very high probability | Most general; a tendency in human geography | Waldo Tobler’s first law (1970), Ernst Georg Ravenstein’s laws |
| Paradigm | Shared framework for a research community | A “super-model” that frames others | Spatial science after Thomas Kuhn (1962) |
- All laws are models, but not all models are laws. A model and a theory may differ only in how reliably they predict.
- A building of knowledge: data form the base, then data organised for analysis, then techniques, then theories and models, with laws at the top. Each level rests on the one below.
- The debate over laws: Fred K. Schaefer (1953) and William Bunge (Theoretical Geography, 1962) argued that geography could seek laws of spatial arrangement like other sciences. Since free will, culture and policy intervene, human geography’s laws remain statements of tendency.
- A logical conclusion from a model does not depend on place or date. Its assumptions do, which is why a valid model can still mislead when applied elsewhere.
Types of Models
Classifications
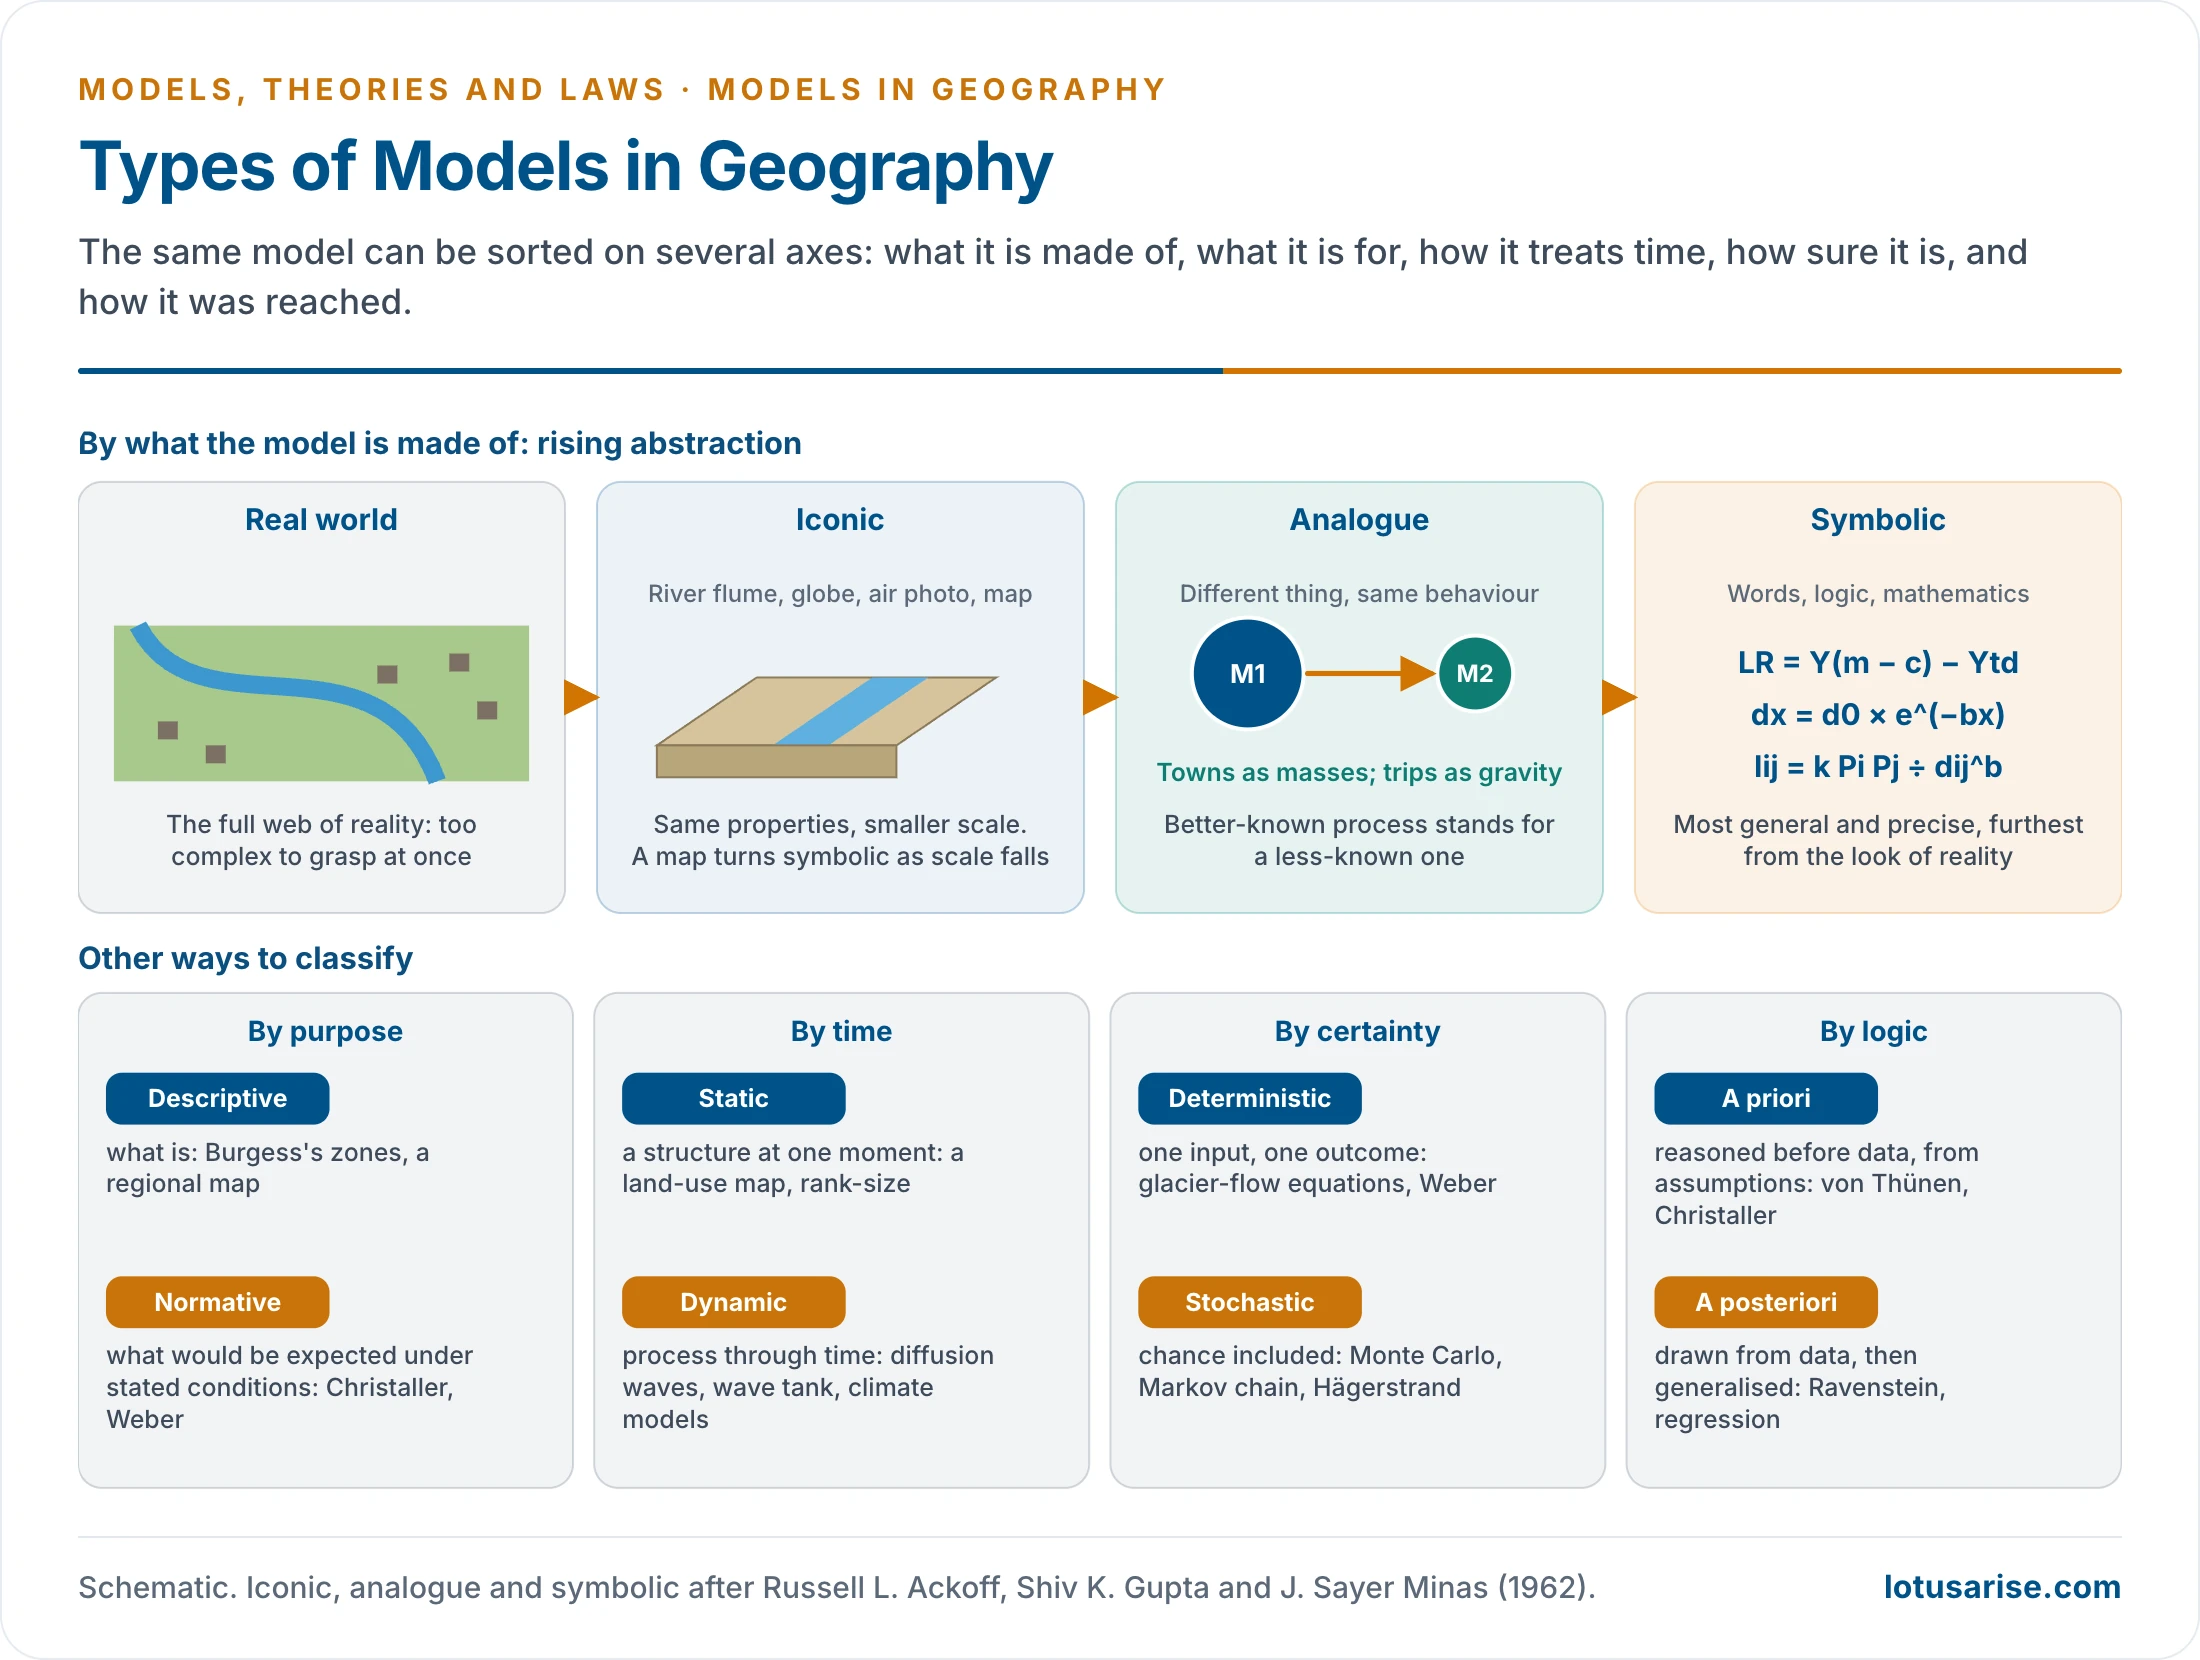
- The word is used so widely that no single classification is clean. A model is best placed on several axes at once.
| Basis | Types | Meaning | Example |
|---|---|---|---|
| Material | Iconic (scale, hardware) | Same properties, smaller scale | River flume, wave tank, globe, relief model, air photograph |
| Material | Analogue | Real properties shown by different ones | Gravity for trips; hydraulics for flows |
| Material | Symbolic (theoretical, mathematical) | Verbal or mathematical statement in logical terms | LR = Y(m − c) − Ytd |
| Purpose | Descriptive | Stylised account of what is; may be classificatory | Ernest W. Burgess’s zones, climatic classification |
| Purpose | Normative | What would be expected under stated conditions; strongly predictive | Christaller, Weber |
| Time | Static | Structure at one moment | Land-use map, rank-size |
| Time | Dynamic | Process through time; historical where time is stressed | Diffusion, wave tank, transition stages |
| Certainty | Deterministic | Fixed outcome for given inputs | Glacier-flow equations |
| Certainty | Stochastic | Chance built in | Monte Carlo diffusion, Markov chain |
| Logic | A priori | Reasoned from assumptions before data | Von Thünen, Christaller |
| Logic | A posteriori | Generalised from data | Ravenstein’s laws, regression |
| System view | Black box to white box | From input–output only to full internal detail | Gravity model is close to a black box |
Main Families
- Scale models copy reality at a smaller size and let one variable change at a time.
- In a wave tank, beach slope can be tested against sediment size, wave length and steepness, with the other two held constant. A flume does the same for meanders.
- Their weakness is scale: scaled-down sand becomes silt, which behaves differently under waves.
- Engineers still build them before dams, canals and harbour works.
- Maps are the most familiar models, and grow more abstract as scale falls.
- The sequence runs from the stereo air photograph, nearly a true scale model, to the large-scale map, then the small-scale symbolic map, then the cartogram where area is drawn to show population.
- They show large areas at once, yet flat projection always distorts area, distance or direction.
- Simulation and stochastic models imitate a process with random choices within set rules.
- Torsten Hägerstrand’s diffusion waves are the classic case: chance decides each move, and barriers slow the spread. Disease and farm innovations have been modelled this way.
- In a Monte Carlo model chance alone decides each move. In a Markov chain each move depends partly on the last. Random-walk drainage patterns and coastal spits have been simulated like this.
- Mathematical models fall into two groups.
- In physical geography they derive from known physical laws. John F. Nye’s glacier-flow equations are checked against field measurements, then used for parts of a glacier that cannot be measured.
- In human geography they are often empirical regularities, such as the rank-size rule, or optimising tools such as linear programming.
- Analogue models study the less known through the better known. The common elements are the positive analogy, the differences the negative analogy.
- James Hutton (1795) likened the circulation of matter to that of blood. William Morris Davis’s cycle gave landscapes a life history, and Friedrich Ratzel made the state an organism.
- Kinetic-wave theory applies equally to traffic, floods and glacier surges, all one-dimensional flows. The gravity model is the best-known case in human geography.
- Conceptual models deduce forms from stated assumptions and match them against the ground, as with wave-cut platforms under rising sea level or slope profiles through time.
Building and Using Models
The Model-Building Cycle
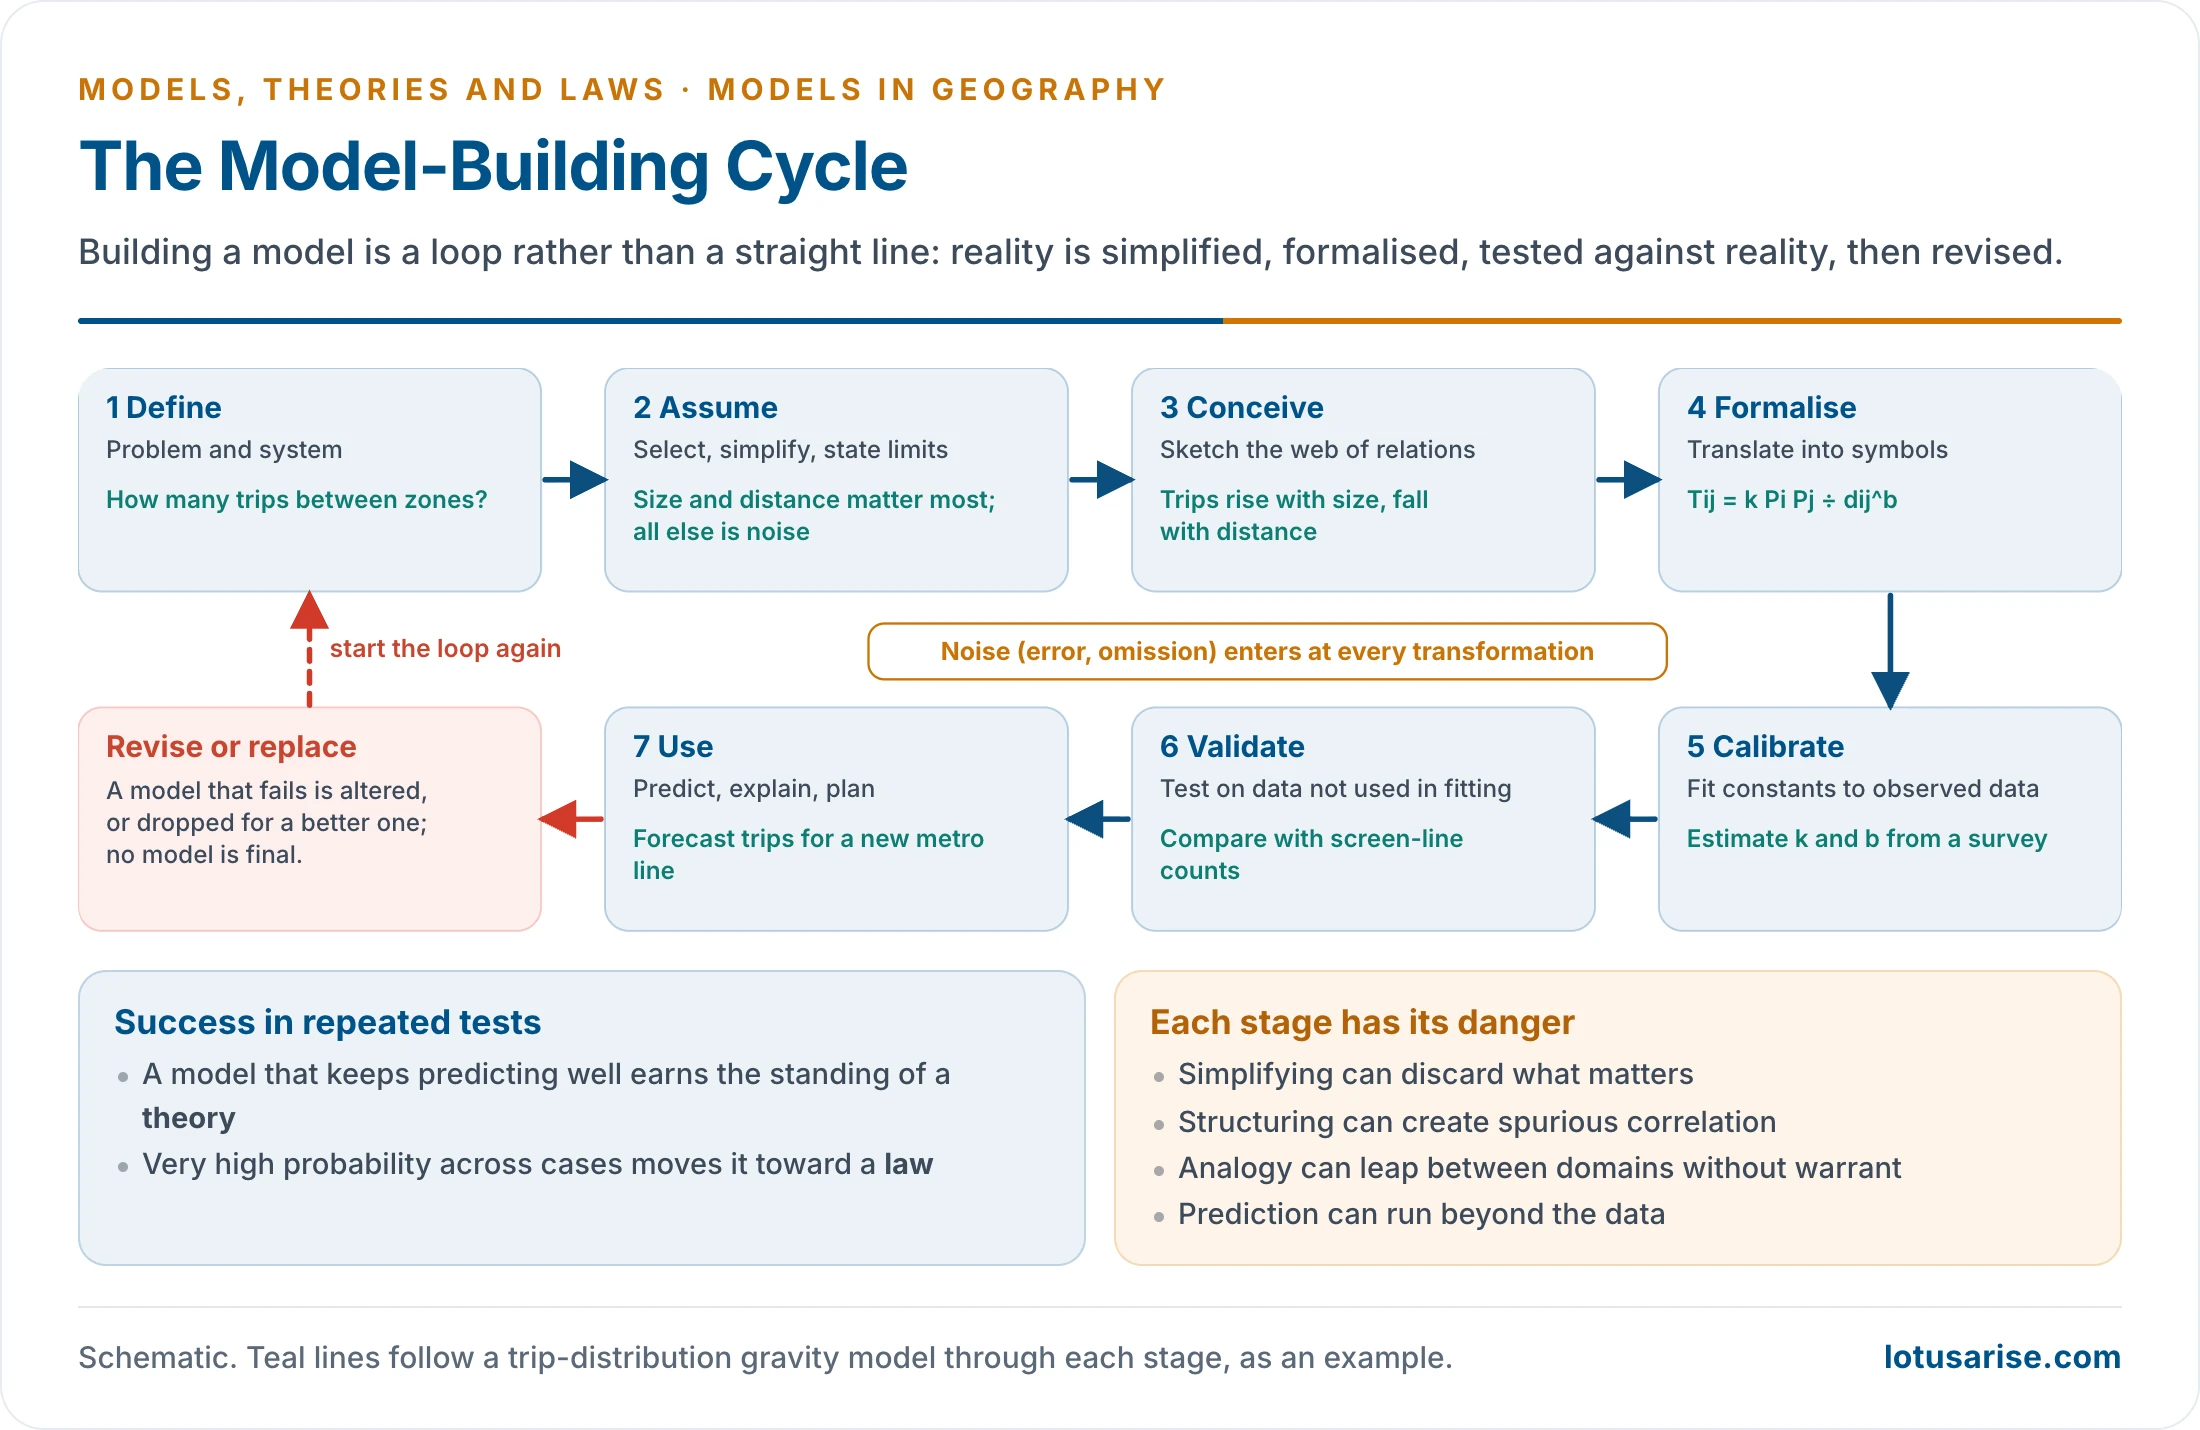
- Chorley’s sequence of idealisation, conceptual model, simplified model and translation is set out with the quantitative revolution. In working form it is a loop:
- Define the problem and the system.
- Assume: select variables and state simplifications.
- Conceive the web of relations.
- Formalise it in words, a diagram or an equation.
- Calibrate constants on observed data.
- Validate on data not used in fitting.
- Use it to explain, predict or plan.
- Revise or replace it when it fails.
- Noise enters at every transformation. A model should be simple enough to handle, yet not so simple that it loses the thing it was built to explain.
The Unit’s Own Models
| Model | Author, year | Type | Simplifying assumption | Main limit |
|---|---|---|---|---|
| Agricultural location | Johann Heinrich von Thünen, 1826 | Normative, a priori, static | Isolated state, uniform plain | Technology shrinks distance |
| Industrial location | Alfred Weber, 1909 | Normative, deterministic | Least cost decides | Ignores demand and behaviour |
| Central places | Walter Christaller, 1933; August Lösch, 1940 | Normative, a priori | Isotropic plain, rational actors | Rarely met on the ground |
| Location theories compared | Harold Hotelling to Allan Pred | Mixed | Varies by model | Corporate networks elude them |
| Gravity | William J. Reilly, 1931 and others | Analogue, mathematical | Size and distance suffice | Says how much, not why |
| Migration laws | Ernst Georg Ravenstein, 1885 | A posteriori, descriptive | British census regularities | Little on motive |
| Population and food | Thomas Robert Malthus, 1798 | Normative, verbal | Geometric against arithmetic growth | Technology upset it |
| Surplus population | Karl Marx, 1867 | Conceptual, structural | Capital creates surplus labour | Weak on fertility |
| Demographic transition | Warren S. Thompson, 1929; Frank W. Notestein, 1945 | Descriptive, dynamic | Stages follow modernisation | Eurocentric sequence |
| Stages of growth | Walt Whitman Rostow, 1960 | Descriptive, dynamic | One path for all nations | Unilinear |
| Growth pole | François Perroux, 1955 | Conceptual, dynamic | Propulsive firms spread growth | Backwash effects |
| Limits to Growth | Donella Meadows and others, 1972 | Simulation, dynamic | Feedback in world variables | Weak on price and technology |
| Heartland and Rimland | Halford John Mackinder, 1904; Nicholas John Spykman, 1944 | Conceptual, static | Geography sets power | Determinist |
| Sea power | Alfred Thayer Mahan, 1890 | Conceptual, historical | Six conditions decide | Drawn from one era |
| Organic state | Friedrich Ratzel, 1897 | Analogue | State as organism | Misused for expansion |
| Systems | Ludwig von Bertalanffy, 1950 | General framework | Parts interact through flows | Mechanistic |
Uses
- Simplify and visualise what is too large or complex to grasp: the psychological function.
- Organise data: a framework to define, collect, tabulate and analyse, drawing the most from the evidence.
- Explain how a pattern comes about, and improve understanding of cause and of links between micro and macro.
- Compare a real pattern with an ideal one, as with the rank-size expectation against a primate city. Departures become questions.
- Act as a laboratory: test systems that cannot be observed directly and estimate the effect of change.
- Measure the unobserved: estimate, interpolate, forecast and simulate.
- Predict and plan: population, land use, cropping, migration, urban growth, weather, sea level, erosion.
- In India, travel models size metro lines and bus networks, density and rank-size expectations test urban hierarchies, and breaking points and Thiessen polygons help draw functional regions.
- Standardise comparison: a model gives one yardstick for many places. A density gradient or a rank-size slope lets Kolkata be set beside Chennai, or 1951 beside 2011.
- Build theory: models are stepping stones to theories and laws, and a shared, economical language.
- Unify the discipline: the same models reach many branches.
Critique
- Badly made: too much simplification misleads, and too little explains nothing. Some models built with heavy techniques are more complicated than the data.
- Wrong focus: salient points may be left out, and modelling can over-emphasise what is measurable.
- Not for everything: cultural, regional and historical geography may be distorted when general models are forced on unique cases and generalised from a few.
- Human values: belief, emotion, attitude, hope and fear do not fit equations. Behavioural and humanistic geographers reject economic man and the featureless plain.
- Power and history: radical geographers argue that models treat class outcomes as natural patterns. David Harvey’s own Social Justice and the City (1973) marks the turn.
- Mathematics as a barrier: students, policy-makers and the public may not follow them, and misuse is hard to detect.
- Never final: every model needs continuous testing and replacement. Paul Feyerabend (1975) held that knowledge grows by competing alternatives, and progress comes through crisis as well as accretion.
- Weak data: reliable data are scarce in developing countries, which yields distorted results.
- Eurocentric origin: most models were built on a century or so of European and North American data. Treated as universal, they can mislead elsewhere, as Rostow’s path and Burgess’s zones show in India.
- Planning failures: Douglass B. Lee’s “Requiem for Large-Scale Models” (1973) found that urban models met none of their goals.
- Pitfalls by feature: simplification can throw out what matters, structuring can create false correlation, suggestion can invite improper prediction, approximation can drift into unreality, and analogy can make unjustified leaps.
- The reply: in the words of George E. P. Box (1979), “all models are wrong but some are useful”. The answer to misuse is care and testing, not abandoning them.
Models Today: GIS and Simulation
- Models did not end with the quantitative revolution. They have moved into computers and joined with spatial data.
| Family | How it works | Example |
|---|---|---|
| GIS overlay and spatial statistics | Layers combined and tested | Site suitability, flood risk, Thiessen polygons |
| Cellular automata | Each cell changes by rules based on its neighbours | SLEUTH urban growth model (Keith Clarke and others, 1997) |
| Agent-based | Individuals follow rules and patterns emerge | Thomas Schelling’s segregation model (1971) |
| Earth system | Coupled equations for air, ocean, ice, land and life | Climate projections |
| Machine learning | Patterns learned from large data | Land-cover mapping |
| Digital twin | Live virtual copy of a city fed by sensors | National Digital Twin target |
- Indian examples:
- Bharat Forecast System, developed by IITM Pune and launched on 26 May 2025, runs a global weather model at 6 km in place of 12 km.
- IITM Earth System Model, India’s first, was used in the IPCC’s Sixth Assessment Report.
- Urban growth simulation: SLEUTH and Markov–cellular automata models tested on Lucknow, and agent-based models on Bhopal, project built-up expansion from satellite data.
- National Geospatial Policy 2022 aims at a National Digital Twin of major urban centres by 2035.
- What GIS changed: space is handled cell by cell, not as a plain, so real terrain, roads and rules can enter the model. Calibration and validation run on satellite time series, and maps of outcomes make results easier to test on the ground.
- Old questions return: deep learning can predict without explaining, a black box in sharper form. Data from phones and platforms carry bias, and code embeds assumptions just as the isotropic plain did.
Previous Year Questions
2018Discuss critically the manner in which the quantitative revolution provided the methodological foundation for models and modelling in geography.2014Critically analyse application of models in Geography.2009‘Quantitative Revolution and model building provided an empirical basis for geographical research’ – Elaborate.1994Write short note: Models in Geography.




