

- Von Thünen’s theory of agricultural location explains why land use changes with distance from a market. It is the earliest systematic model of land use in economic terms and the founding statement of agricultural location theory.
- It was set out by Johann Heinrich von Thünen (1783–1850), a German landowner and economist, in Der isolirte Staat (The Isolated State). Part I appeared in 1826; later parts followed in 1850 and 1863.
- Its core claim: on a uniform plain around one city, transport cost alone sorts farming into concentric rings, with intensive and perishable production near the city and extensive production far from it.
- David Ricardo explained economic rent through differences in fertility. Von Thünen’s great addition is locational rent: rent that arises from position alone, even where all land is equally fertile.
The Model

Background
- Von Thünen bought the Tellow estate near Teterow in Mecklenburg in 1809 and farmed it until his death.
- From 1810 he kept detailed cost accounts of the estate. About forty years of this practical data lie behind the theory, so the abstract model rests on real costs and yields.
- He used isolating abstraction: hold everything constant except one variable and watch what it does.
- He also reasoned at the margin, which makes him a pioneer of marginal analysis in economics as well as of spatial economics.
- The work reached most geographers through Peter Hall’s edited English translation (1966), during the quantitative revolution. It then became one of the anchors of locational analysis.
Aims
- To explain why and how agricultural land use varies with distance from the market.
- To rank crops by their profit-making capacity at each distance.
- To show how transport cost fixes the best zone for each crop.
- To introduce locational rent as the driver of land-use decisions in space.
Key Terms
| Term | Meaning |
|---|---|
| Isolated state | One city with its hinterland, cut off from the outside world by wilderness |
| Isotropic surface | A uniform plain, the same in terrain, soil and climate in every direction |
| Hinterland | The farming area that surrounds and supplies the market city |
| Crop productivity | Agricultural output per unit of input on a given area |
| Intensive farming | Heavy inputs of money, fertiliser and labour for high yield per unit area; two or more crops a year |
| Extensive farming | Low inputs over a large area with lower yield; fewer than two crops a year |
| Mixed cropping | Two or more crops grown together on the same land (wheat and gram) |
| Economic rent (Ricardo) | Net income from a piece of land above that of land at the margin of cultivation |
| Locational rent (von Thünen) | Economic rent that depends on a plot’s position relative to the market |
| Distance decay | The fall in land rent away from the market; its rate differs by commodity |
Assumptions
- One market: the isolated state has a single city and its agricultural hinterland, with no counter-magnet nearby.
- Closed exchange: the city buys only from the hinterland, and the hinterland sells only to the city.
- Same price for all: every farmer gets the same market price for a given crop.
- Isotropic plain: a uniform physical environment around the city, with no river or mountain.
- Economic man: farmers maximise profit and know the market’s needs fully.
- One mode of transport: the horse-drawn wagon, moving at walking pace on poor roads.
- Linear freight: transport cost rises directly with distance and with the weight of the produce.
Two Postulates
- The intensity of production of a crop falls with distance from the market. Intensity means the amount of input per unit of land.
- The type of land use changes with distance from the market.
- From these he derived the land-use pattern that gives each farmer the highest return. The model therefore has two linked parts: agricultural land use and economic rent.
Locational Rent
- All farmers receive the same price and bear the same production cost, so the only advantage one plot has over another is its position. A plot close to the market saves freight, and that saving is its rent.
- In the form given by Edgar S. Dunn (1954):
- LR = Y(m − c) − Ytd
| Symbol | Stands for | Explanation |
|---|---|---|
| LR | Locational rent | Net return per unit of land after production and freight costs |
| Y | Yield | Output per unit of land |
| m | Market price | Price per unit of output at the city |
| c | Production cost | Cost of producing each unit of output |
| t | Transport rate | Cost of moving one unit of output over one unit of distance |
| d | Distance | Distance between the farm and the market |
- Locational rent differs from economic rent in one respect: it ignores opportunity cost, that is, what the land could earn in another use.
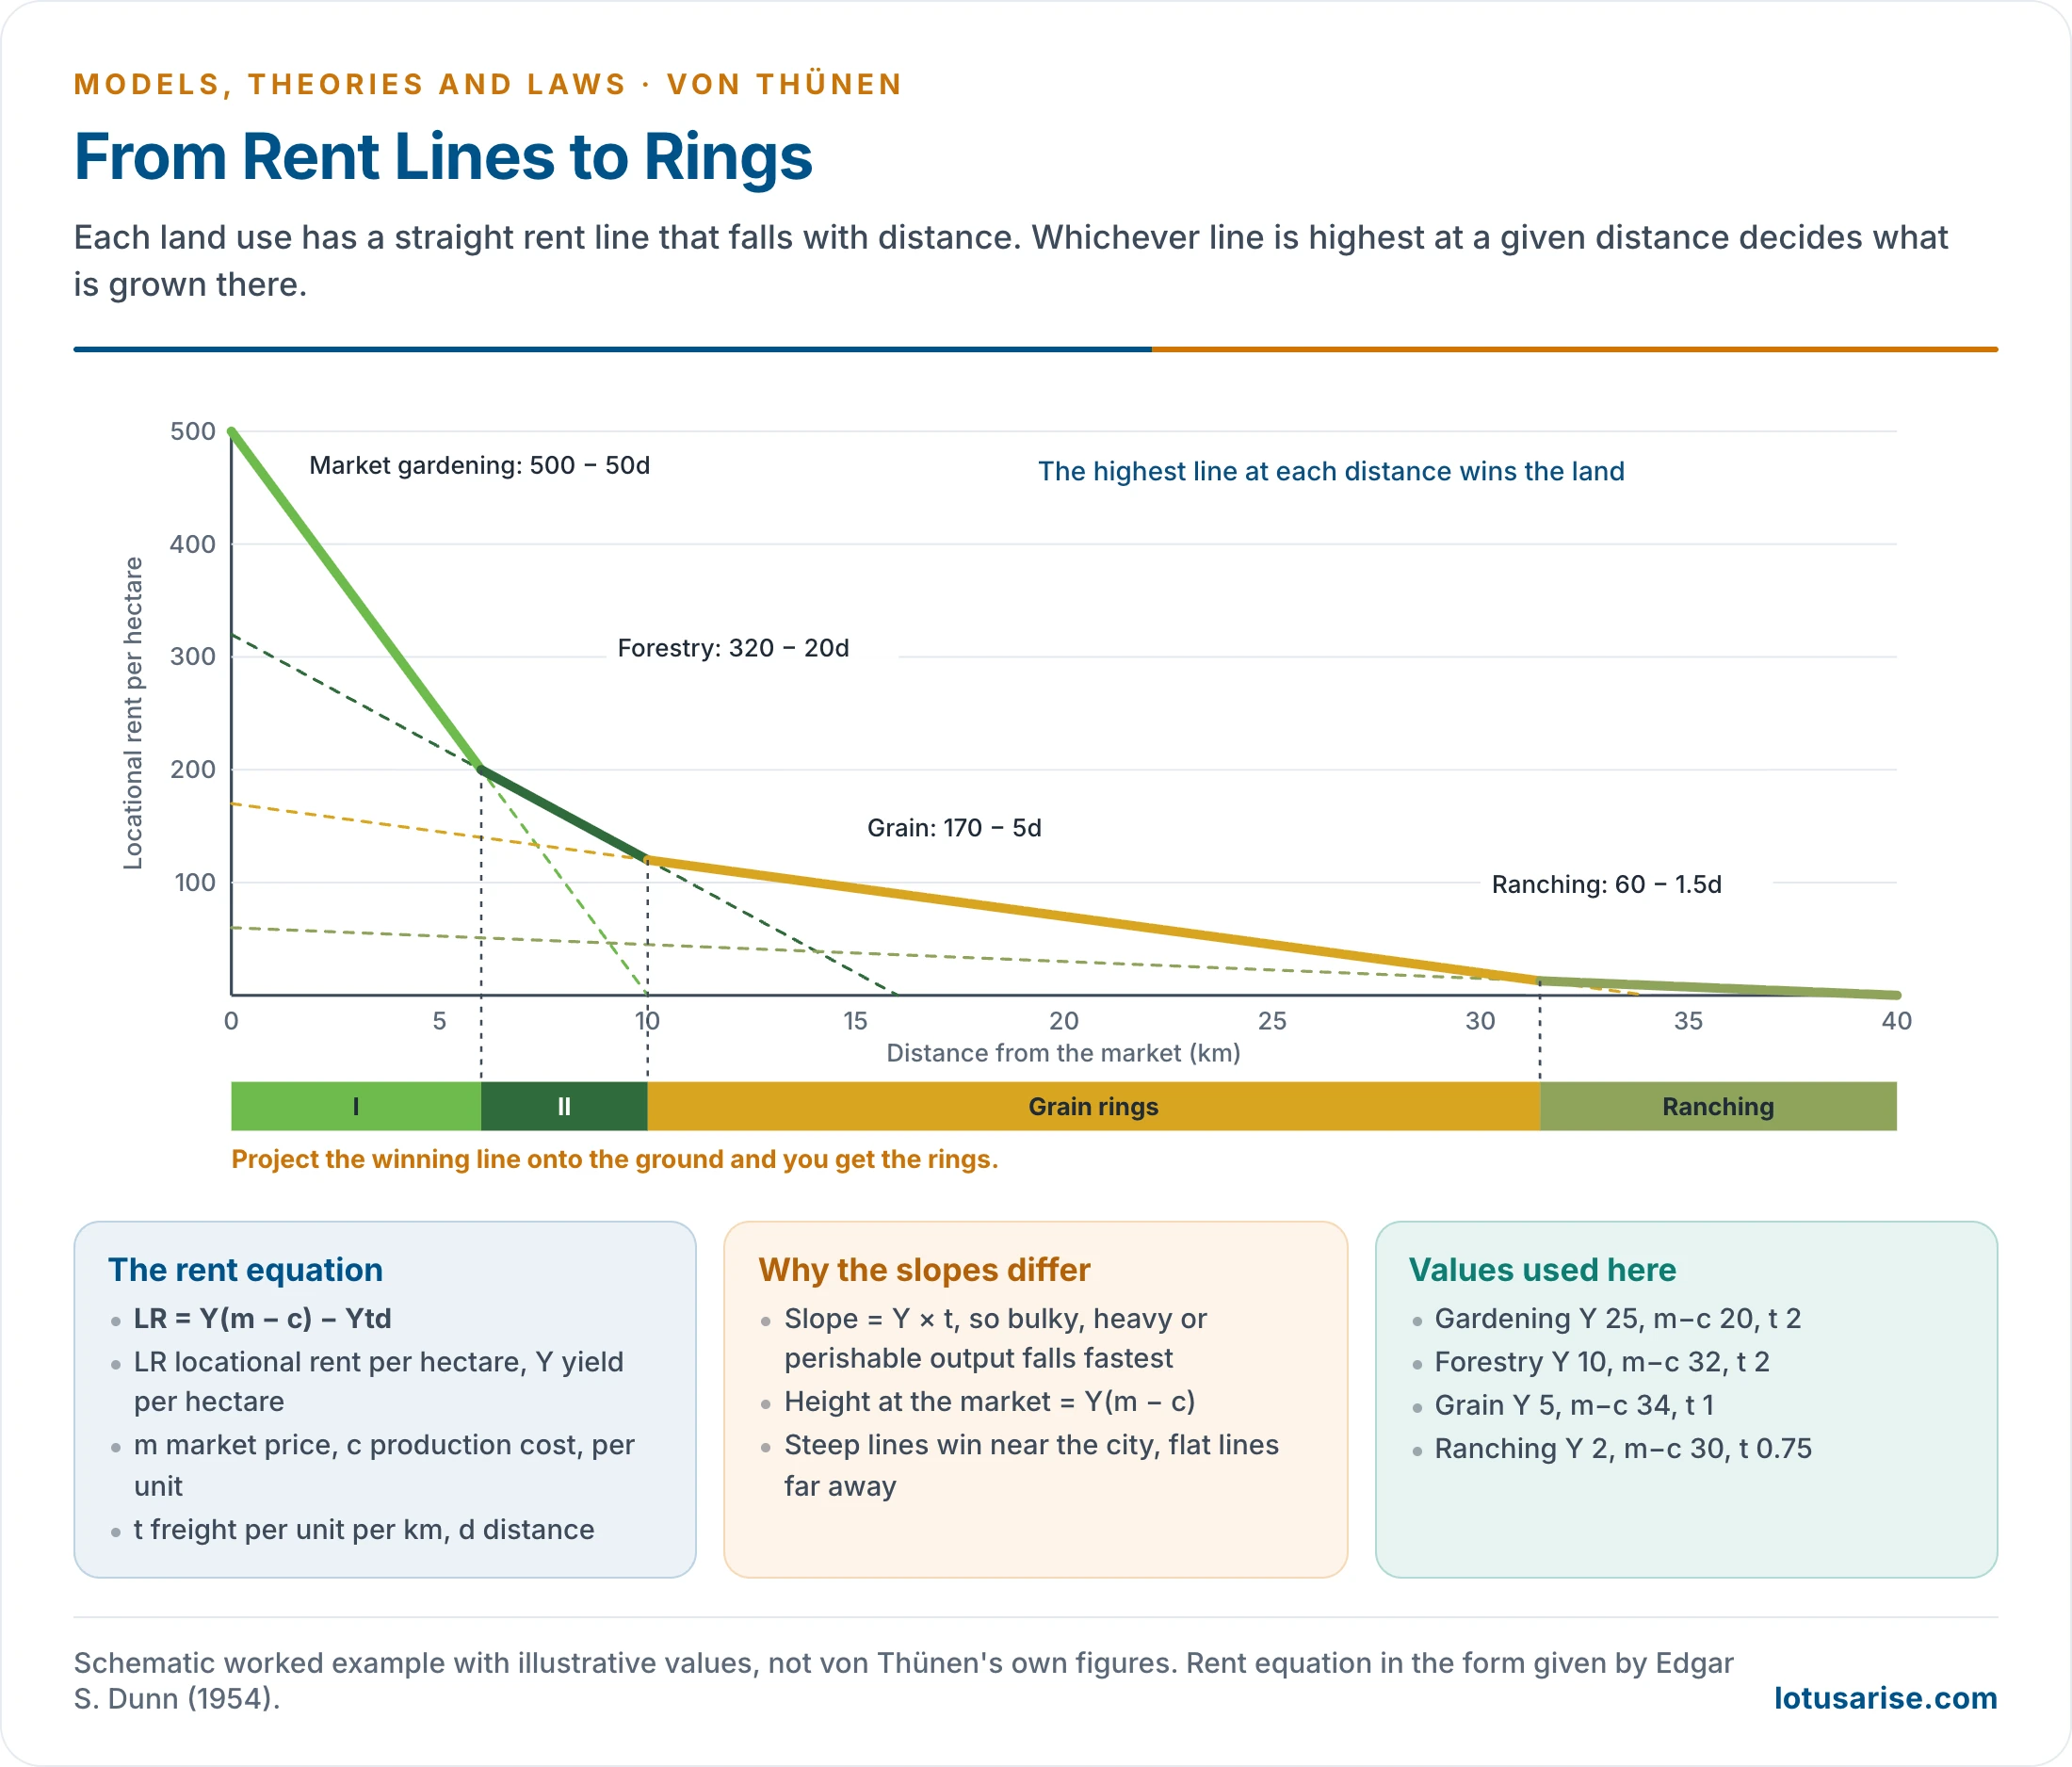
- In the simplest case, freight is the only variable. Rent falls in a straight line with distance, and the slope equals Y × t.
- The slope is steepest for bulky or perishable goods such as timber and dairy produce.
- Each land use has its own line. Farmers choose whichever gives the highest rent at their distance, and the crossing points become the ring boundaries.
- A worked example (illustrative values):
- Market gardening with Y = 25, m − c = 20 and t = 2 gives LR = 500 − 50d. Forestry with Y = 10, m − c = 32 and t = 2 gives LR = 320 − 20d.
- The two are equal at d = 6 km, where each earns 200. Inside 6 km gardening pays more; beyond it, forestry does. That point is the boundary between Zones I and II.
- The result is a rent gradient that declines outward. Lines of equal rent around the city are called iso-rent lines.
Intensity Theory
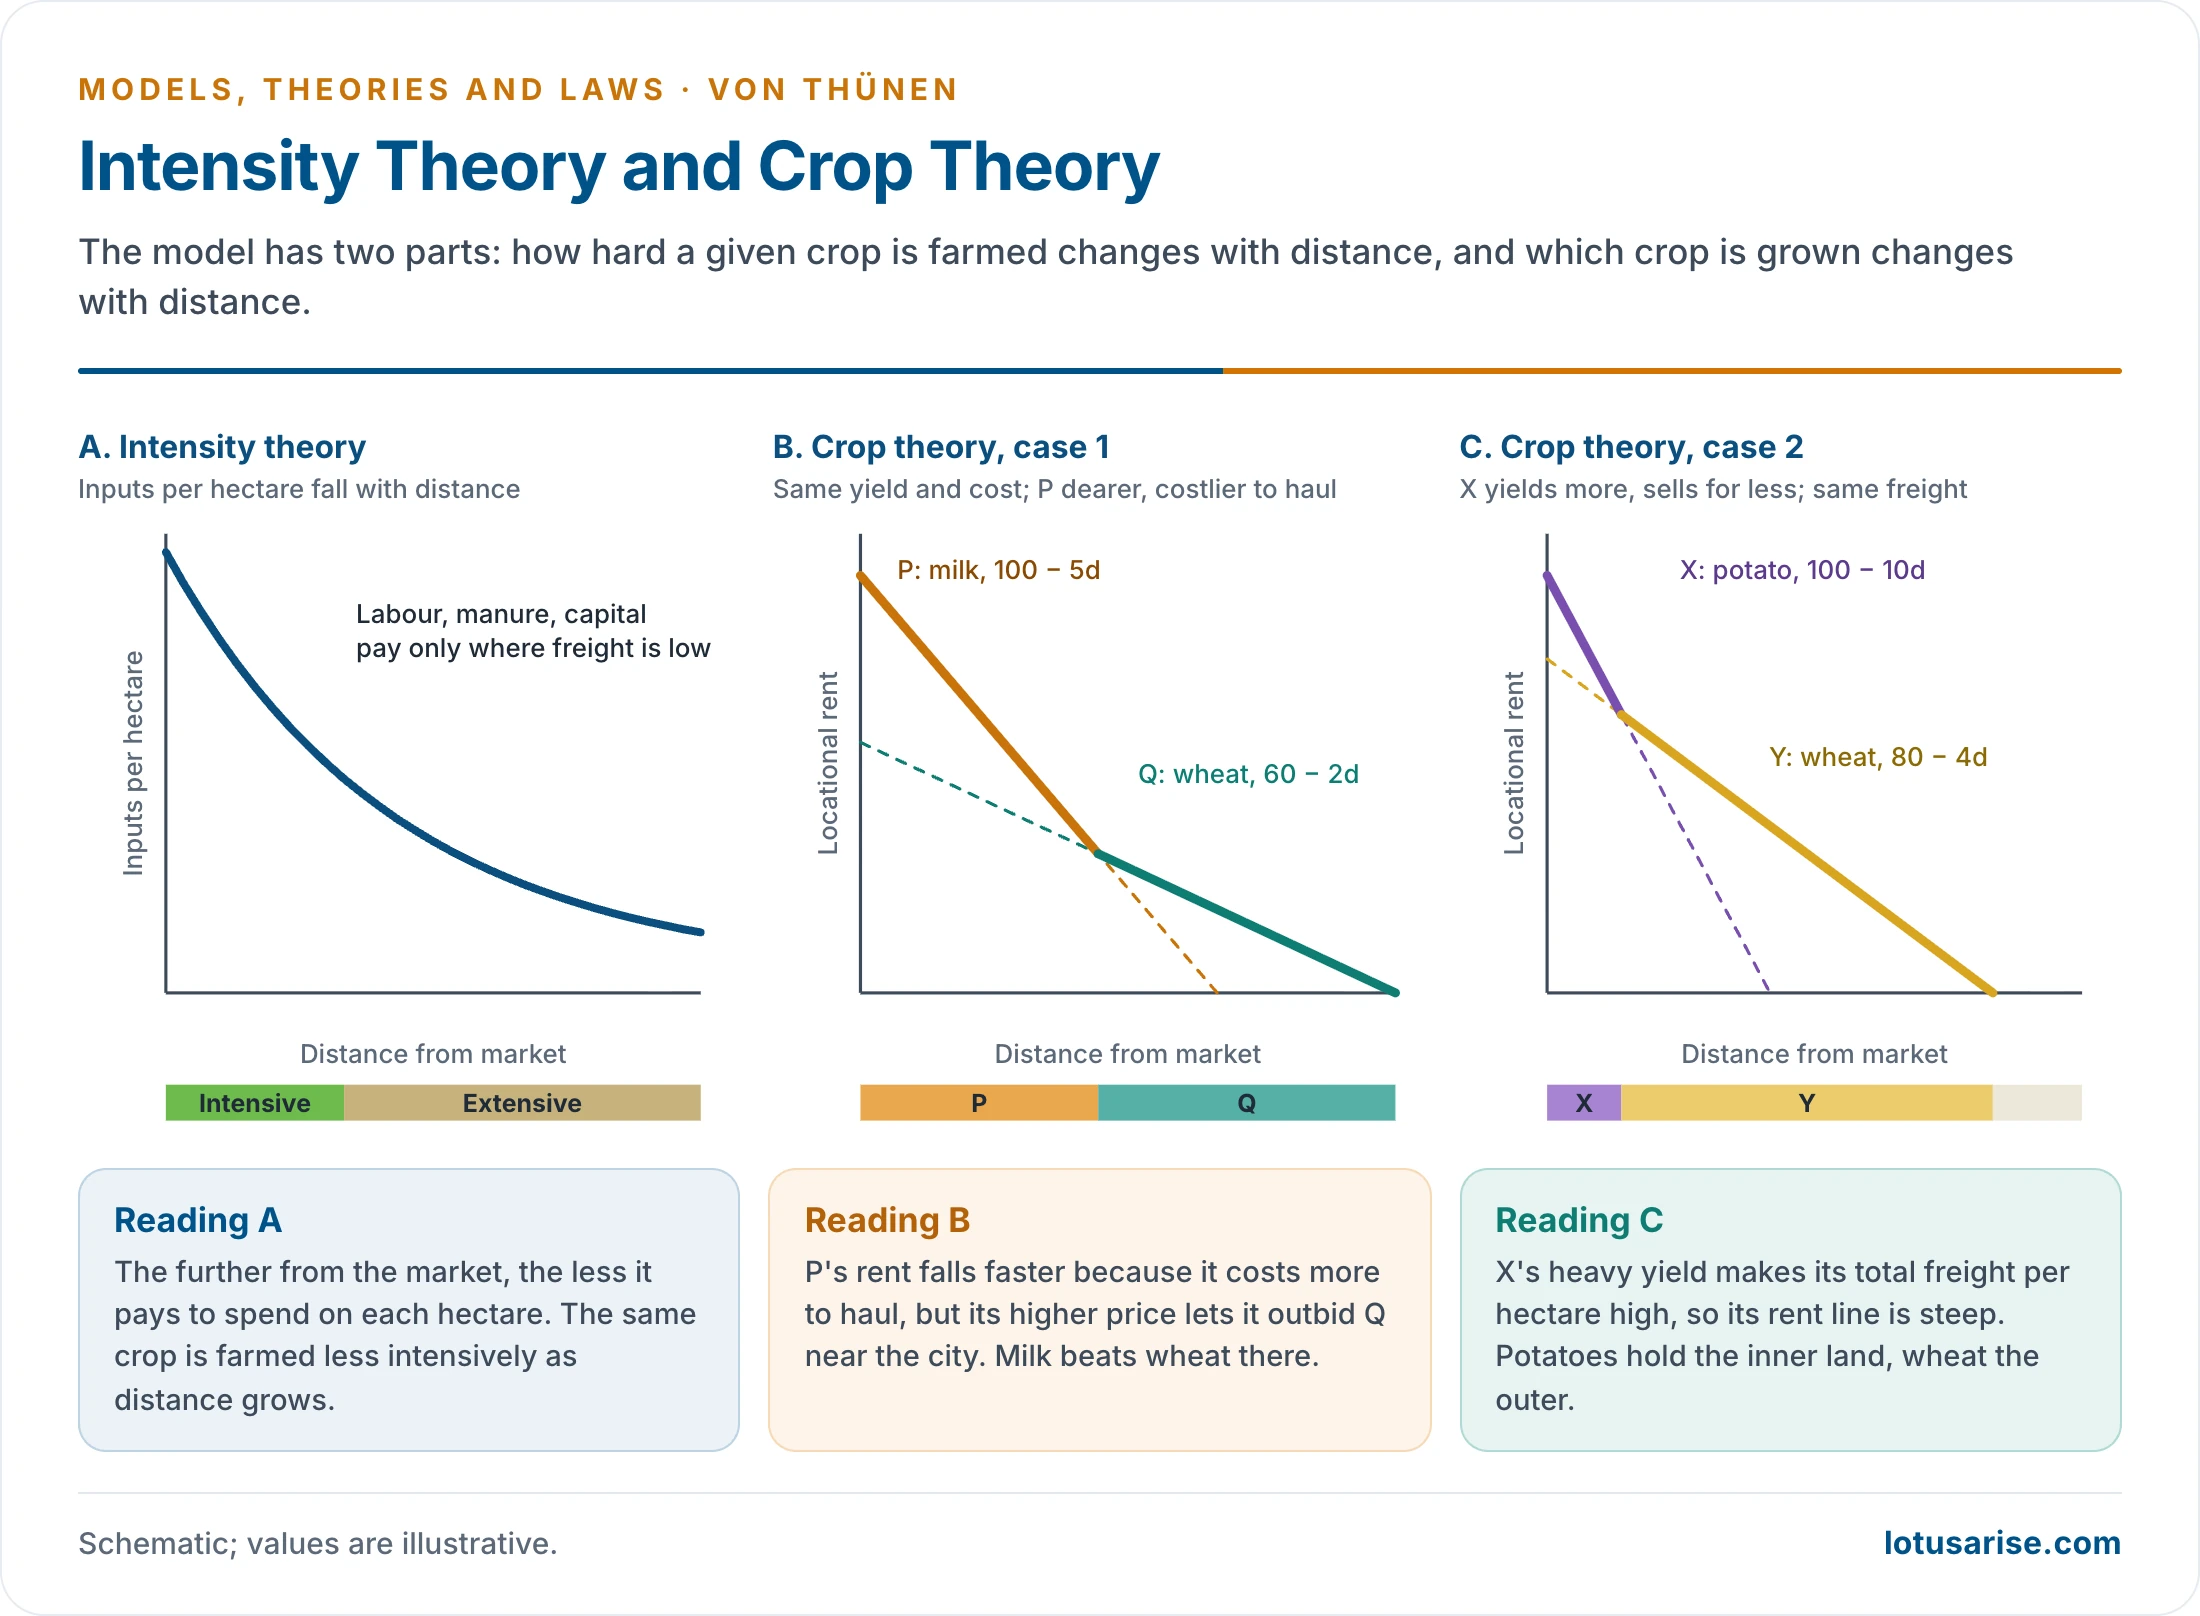
- Freight rises with distance, so intensive cultivation suits land near the city. The intensity of production of any one crop declines as distance grows.
- The more money, labour and fertiliser applied, the higher the intensity. That extra spending pays only where freight is low and the land dear.
Crop Theory
- Land use varies with distance because of four things: market price, transport cost, production cost and yield. Two cases show how.
- Case 1: same yield and production cost, different freight and price.
- If crop P costs more to haul and sells for more than crop Q, then P grows nearer the market. Its rent falls faster, but its higher price wins the inner land.
- Fresh milk and wheat are the example. Milk is perishable and bulky, so it stays next to the city.
- Case 2: same production cost and freight rate, different yield and price.
- If crop X yields more and sells for less than crop Y, then X grows nearer the market. Its large tonnage makes total freight per hectare high, so its rent line is steep.
- Potatoes and wheat are the example. Potatoes pay best close in, wheat further out.
The Six Concentric Rings
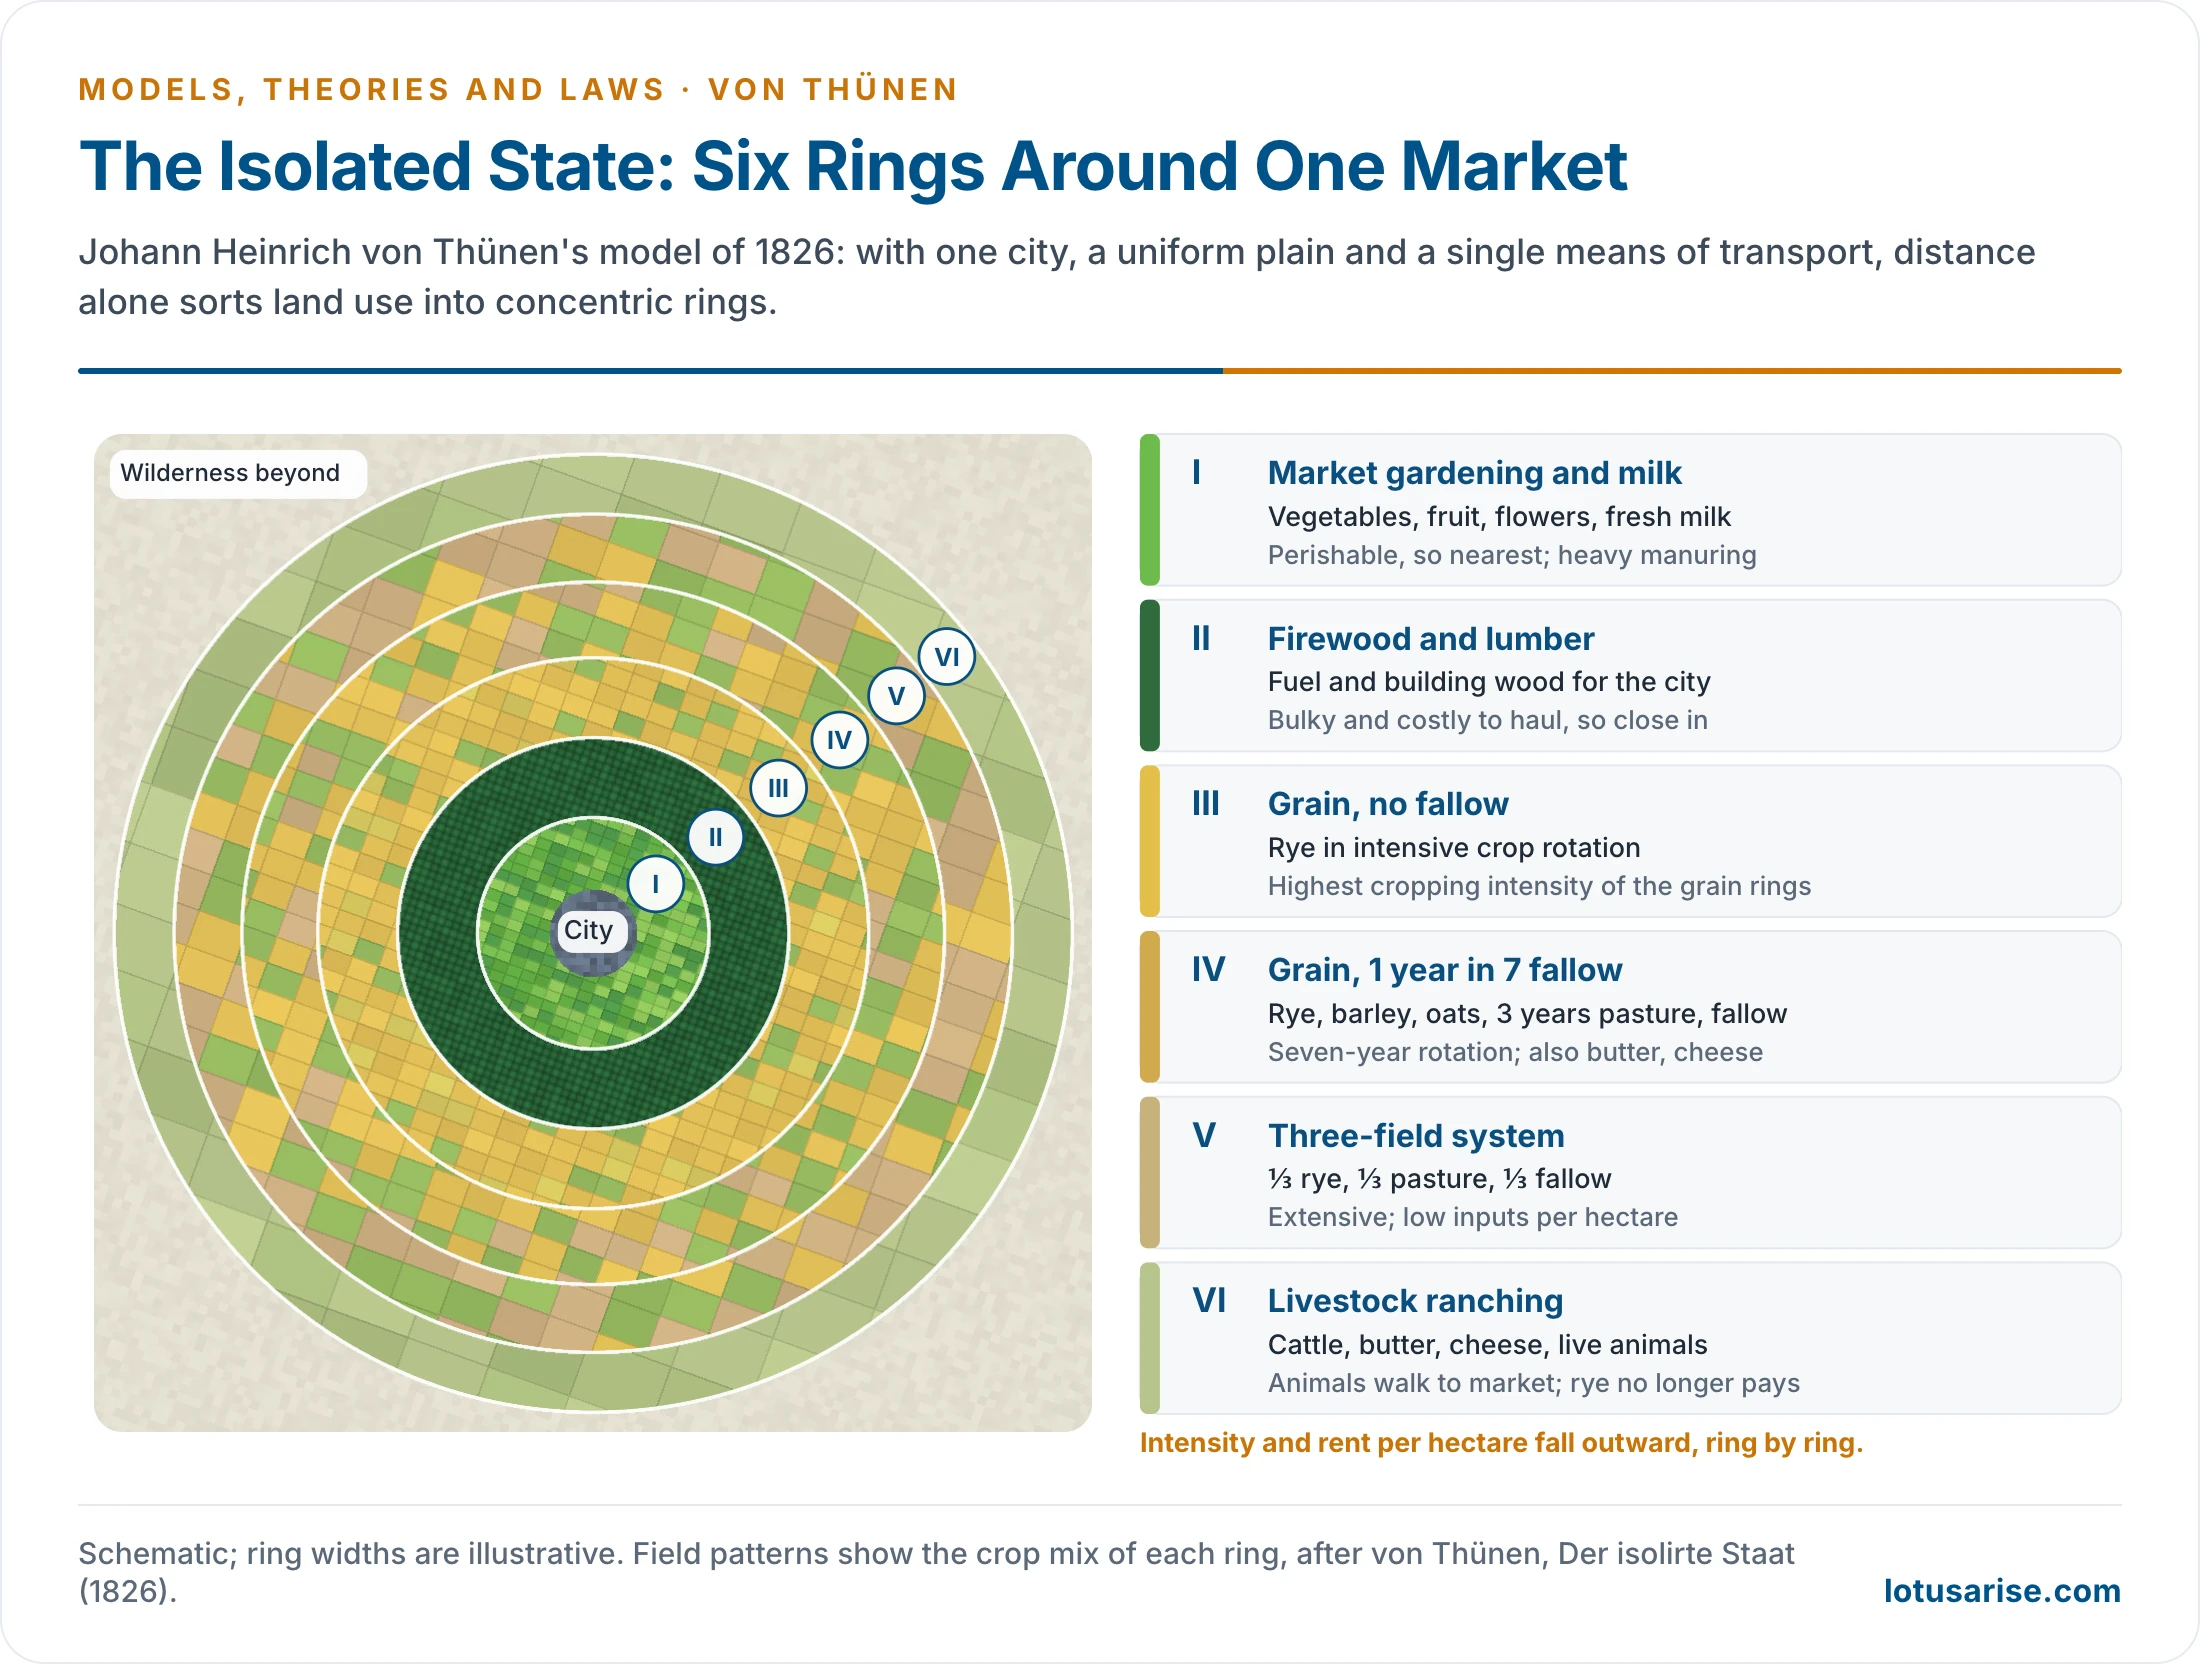
| Zone | Land use | Character | Why it sits here |
|---|---|---|---|
| I | Market gardening and milk | Vegetables, fruit, flowers, fresh milk; most intensive, kept fertile with city manure | Perishable, and no refrigeration or fast transport existed |
| II | Firewood and lumber | Fuel and building timber | Bulky and heavy for its value, yet in great demand in the city |
| III | Grain, no fallow | Rye in intensive crop rotation; highest cropping intensity of the grain rings | Grain stores and travels well; land is cheaper |
| IV | Grain, about 14% fallow | Seven-year rotation: rye, barley, oats, three years of pasture, one year of fallow; also butter, cheese, live animals | Less productive at this range; products keep longer than fresh milk |
| V | Three-field system | One-third rye, one-third pasture, one-third fallow | Distance makes high inputs unprofitable |
| VI | Livestock ranching | Cattle, butter, cheese, live animals | Animals walk to market; by-products are compact; rye no longer yields enough rent |
- Beyond Zone VI lies wilderness, where farming no longer pays. This is what isolates the state.
- Why forest comes before farmland: this ring surprises most readers.
- Fuelwood is extremely bulky for its value, and wood was the main fuel and building material of cities in the early nineteenth century.
- Hauling it by wagon cost far more than hauling grain of equal value. Its rent line therefore falls steeply and beats grain close to the city.
Modifications by von Thünen Himself
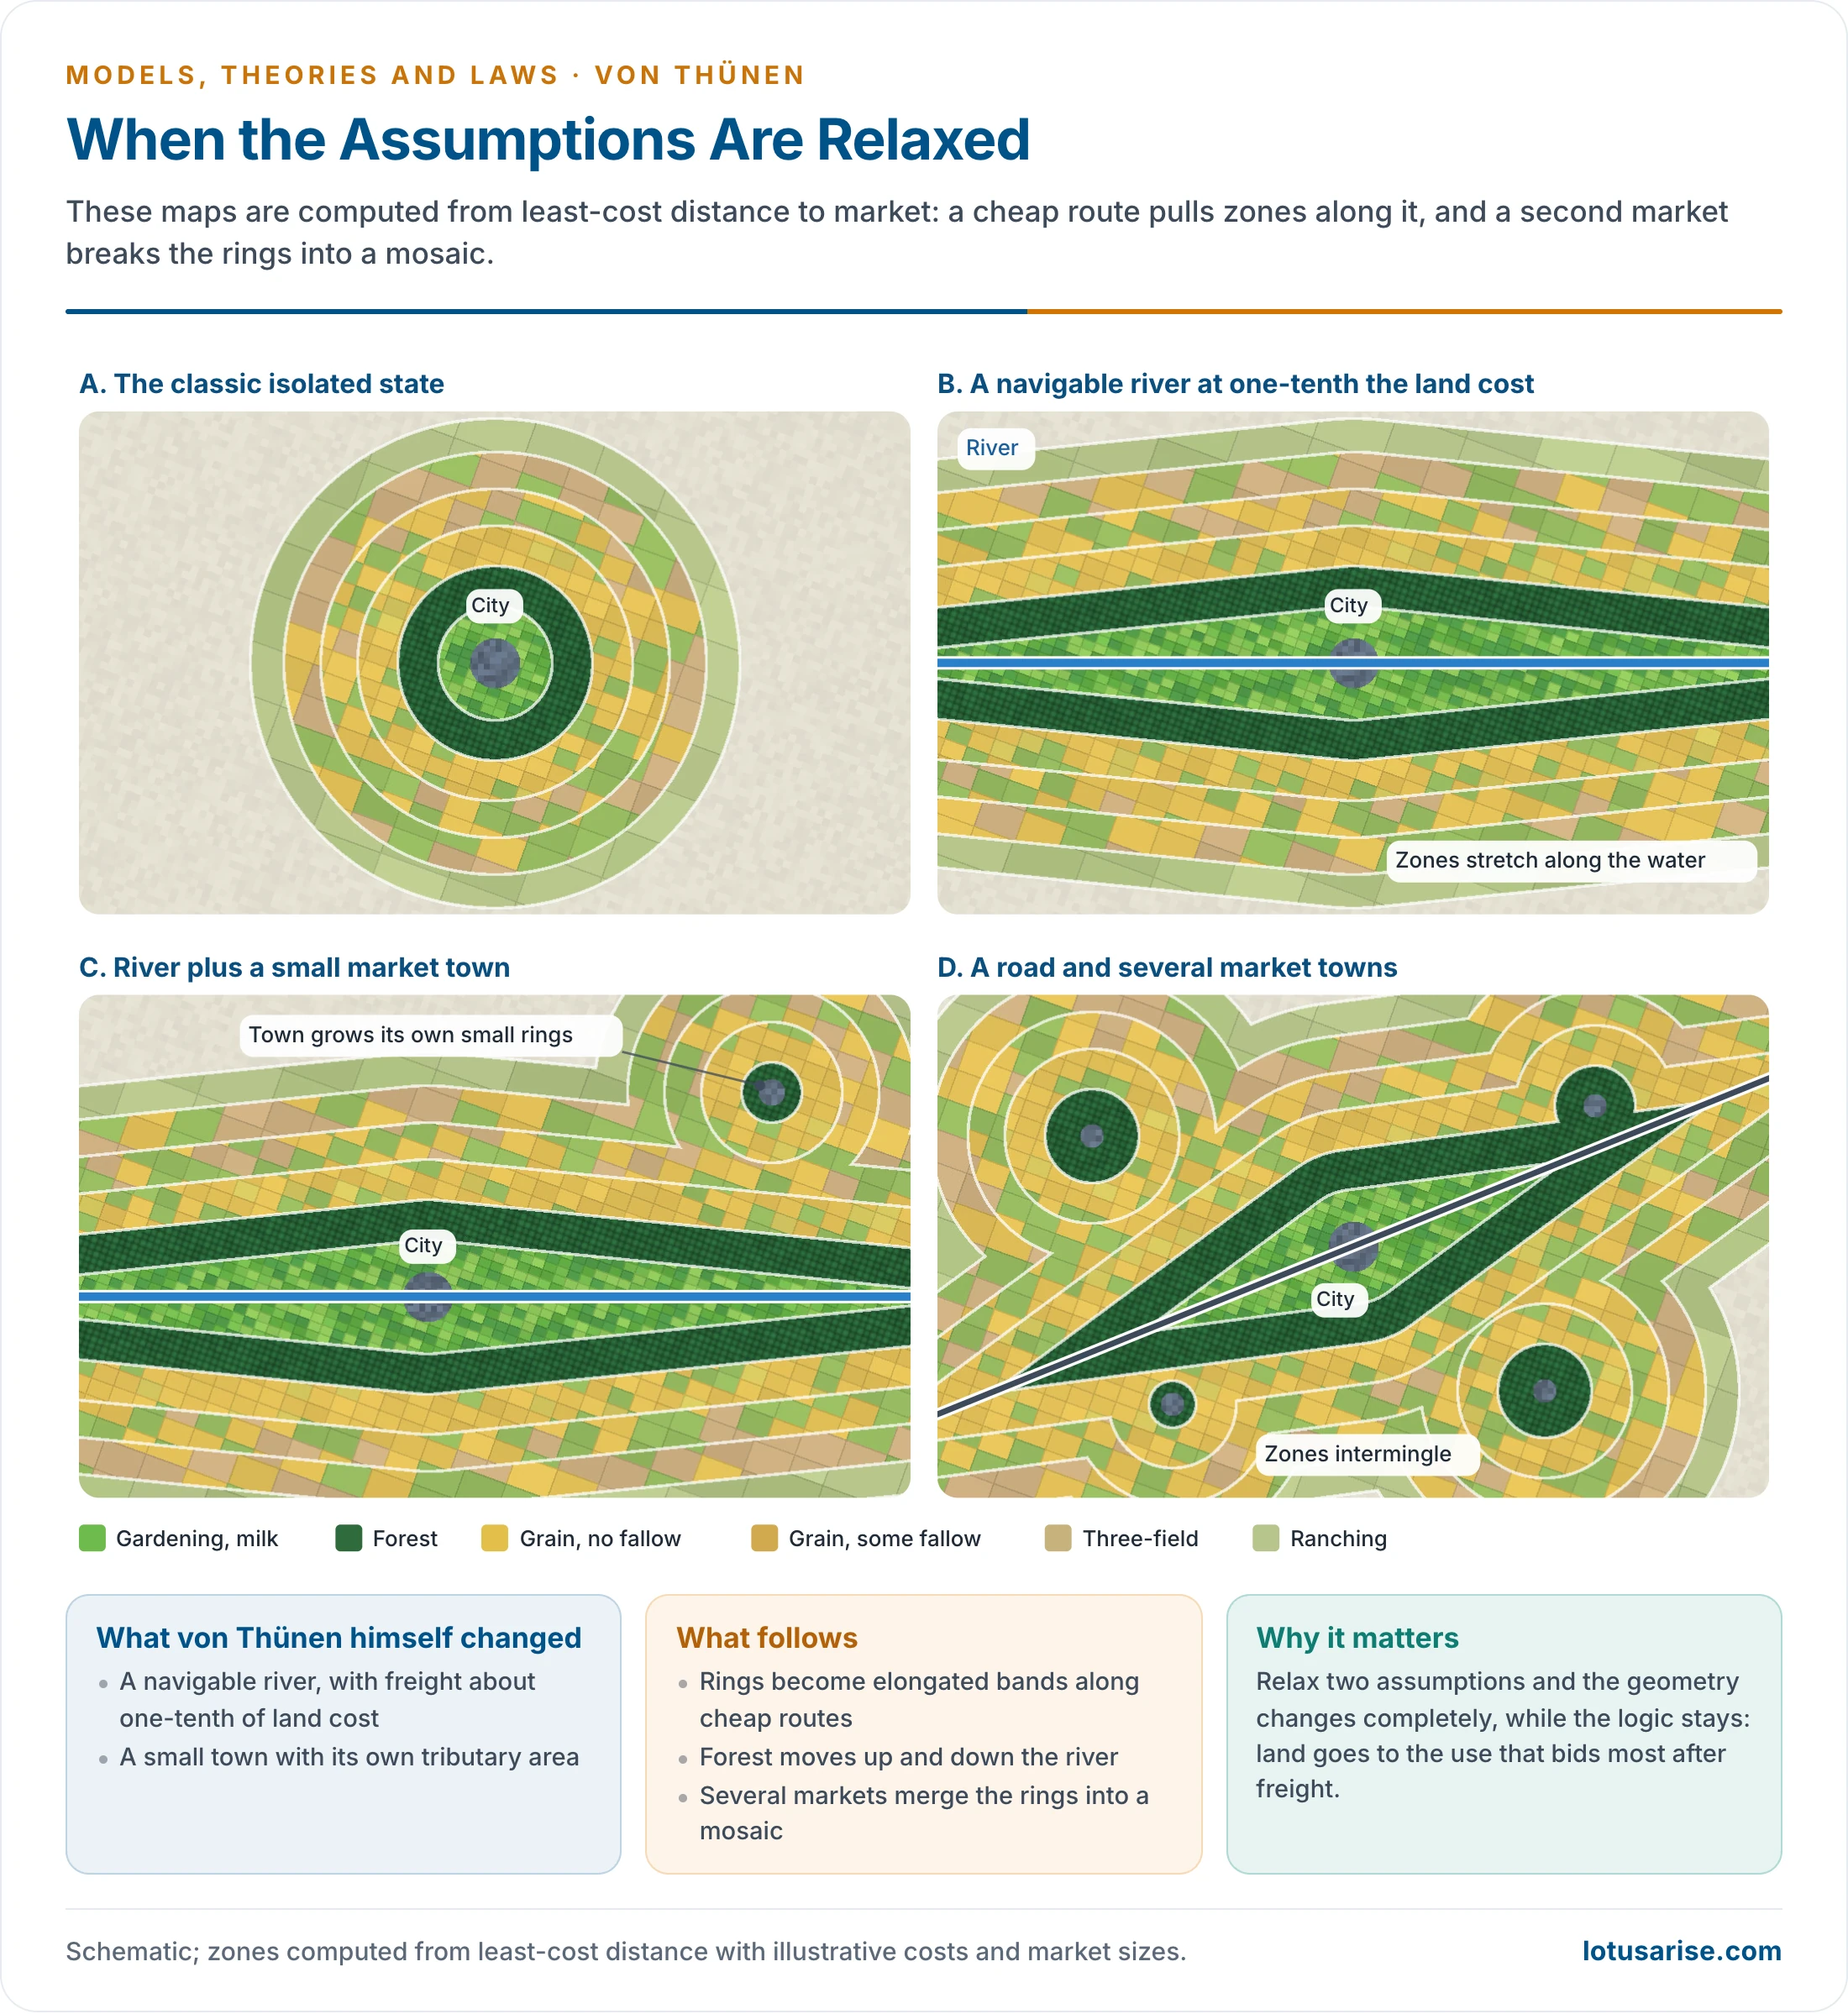
- He tested his own model by relaxing two assumptions.
- A navigable river: freight along it was faster and cost about one-tenth of land freight.
- Production zones stretch along the river.
- Zone I changes least. Zone II extends as a narrow band up and down the stream, since riverside land is the best place to grow something so costly to haul.
- A second market: a small town with its own tributary area adds a small set of zones of its own.
- Several towns of similar size would produce intermingled zones that modify one another. Around any one city the zonation may then become rudimentary.
| Classical model | Modified model |
|---|---|
| Perfect concentric rings on a uniform plain | Elongated zones along rivers and roads |
| One central market | Several markets of varying importance |
| Same freight rate in every direction | Differential freight; waterway about one-tenth of land |
| Zones separate and non-overlapping | Zones intermingled and overlapping |
- Later writers added further distortions: a fertile tract that shifts rent locally, unequal quantity and quality of information, and non-optimal behaviour. Together these make a mosaic out of the rings while leaving the logic intact.
Testing the Model at Different Scales
Micro Scale: The Farm and the Village
- The model also works at the scale of a farm or village, where the “market” is the farmstead and the cost is labour and travel to the field.
- Michael Chisholm (1962) showed that returns fall with distance from the farmstead in many parts of the world. Piers Blaikie (1971) examined this spatial organisation in north Indian villages.
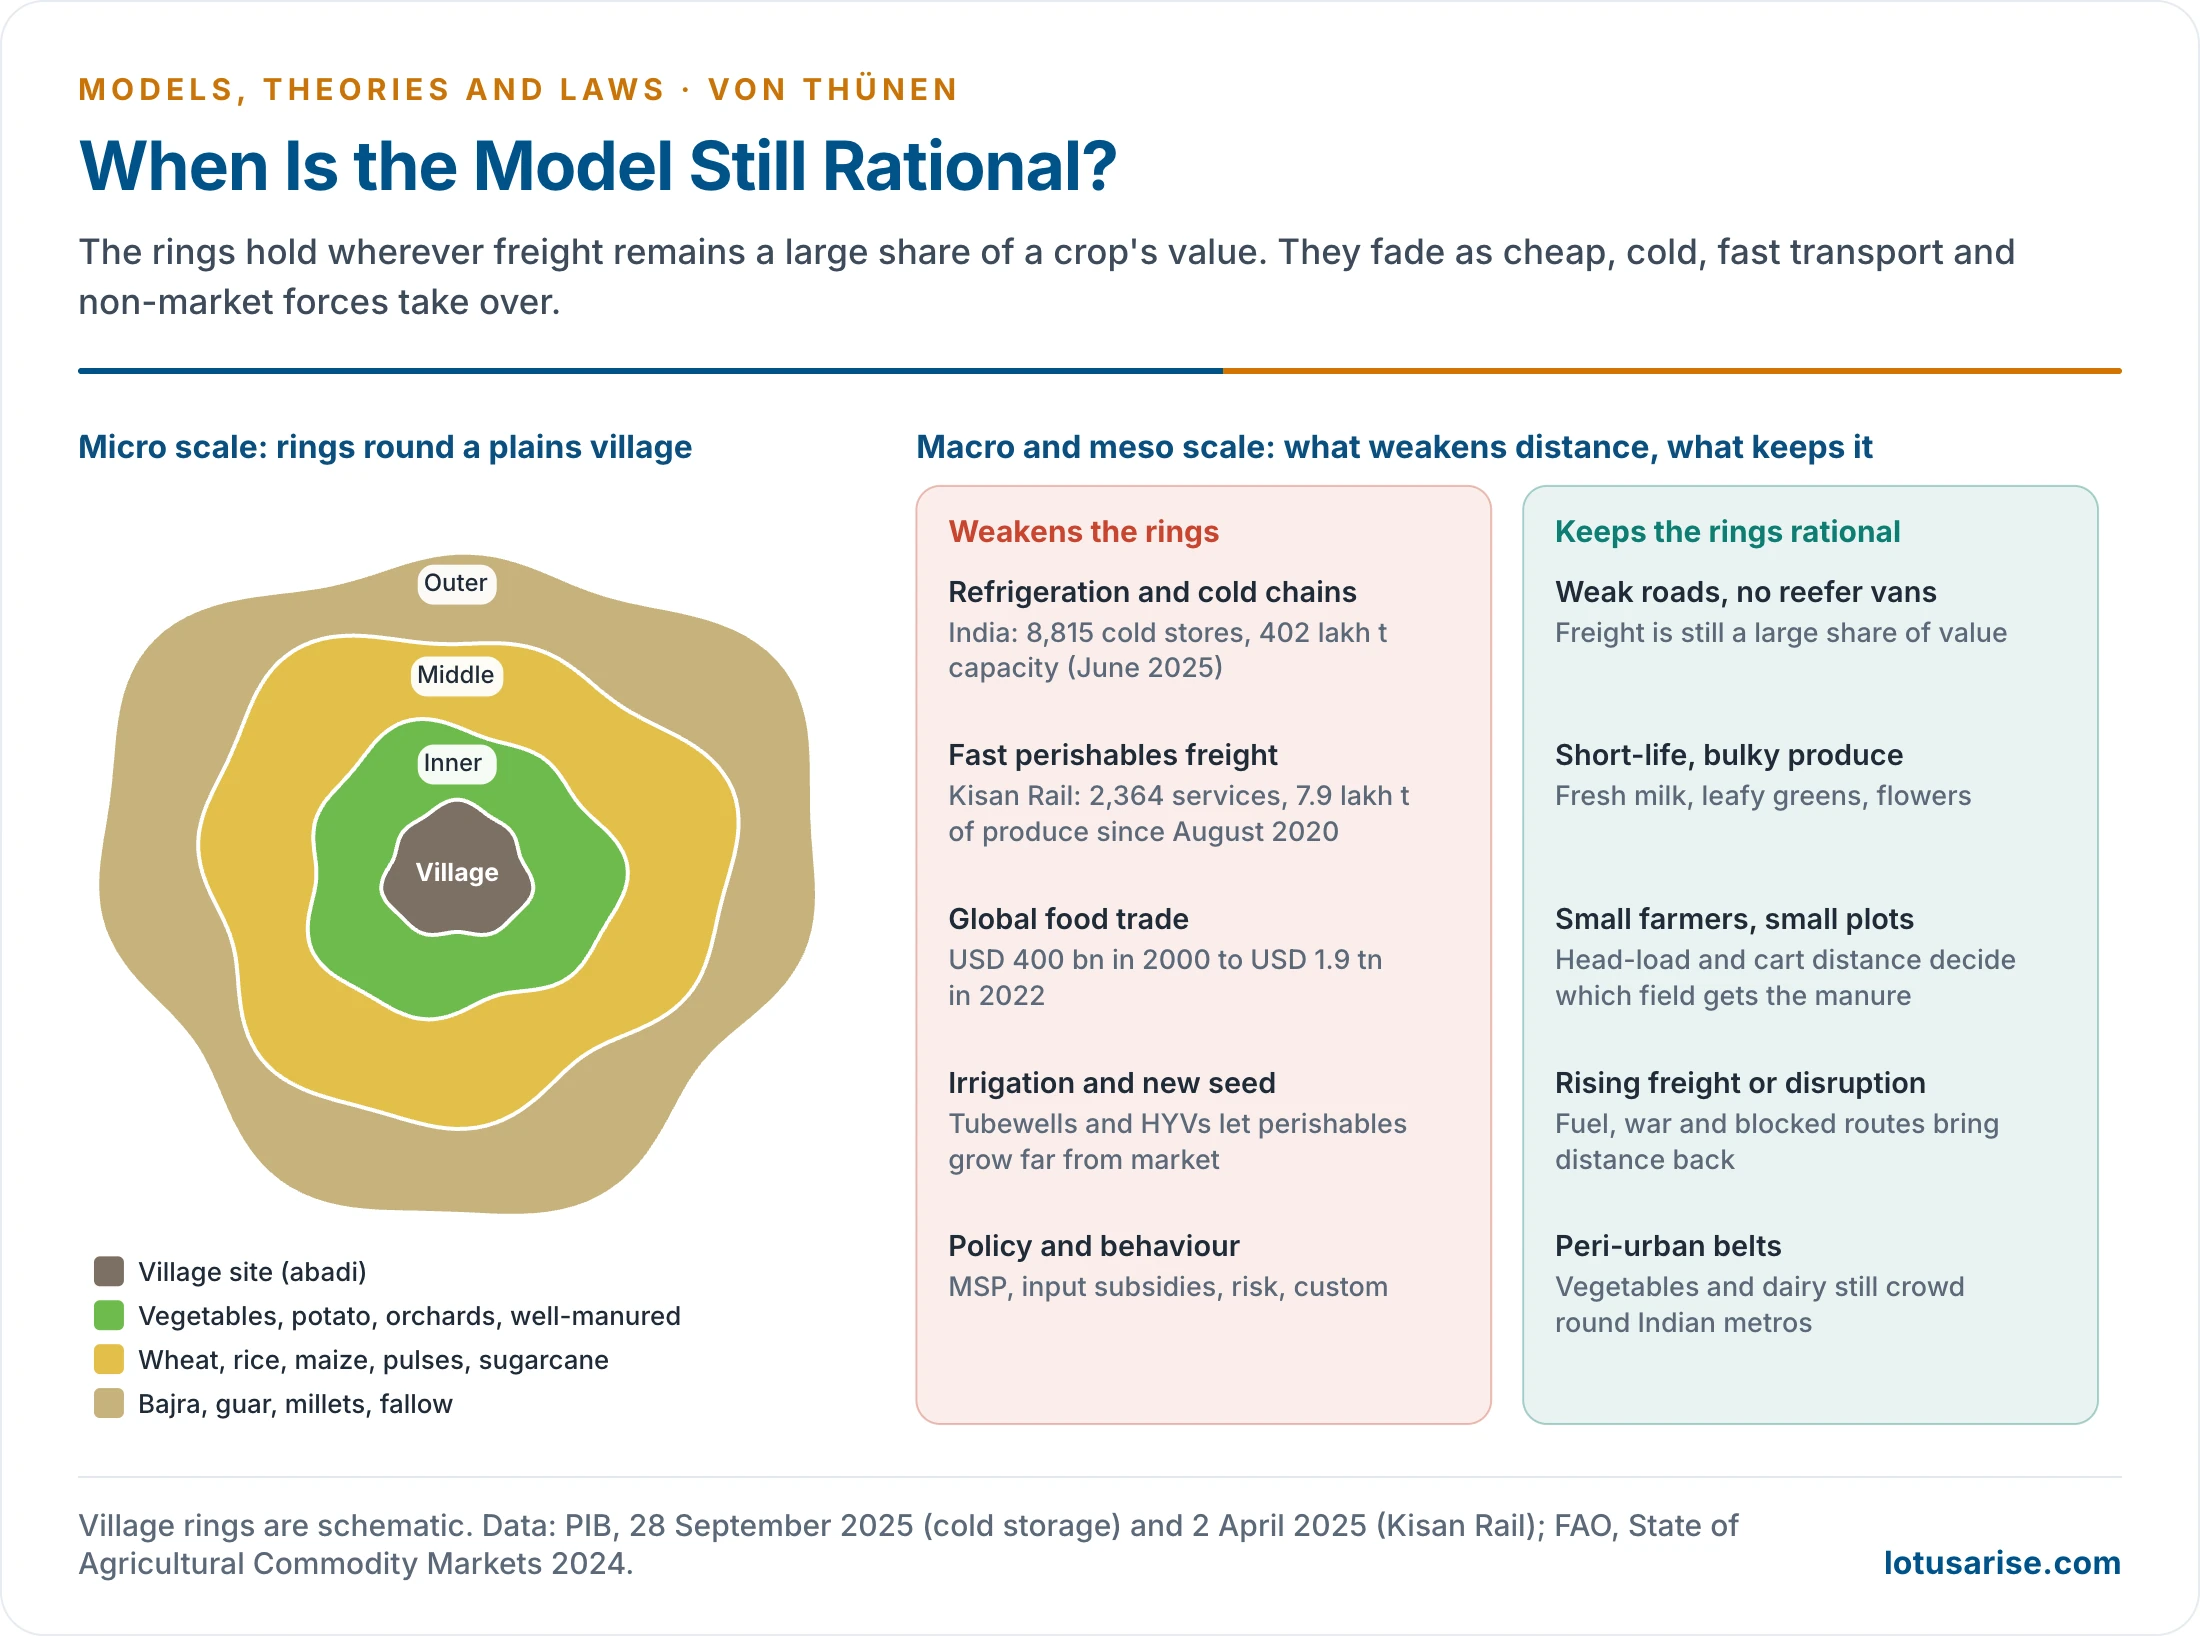
- In the villages of India’s Great Plains, rough rings can still be seen:
- Innermost land: the most fertile and heavily manured plots, under vegetables, potatoes and orchards.
- Middle belt: rice, wheat, barley, maize, pulses and sugarcane.
- Fringe: inferior cereals such as bajra, guar and millets.
Meso Scale: The City Region
- Ronald J. Horvath (1969) found a eucalyptus forest of 95 square miles around Addis Ababa supplying the city’s firewood and building material.
- It stretched along the improved roads, much as Zone II stretches along von Thünen’s river, and smaller Ethiopian towns had forests of their own.
- Indian cities show the same logic. Perishables such as vegetables and milk cluster round Delhi and Mumbai, while cereals and pulses dominate remoter districts.
- The East Kolkata Wetlands still feed Kolkata with vegetables and fish grown on the city’s edge.
- Indian field tests give a mixed verdict.
- Mohammad Shafi, working in Koil tehsil of Aligarh, found that land-use intensity falls away from intensively tubewell-irrigated areas rather than simply from the market.
- Tests in Punjab concluded that the model cannot apply in its original form, because irrigation and dense transport networks have reshaped cropping and intensity.
Macro Scale: Europe
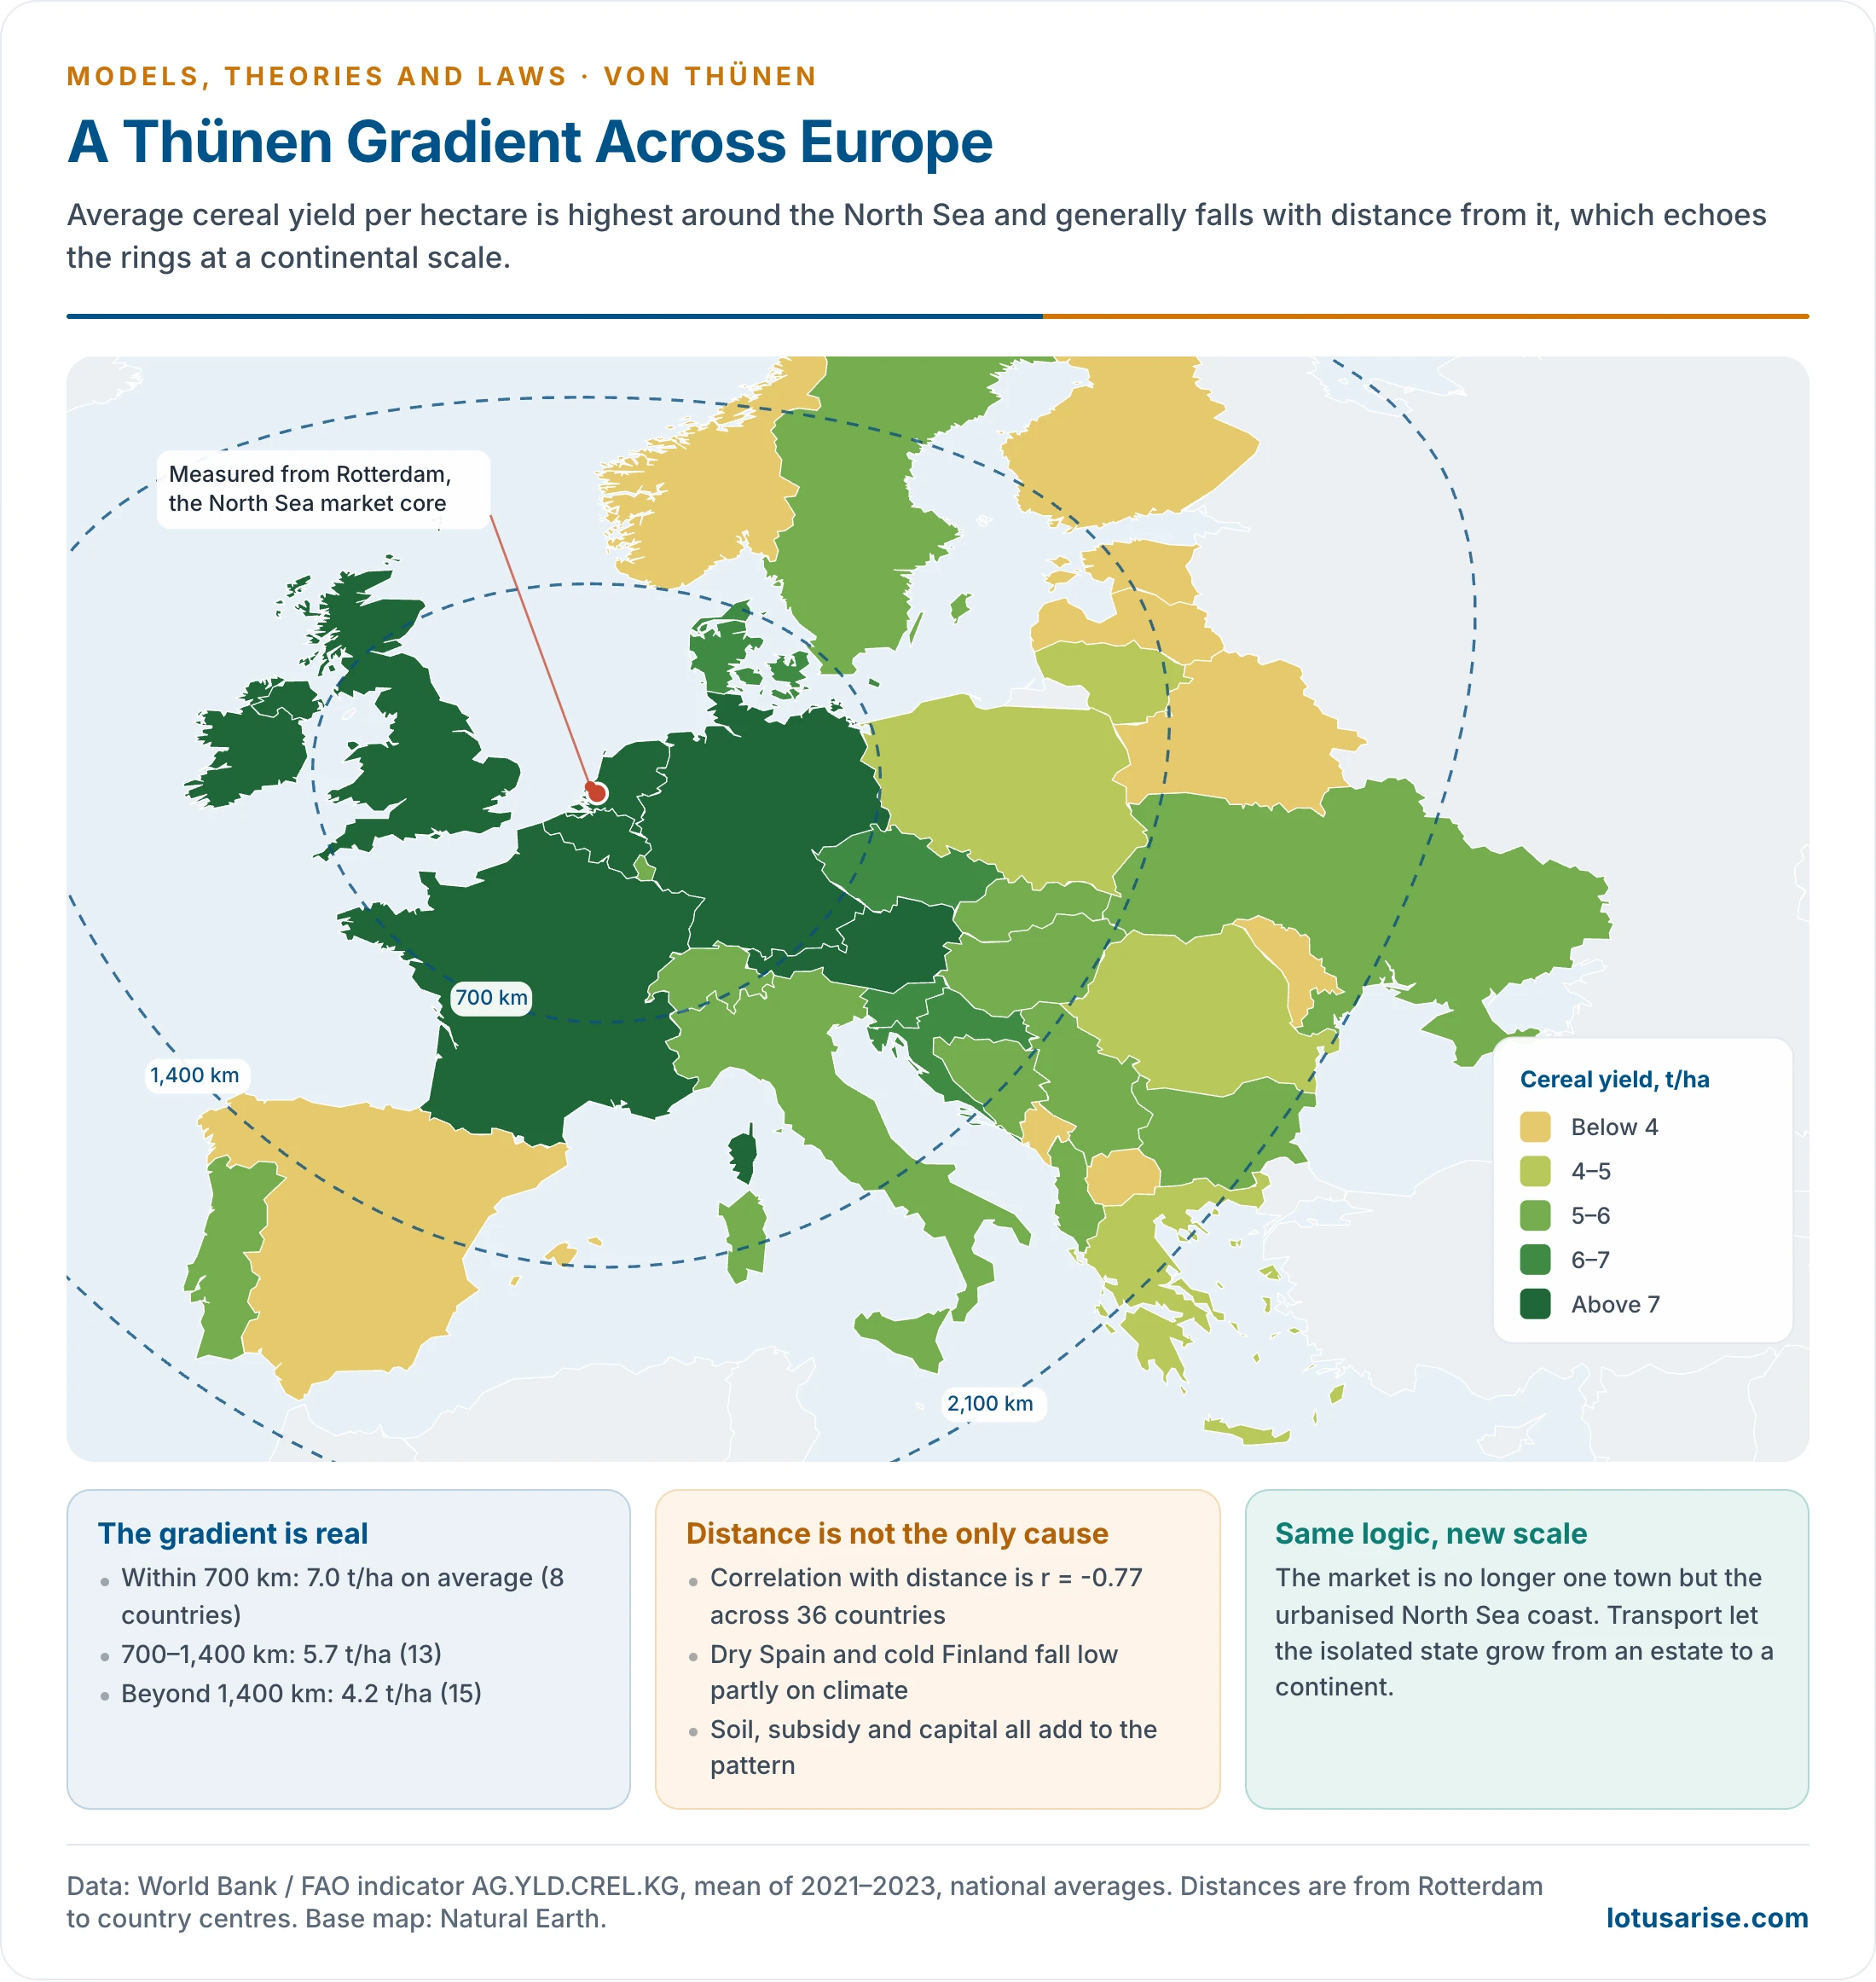
- Samuel Van Valkenburg and Colbert C. Held mapped agricultural intensity across Europe and found a striking ring-like pattern. They indexed the yields of wheat, barley, oats, potatoes, sugar beet and hay, with the European average as 100.
- Transport has allowed the isolated state to grow from an estate to a continent. Its centre is no longer one town but the urbanised North Sea coast.
| Region | Intensity index | Thünen equivalent |
|---|---|---|
| Netherlands, Belgium | Highest (above 160) | Zone I: intensive farming at the market core |
| Denmark, north Germany, France, UK | High (125–160) | Zones II–III: mixed intensive farming |
| Switzerland, Austria | Moderate (100–125) | Zones III–IV |
| Eastern Europe | Below average (70–100) | Zones IV–V: less intensive cereals |
| Mediterranean periphery | Low (below 70) | Zones V–VI: extensive farming and grazing |
- Current figures keep the broad pattern. Cereal yield averaged about 7.0 t/ha within 700 km of Rotterdam in 2021–23, against about 4.2 t/ha beyond 1,400 km.
- Distance is not the only cause. The periphery has much less good land (Alps, Pyrenees, Apennines), and climate, subsidy and capital all add to the gradient. Modern routes also bend the rings along roads and railways.
- Richard Peet (1969) traced the same expansion historically: as freight fell in the nineteenth century, the zones supplying Britain’s market spread overseas.
Macro Scale: United States
- The supercity that anchors this system is the north-eastern Megalopolis, the country’s main food market and transport focus.
| Agricultural region | Location | Thünen equivalent | Main products |
|---|---|---|---|
| Atlantic fruit and vegetable belt | Nearest Megalopolis | Zone I | Fresh produce |
| Dairy belt | North-east, Great Lakes | Zones I–II | Milk, cheese, butter |
| Corn belt | Midwest, Ohio to Nebraska | Zone III | Meat, mixed crops, feed |
| Wheat belts | Great Plains | Zones IV–V | Wheat in bulk |
| Grazing region | Rocky Mountain West | Zone VI | Beef cattle, sheep |
- The rings are not circular here, but the sequence of regions westward along the main trans-continental route fits the model’s logic.
- Railways changed the order: wood could now travel cheaply, so the forest ring moved to the outer limits of the system.
Evaluation
Limitations
- Unrealistic assumptions: an isolated state with one market and a uniform plain hardly exists. Soil and climate vary everywhere, and physical advantages cannot be taken for granted.
- Static and deterministic: growth and changing demand alter land use over time, but the model has no dynamics.
- Demand is left out: the demand for a crop has a large effect on cropping pattern and intensity.
- Freight is not linear: the cost per tonne-kilometre falls with longer hauls, and it varies by mode.
- Economic man is a fiction: farmers act on habit, risk and custom.
- Julian Wolpert (1964) found farmers settling well short of the profit-maximising optimum, which shows the model oversimplifies decisions.
- Under collective farming in Russia, China and Eastern Europe, the decision was made by the state.
- Hard to measure: economic rent and intensity are difficult to test because man-days and input costs are not uniform between farming types.
- Not all farming types exist everywhere: in many European countries the old arrangement of farm types around a market has gone.
- Technology has shrunk distance: when the model was written, loaded carts moved at walking pace. Modern transport allows a space-time convergence of distant places.
Sinclair’s Inversion
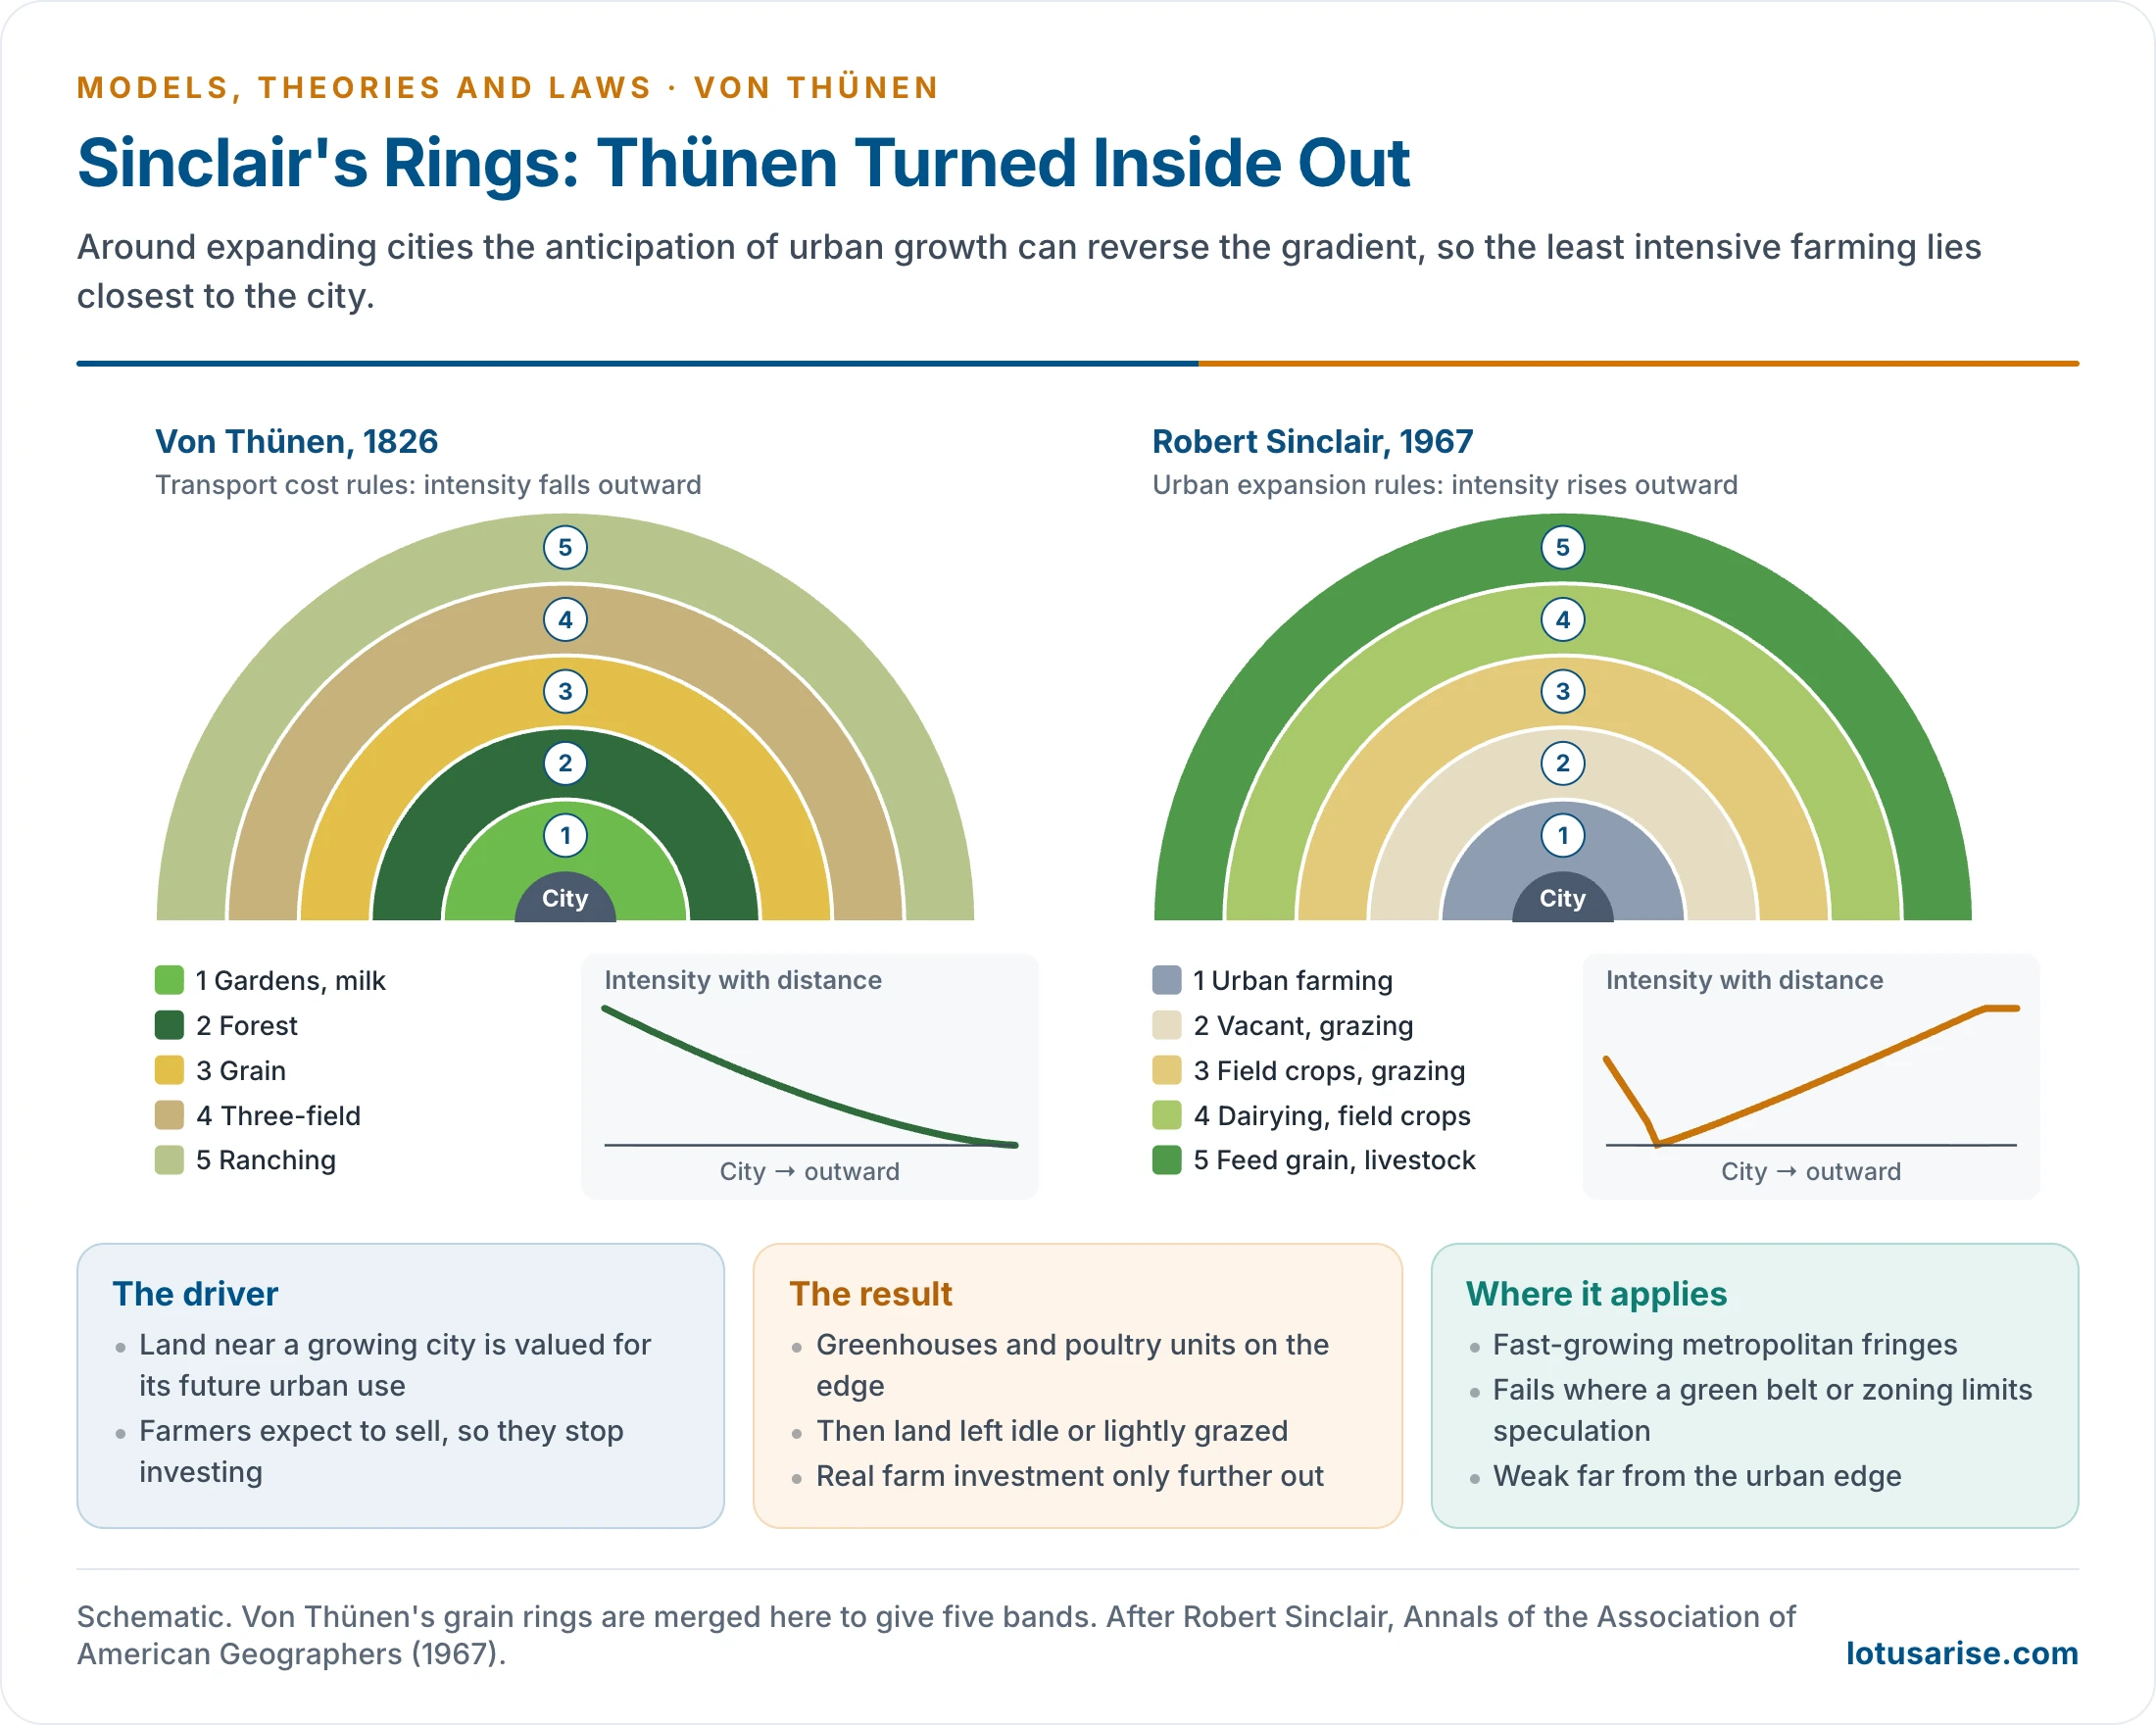
- Robert Sinclair (1967) offered the sharpest critique. Near expanding cities in industrial countries, the main force is not freight but urban expansion.
- Land near a growing city is valued for its future urban use, so farmers expect to sell and stop investing. Agricultural intensity therefore often rises with distance, the reverse of von Thünen.
- His five zones run outward from the city edge:
- Urban farming: greenhouses, poultry and mushroom units in scattered, short-lived plots.
- Vacant and grazing: land held by speculators, with temporary grazing.
- Field crops and grazing: transitional farming with little capital investment.
- Dairying and field crops: the city’s main fresh-milk supply area.
- Specialised feed grain and livestock: beyond the city’s direct influence, serving a national market.
- Sinclair did not reject von Thünen outright. He held that the older model still applied in less developed regions where transport cost remained the main force.
- India’s urban fringe shows both forces at once. Farmland around Gurugram, Noida and Bengaluru is often held for sale, while intensive vegetable and dairy units persist beside it. The rural-urban fringe is where this contest plays out.
Strengths and Enduring Value
| Limitation | Counterpoint |
|---|---|
| Assumes uniform terrain | The core principle (distance, cost, land-use gradient) survives when terrain modifies it |
| No refrigeration or modern logistics | Perishable and high-value crops still broadly favour urban proximity |
| Ignores demand | Prompted later work that added it, such as Dunn (1954) and Alonso (1964) |
| Static | A benchmark for measuring change, and a base for dynamic land-use models |
| Oversimplifies decisions | Drew behavioural critiques that enriched the field |
- It should be judged by its time: in 1826 transport was poor and isolated estates were common over much of the world.
- It has lasting worth in two ways:
- It turned attention to economic factors, above all freight and distance, when earlier geographers looked mainly to the physical environment.
- It gave locational rent to both rural and urban land-use studies.
- It stimulated urban models, notably the bid-rent theory of William Alonso (1964), and it stands with Alfred Weber’s industrial model and Walter Christaller’s central place theory in classical location theory.
| Aspect | Von Thünen (1826) | Alfred Weber (1909) | William Alonso (1964) |
|---|---|---|---|
| Focus | Agricultural land use | Industrial location | Urban land use |
| Key variable | Distance to market, freight | Least total cost (freight, labour) | Willingness to pay for land |
| Spatial pattern | Concentric farming rings | Locational triangle | Concentric urban rings |
| Rent | Locational rent is central | Not central; cost is minimised | Bid-rent curves by land user |
| Scale | Rural | Industrial, regional | Intra-city |
| Main limit | Static, ignores demand | Ignores demand and later dynamics | Assumes uniform urban space |
Relevance Today
What Has Weakened the Rings
- Refrigeration and cold chains: perishables now travel thousands of kilometres. New Zealand butter and meat reach Britain after a sea voyage of over 17,000 km.
- India had 8,815 cold stores with 402 lakh tonnes of capacity in June 2025 (PIB).
- Fast freight: air cargo overcomes proximity for high-value goods. Kisan Rail has moved about 7.9 lakh tonnes of perishables on 2,364 services since August 2020.
- Milk is the clearest Indian case: Anand’s cooperative milk reaches distant metros by rail and road tanker.
- Global trade: food and agricultural trade grew from USD 400 billion in 2000 to USD 1.9 trillion in 2022 (FAO). Local distance matters less where the market is the world.
- Irrigation and seed: tubewells and high-yielding varieties let better-off farmers grow perishables in distant fields, and have made the model of little use at micro and meso levels in the Great Plains.
- Land reform: consolidation of holdings changed the crop rings, since each farmer now grows food for the household and some cash crops on one block.
- State intervention: subsidies and procurement change crop choice regardless of market logic.
- Several markets: urbanisation warps the zones through many overlapping markets.
When the Model Is Still Rational
- The model holds wherever freight remains a large share of a crop’s value. That gives a clear set of conditions:
- Weak roads and no cold chain: in much of sub-Saharan Africa and in remote parts of India, distance still sets what can be sold. In Ethiopia, teff farmers closer to cities receive better prices, use more modern inputs and get higher yields, and the effect is strongest near Addis Ababa (2019 study).
- Highly perishable or low-value bulky goods: leafy vegetables, fresh milk and flowers still favour the urban edge, and straw and fodder rarely travel far.
- Small farmers on foot: head-load and cart distance decide which plot gets the manure and the labour.
- Disruption: the 2020 lockdown stranded perishables, and the Red Sea diversions from late 2023 raised long-haul freight. Local supply gains whenever distance becomes costly again.
- Firm location: agribusinesses place processing plants and distribution centres to cut distance and freight, applying the same logic at corporate scale.
- The spatial pattern is an ideal type; the analytical framework is the lasting part. Rings fade, but land still tends to go to the use that bids most after paying for distance.
- Open questions now include a truly dynamic version of the model, the place of risk in farmers’ choices, and its use with GIS and spatial econometrics.
Newer Uses of the Model
- Forest frontiers: the outer edge of the rings is where farming stops being worth the distance, so anything that raises rent pushes that edge into the forest.
- Kenneth M. Chomitz and David A. Gray (1996) applied this logic to southern Belize, showing that market access, land quality and tenure together decide land use. Roads into poor soils can cost forest while returning little.
- Arild Angelsen (2007) used the model to explain tropical deforestation and tied it to forest transition theory: forest is lost while farm rent rises and recovers when farm rent falls or forest rent rises.
- Rural roads and market access: a new road lowers t and moves every ring outward. Programmes such as Pradhan Mantri Gram Sadak Yojana (2000) work directly on this variable.
- Price information: the e-NAM electronic market platform (2016) narrows the information gap between distant farmers and markets, one of the complications later writers added to the model. It does not reduce freight.
- Carbon and food miles: a carbon charge on freight would act like a higher t and favour nearby supply. The effect is limited, because production usually matters more than transport in food’s total emissions.
Summary
| Category | Details |
|---|---|
| Author | Johann Heinrich von Thünen (1783–1850), German landowner and economist |
| Work | Der isolirte Staat, Part I, 1826 |
| Data | About forty years of cost accounts from his estate at Tellow, Mecklenburg |
| Core concept | Locational rent |
| Formula | LR = Y(m − c) − Ytd |
| Output | Six rings: gardening and milk, forest, grain without fallow, grain with fallow, three-field, ranching |
| Modifications | Navigable river; second market |
| Main critique | Unreal assumptions; static; Sinclair’s inversion near growing cities |
| Value today | A framework at micro, meso and macro scales, wherever freight still matters |
Previous Year Questions
2026“Under what situations Von Thunen’s model of agricultural location is still rational.” Justify with examples.2022Explain the relevance and applicability of Von Thunen’s theory of agricultural location in today’s world.2020Write a note on the relevance of Von Thunen’s agricultural location theory in the present context.2015Discuss the relevance of Von Thunen’s model on agricultural location in the contemporary context.2010Write short explanatory note on von Thunen’s concept of economic rent.2008Discuss the views of von Thunen on agricultural location.2002Write short note: Isolated state.1994Discuss Von Thunen’s model of agricultural land use and examine if the model is applicable to India.1987Write short note: Theories of agricultural location.





Sir, thank a lot for providing notes on this topic. I visited many websites but did not get satisfactory answer. This article has just cleared my all doubt .
Thanks, Rajan for your graceful feedback.
thank you sir for making learning easy
Most welcome Arjun
Wonderful theory
Could you kindly provide details regarding the applicability of Von Thunen’s model in the Indian context? Thanks in advance
You can find it in the book ‘Human geography’ by Majid Hussain. page no.356
check Pangeography.com
thank you annayya…
Updated!
Sir, your compilation has helped me a lot in clearing my doubts. This will also enable me for getting a good marks in mains. I thank you for your hard work and selfless service.
Most welcome, Keep reading.
this compilatons are nourishing to achieve the ultimate goal of this journey of any aspirants. i have no words to thank you .
just wow ! very crispy & point wise….Thanks a lot sir for helping.
thankyou sir , it will be more helpful if possible for you to include case studies
According to von theory Exaplaintion on farmers, harder/ are persistence
Thank you,sir.
It was really helpful.
Thank you so much .Really helpful
I find this material very concise yet complete in information on the topic. I’d like to use it as one of the references in my upcoming oral presentation and give due credit to the source. Thank you for making my studies easier.
Thank you for helping me so much 😊😊
ONE OF THE FINEST WEBSITE FOR ALL CIVIL SERVICE ASPIRANTS..THANKS A LOT SIR…
Thank you Sir
Very nice please for the off format
Thank you sir for giving me the relivent details
Thank you sir for giving me all details
Now i got the perfect compilation to boost in my optional!
A heartly Thank you, sir!
Thanks Sir 😃
How it is relevance in present context?
Really sir very fruitful 🍓
I understand This Theory,, Thank you.
Thank’s a lot sir, tomorrow is my exam but this concept is clear,some how I can get passing mark…
Best in the internet
The best content for quick revision there is! Thanks a lot, Kudos to the LotusArise team.
Thankyou for the detailed notes.