

- Population growth is the change in the number of people in an area over time. It is the net result of births, deaths and migration. For India as a whole, international migration is small, so growth is almost entirely natural increase (births minus deaths).
- Demographics is the statistical description of a population: its size and growth, age and sex structure, literacy, rural–urban composition and occupations. Population geography studies these traits across space and over time, and asks how they relate to resources and development.
- India’s growth since 1901 follows the demographic transition closely, but with long time-lags between regions. The south has completed the transition while the Hindi heartland is still in it.
India’s Population: Size and Position

Size and Global Share
- Census 2011 counted 1,210.9 million people (final figure), 17.7% more than in 2001.
- India became the most populous country in 2023, overtaking China. The UN World Population Prospects 2024 puts India at about 1.46 billion in 2025.
- India holds about 18% of the world’s people on 2.4% of its land area: roughly one person in six is Indian.
- India is the 7th largest country by area but has more people than the USA, Indonesia, Pakistan and Nigeria combined.
- The result is a high man–land ratio and heavy pressure on land, water and infrastructure.
- Growth has slowed but not stopped:
- Annual growth is now below 1% (about 0.9% in 2024), against 2.2% a year in 1961–81.
- India still adds about 13 million people a year, because the base is so large.
- China’s population has been falling since 2022, so the gap between the two will widen every year.
- The next census, delayed from 2021, began with houselisting in 2026. Population enumeration has a reference date of 1 March 2027.
- Until its results are out, Census 2011 remains the latest complete count.
- The Sample Registration System (SRS) and the National Family Health Survey (NFHS) fill the gap with annual and periodic estimates.
States by Population (Census 2011)
| Most populous | Population (million) | Least populous (States) | Population (million) |
|---|---|---|---|
| Uttar Pradesh | 199.8 | Sikkim | 0.61 |
| Maharashtra | 112.4 | Mizoram | 1.10 |
| Bihar | 104.1 | Arunachal Pradesh | 1.38 |
| West Bengal | 91.3 | Goa | 1.46 |
| Madhya Pradesh | 72.6 | Nagaland | 1.98 |
- These five large states held about 48% of India’s people in 2011. Uttar Pradesh alone (16.5%) had more people than Brazil.
- The uneven spread of this population over the land, from over 1,000 persons per sq km in Bihar to 17 in Arunachal Pradesh, follows population distribution and density in India shaped by relief, rainfall, soils and history.
Measuring Growth
- Decadal growth rate: the percentage change between two censuses.
- Decadal growth = (P₂ − P₁) ÷ P₁ × 100, where P₁ and P₂ are the populations at the two census dates.
- Average annual exponential growth rate: the yearly rate that produces the decadal change. It allows comparison with annual data and with other countries.
- Natural growth rate: the crude birth rate minus the crude death rate, per 1000 people. The SRS measures it every year.
- In 2024 it was 11.9 per 1000 (birth rate 18.3, death rate 6.4), against 22 per 1000 in 1971.
- Doubling time: the years a population takes to double at a constant rate, roughly 70 divided by the annual percentage rate.
- At the 2.2% of the 1970s India would have doubled in about 32 years; at today’s 0.9% it would take nearly 80.
- Absolute increase matters as much as the rate. A falling rate on a large base can still add a very large number of people.
- India added 182 million in 1991–2001 and 182 million again in 2001–11, even though the rate fell from 21.5% to 17.7%.
Phases of Population Growth
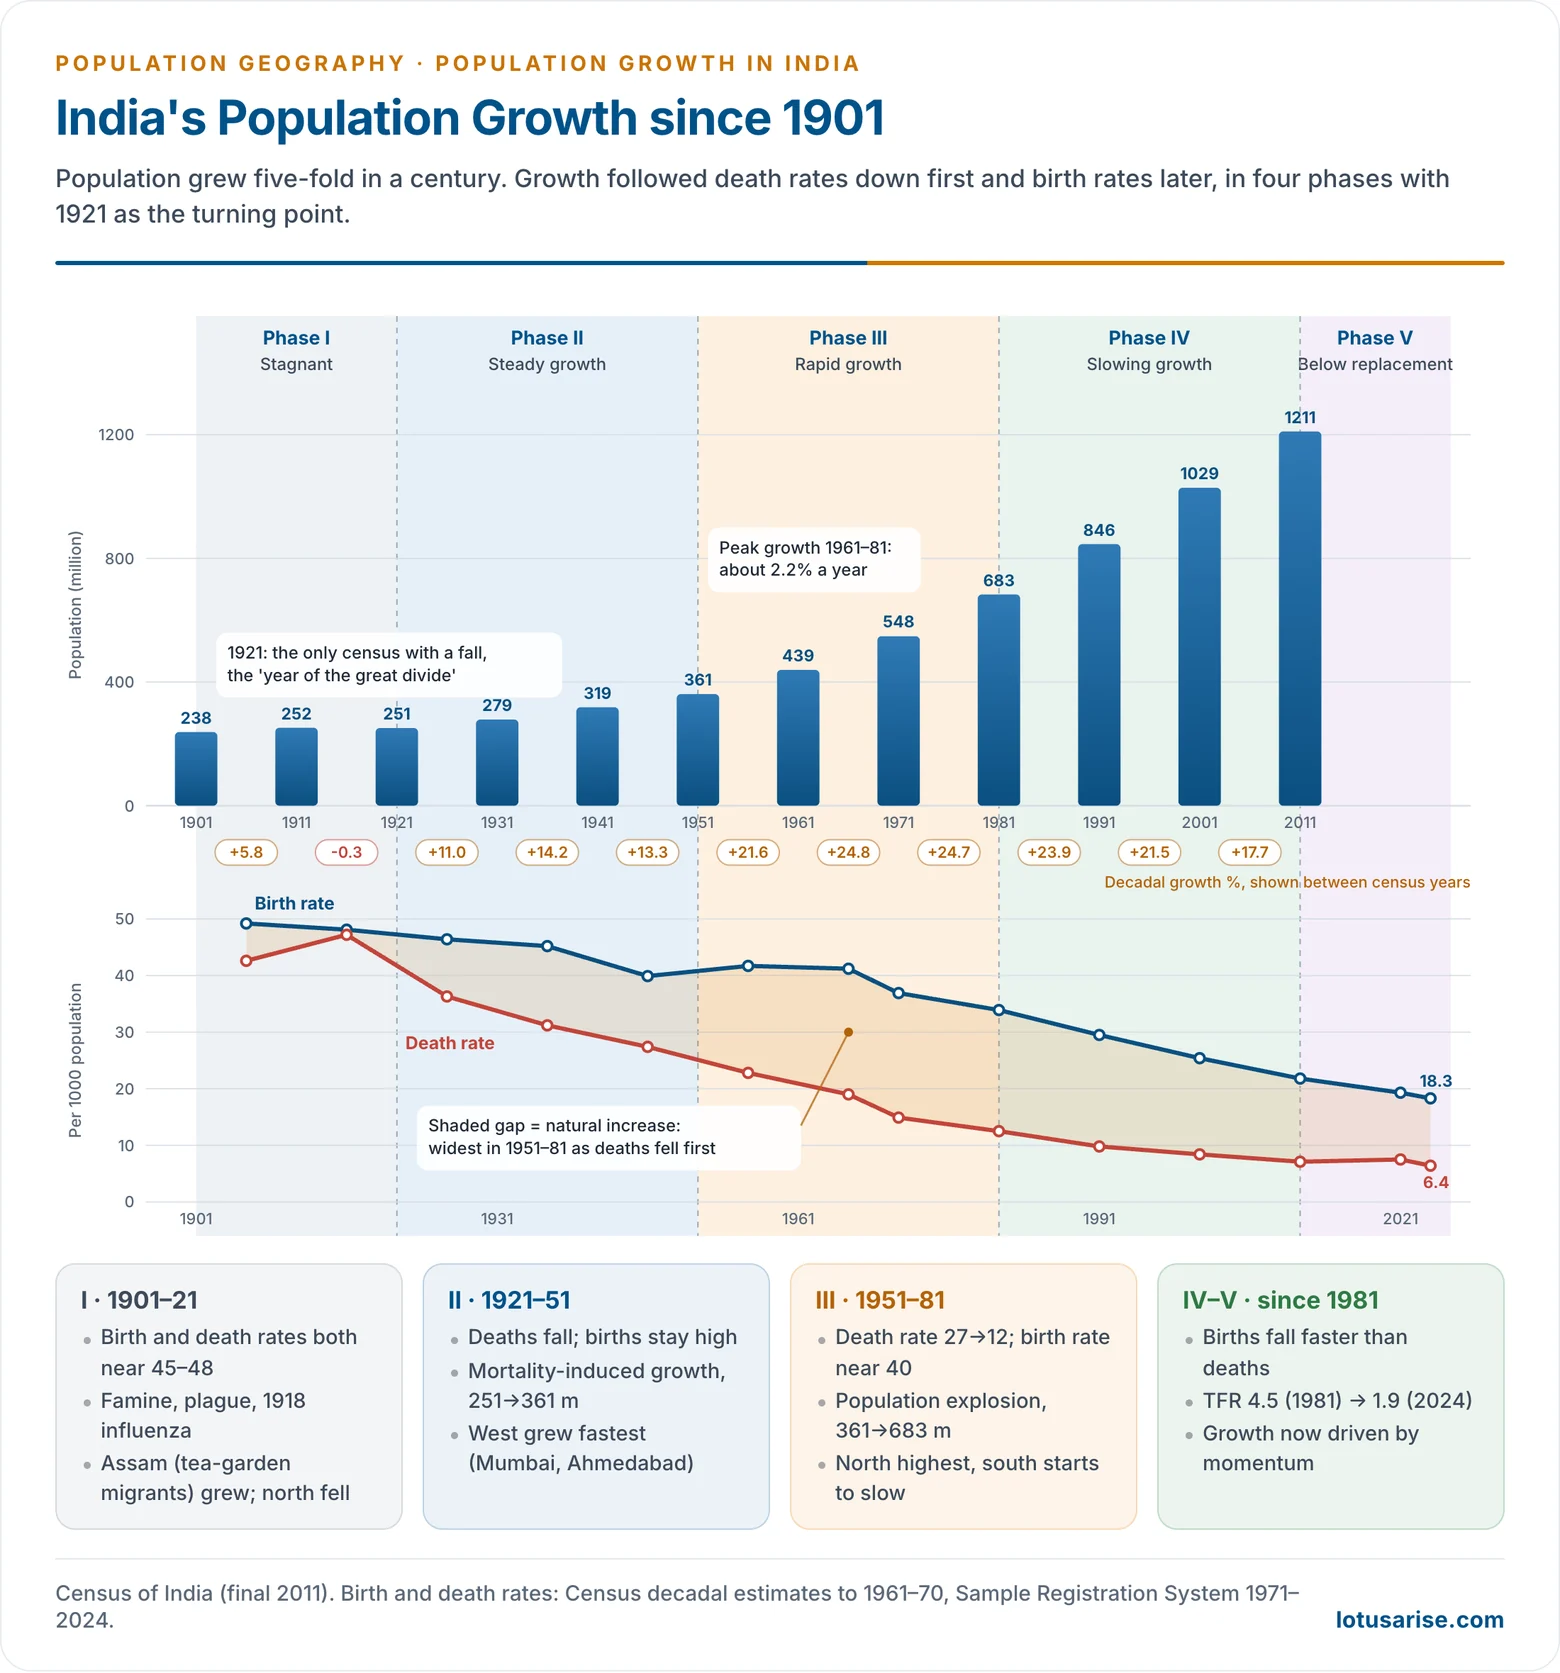
- India’s growth since 1901 falls into four census-era phases. Each matches a stage of the demographic transition described by Frank W. Notestein (1945).
- A fifth phase, of below-replacement fertility, began around 2020.
Phase I (1901–21): Stagnant Population
- Both birth and death rates were very high (about 45–49 per 1000), so growth was slow and unsteady. This is Stage 1 of the transition, the high stationary stage.
- Population rose from 238 million (1901) to 252 million (1911) and then fell to 251 million in 1921.
- Causes of high and fluctuating mortality:
- Epidemics: plague, cholera, malaria and the influenza pandemic of 1918, which killed millions.
- Recurring famines and droughts, with no system for moving food to stricken areas.
- The losses of the First World War.
- Very low life expectancy and almost no public health care.
- 1921 is called the “year of the great divide” (the demographic divide). It is the only census to record a fall. After it, India’s population never stopped growing.
- Zonal contrasts:
- The north lost population to famine and epidemics.
- The north-east grew fast, because tea-garden labour and settlers moved into Assam and mortality crises were milder.
- The south grew at a normal pace (about 11%), with Kerala well above it.
Phase II (1921–51): Steady Growth
- The death rate fell (from about 47 per 1000 around 1921 to 27 by 1951) while the birth rate stayed near 40–46. This is mortality-induced growth and the start of Stage 2.
- Population grew from 251 million to 361 million, about 47% in thirty years.
- Reasons for falling mortality:
- Public health measures and vaccination, which brought plague, cholera and smallpox under control.
- Better sanitation and medical facilities.
- Railways and roads, which allowed food to reach famine areas in time.
- Zonal contrasts:
- The west grew fastest, through migration to the industrial belt of Mumbai, Ahmedabad, Vadodara and Surat.
- The central zone grew slowest, with higher mortality and out-migration.
- The 1943 Bengal famine and the Partition migrations of 1947 left their mark on the east and north-west.
Phase III (1951–81): Rapid Growth or Population Explosion
- The death rate fell steeply (27 to about 12 per 1000) but the birth rate stayed near 40 until the late 1960s.
- The gap between them, the natural increase, was at its widest.
- This is late Stage 2: fertility-sustained growth on a base of falling mortality.
- Population nearly doubled, from 361 million to 683 million.
- Annual growth peaked at 2.2% in 1961–81.
- Decadal growth was 21.6% (1951–61), 24.8% (1961–71) and 24.7% (1971–81).
- Drivers:
- Control of epidemic diseases: malaria control, smallpox eradication, immunisation.
- The Green Revolution and better food security, which ended famine deaths.
- Planned development: health centres, roads and irrigation.
- Spatial pattern: the Hindi heartland grew fastest. The south began to slow as literacy and health improved, the first sign of regional divergence.
- Thomas Robert Malthus (1798) would have predicted a crisis. India avoided famine through technology and institutions, much as Ester Boserup (1965) argued that population pressure drives agricultural innovation.
- Fear of this growth fed the neo-Malthusian writing of the 1960s and 1970s, which often used India as its example of the Malthusian trap.
Phase IV (1981–2011): High Growth with Definite Signs of Slowing
- Both birth and death rates fell, but births fell faster. This is Stage 3 of the transition.
- The birth rate fell from 33.9 (1981) to 21.8 (2011) per 1000.
- The death rate fell more slowly, from 12.5 to 7.1.
- Decadal growth fell steadily: 23.9% (1981–91), 21.5% (1991–2001) and 17.7% (2001–11). 2001–11 saw the sharpest fall in the growth rate since independence.
- Absolute additions stayed huge because of the large base: about 182 million in each of the last two decades.
- 2001–11 added slightly fewer people than 1991–2001, the first such decade since 1921.
- Structural changes:
- The share of children (0–14) began to fall.
- The share of the working-age population (15–64) rose, opening the demographic dividend.
- Urbanisation and literacy rose.
- Urban growth overtook rural growth:
- In 2001–11 the urban population grew by 31.8% and the rural by only about 12%.
- For the first time since independence, the absolute increase in urban population (about 91 million) exceeded the rural increase (about 90 million).
- Nearly 30% of urban growth came from new census towns, places reclassified as urban as villages grew and diversified.
- The regional contrast sharpened. Kerala and Tamil Nadu reached replacement fertility by the 1990s, while Uttar Pradesh and Bihar still grew by over 20% a decade.
Phase V (since about 2011): Towards Stabilisation
- India’s total fertility rate (TFR) fell to the replacement level of 2.1 in 2019 and has been below it since 2020.
- It was 2.0 in 2020–22 and 1.9 in 2023 and 2024 (SRS Statistical Report 2024).
- The birth rate is 18.3 and the death rate 6.4 per 1000 (2024). The death rate has stopped falling because the population is ageing.
- Growth now comes mainly from population momentum. The large cohorts born in 1980–2005 are in their reproductive years, and even at below-replacement fertility they produce more births than there are deaths.
- India is thus in late Stage 3 moving into Stage 4 (low birth and death rates). Different regions are at different stages at the same time, a “multi-speed” transition.
| Phase | Years | Birth and death rates | Growth | Transition stage |
|---|---|---|---|---|
| I · Stagnant | 1901–21 | Both very high, fluctuating | 238 → 251 m; fall in 1921 | Stage 1 |
| II · Steady | 1921–51 | Births high, deaths falling | 251 → 361 m | Early Stage 2 |
| III · Explosive | 1951–81 | Births high, deaths falling steeply | 361 → 683 m; 2.2% a year | Late Stage 2 |
| IV · Slowing | 1981–2011 | Births falling faster than deaths | 683 → 1,211 m; 17.7% in 2001–11 | Stage 3 |
| V · Stabilising | Since about 2011 | TFR below 2.1 from 2020 | Momentum-led, below 1% a year | Stage 3 to 4 |
Spatial Patterns of Growth
- Growth is not uniform across India. It mirrors differences in female literacy, health care, urbanisation and migration.
- The broad pattern is a north–south divide, which some call demographic dualism.
Pattern in 2001–11 (Census 2011)
- High-growth regions (above 20%):
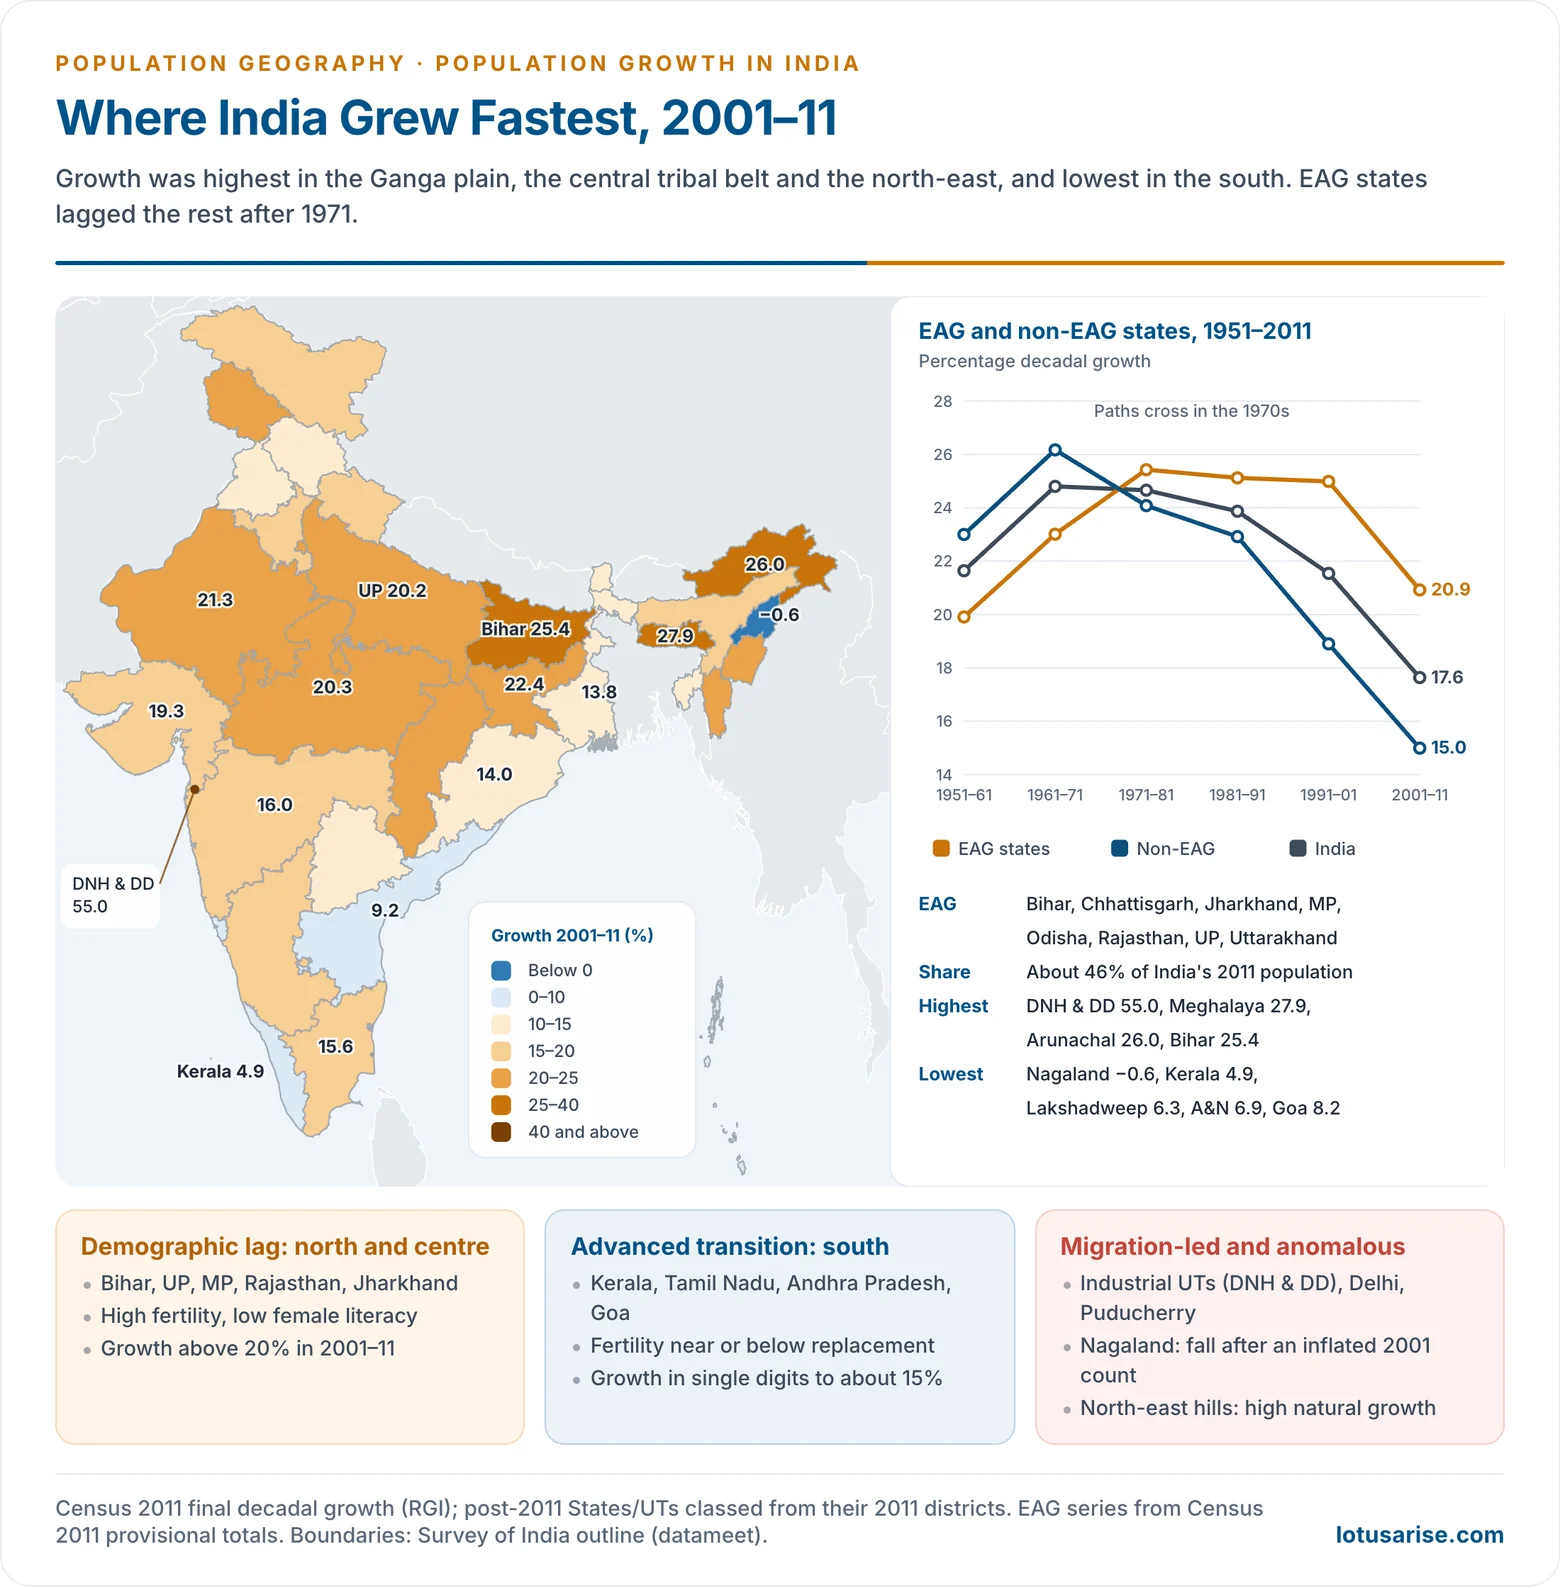
- The Ganga plain and central tribal belt: Bihar (25.4%), Jammu and Kashmir (23.6%), Chhattisgarh (22.6%), Jharkhand (22.4%), Rajasthan (21.3%), Madhya Pradesh (20.3%), Uttar Pradesh (20.2%).
- The north-eastern hill states: Meghalaya (27.9%), Arunachal Pradesh (26.0%), Manipur (24.5%), Mizoram (23.5%).
- These areas combine high fertility, low female literacy, early marriage and an agrarian economy. They are often called demographic lag regions.
- Moderate growth (15–20%): Haryana, Gujarat, Uttarakhand, Assam, Maharashtra, Karnataka and Tamil Nadu (15.6%).
- Here fertility is falling, towns are growing and the economy is diversifying.
- In-migration partly offsets lower fertility in Gujarat, Maharashtra and Haryana.
- Low growth (below 15%): Kerala (4.9%), Goa (8.2%), undivided Andhra Pradesh (11.0%), Himachal Pradesh and Sikkim (12.9%), West Bengal (13.8%), Punjab (13.9%), Odisha (14.0%).
- Kerala is the model of an advanced transition:
- High female literacy.
- Low infant mortality (8 per 1000 in 2024).
- Late marriage and wide health coverage.
- Heavy out-migration to the Gulf.
- Kerala is the model of an advanced transition:
- Migration-led growth:
- The industrial UTs of Dadra and Nagar Haveli (55.9%) and Daman and Diu (53.8%) grew fastest of all, through in-migration of industrial workers, not natural increase.
- Delhi (21.2%) and Puducherry (28.1%) also grew on migration.
- Anomalies:
- Nagaland (−0.6%) was the only state to lose population. Its 1991–2001 growth of 64.5% had been inflated by over-enumeration, and 2001–11 corrected it, along with some out-migration.
- The islands (Lakshadweep 6.3%, Andaman and Nicobar 6.9%) grew slowly because of small bases, limited land and out-migration.
- Urban–industrial clusters grew fastest within states: Delhi NCR, the Mumbai–Pune region, the Ahmedabad–Surat–Vadodara belt, Bengaluru and Hyderabad.
- Wilbur Zelinsky’s (1971) mobility transition links such concentration to development.
- Their growth rests on migration in India from the Ganga plain to the western and southern cities.
Role of Migration
- Internal migration does not change India’s total, but it redistributes growth. It lowers growth in Bihar, Uttar Pradesh and the hill districts and raises it in Delhi, Maharashtra, Gujarat, Haryana and the southern cities.
- International migration has had only occasional large effects:
- Partition (1947) moved about 15 million people across the new borders. It raised growth in Punjab, Delhi and West Bengal and lowered it in districts from which large numbers left for Pakistan.
- The 1971 Bangladesh war brought about 10 million refugees into West Bengal, Tripura and Assam, most of whom returned.
- Continued cross-border movement into Assam, Tripura and West Bengal has long been a political issue in the north-east.
- Emigration to the Gulf, Europe and North America is large in absolute terms but small against India’s size. It lowers growth only in a few districts of Kerala, Goa and coastal Karnataka.
EAG and Non-EAG States
- The Empowered Action Group (EAG) states were identified in 2001 for focused attention on population and health: Bihar, Chhattisgarh, Jharkhand, Madhya Pradesh, Odisha, Rajasthan, Uttar Pradesh and Uttarakhand.
- Together they held about 46% of India’s population in 2011. India’s demographic future is decided largely here.
- They share low literacy (especially female), high poverty, weak health systems and a slow fertility decline.
- 1951–71: both groups grew fast as mortality fell everywhere. Non-EAG states actually grew faster (26.2% against 23.0% in 1961–71).
- After 1971 the paths crossed:
- Non-EAG states slowed steadily, through falling fertility, rising female literacy and urbanisation: 24.1% (1971–81), 18.9% (1991–2001) and 15.0% (2001–11).
- EAG states held at about 25% for three decades (25.4%, 25.1%, 25.0%).
- In 1991–2001 the fall in India’s growth rate came almost entirely from non-EAG states. India’s growth became concentrated in the EAG belt.
- 2001–11: convergence begins. EAG growth fell for the first time, by about 4 percentage points to 20.9%, as schooling, institutional deliveries and family planning spread. India’s rate fell by 3.9 points.
- Since 2011: all non-EAG states have fertility below replacement.
- Among EAG states, Odisha (1.6) and Uttarakhand (1.7) have joined them.
- Bihar, Uttar Pradesh, Madhya Pradesh, Rajasthan, Chhattisgarh and Jharkhand remain above 2.1 (SRS 2024).
- Interpretation: the EAG–non-EAG divide is a regional lag in the transition.
- Fertility falls with development, above all female literacy, health care and urbanisation.
- The lagging states show the Malthusian pressure of land fragmentation and unemployment. The advanced states show Boserupian adaptation through diversification.
The Demographic Divide
- Uneven transition has produced a demographic divide between a young, still-growing north and an ageing, stabilising south.
- Age structure: the south already has a high share of elderly people and a shrinking school-age population. The north will have a large working-age population into the 2050s.
- Migration: workers move from Bihar, Uttar Pradesh and Odisha to the cities and farms of the south and west, which now depend on them.
- Political weight: seats in the Lok Sabha are still allotted on the 1971 population, a freeze extended in 2001 until the first census after 2026. Southern states fear that a fresh delimitation would reward high growth and penalise their success in reducing fertility.
- Fiscal transfers: the use of 2011 rather than 1971 population by recent Finance Commissions raised the same concern.
- Policy reversal: Andhra Pradesh scrapped its two-child rule for local-body candidates in November 2024, citing falling fertility and an ageing population.
Fertility and the Causes of High Growth
Fertility Today
- Total fertility rate (TFR) is the average number of children a woman would bear over her reproductive span (15–49 years) at current age-specific rates. 2.1 is the replacement level.
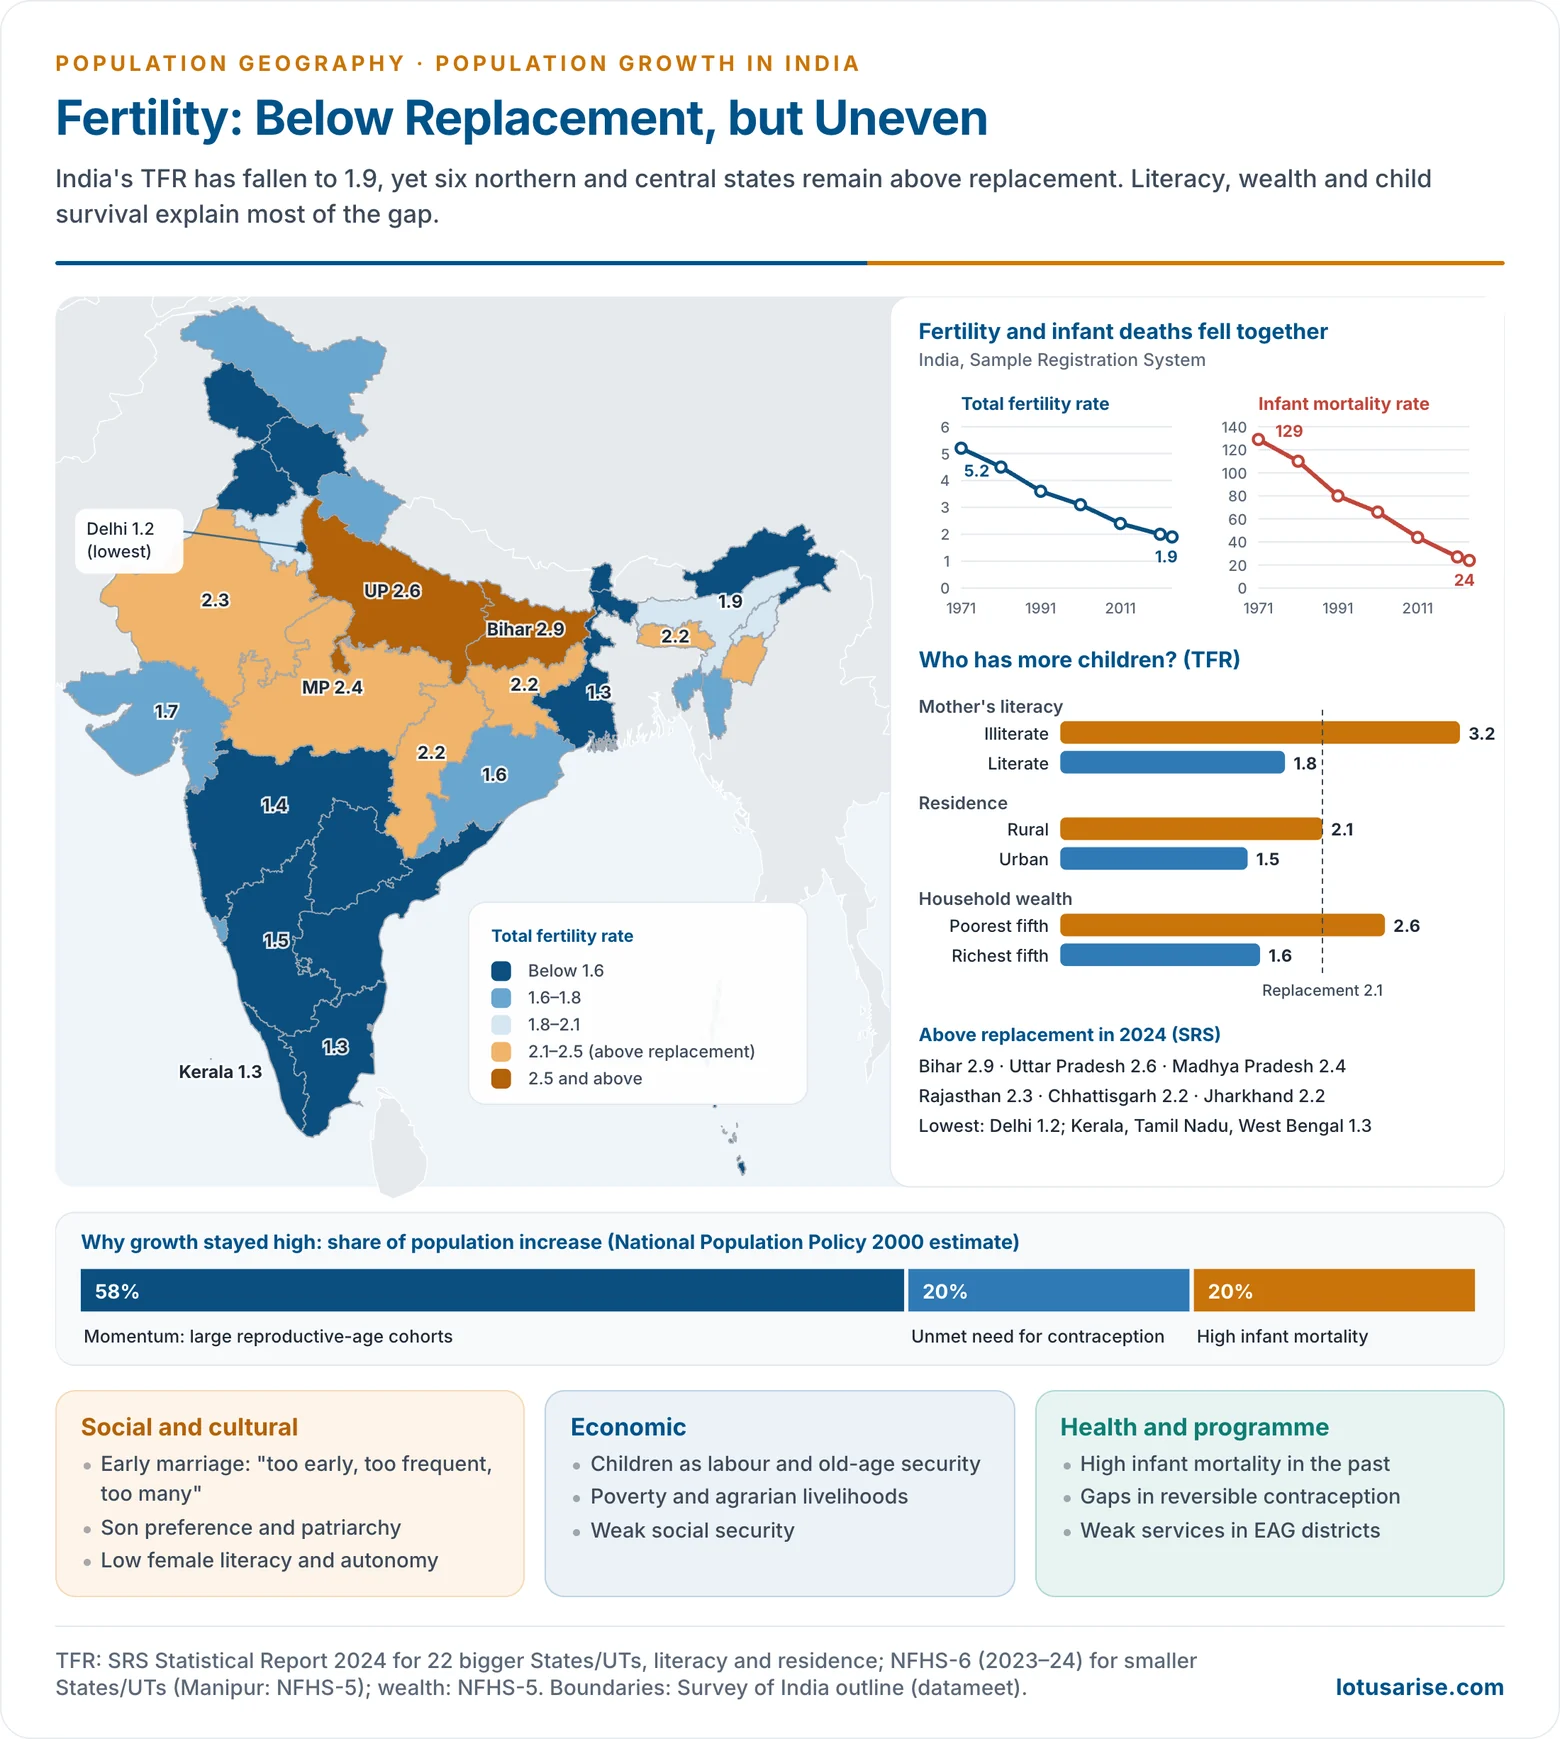
- India’s TFR fell from 5.2 (1971) to 3.6 (1991), 2.4 (2011) and 1.9 (2024) (SRS).
- NFHS-6 (2023–24) also puts India at 2.0 (urban 1.6, rural 2.1). Among states only Bihar (2.7) and Uttar Pradesh, Jharkhand and Meghalaya (2.2) are clearly above replacement.
- Spatial pattern (SRS 2024):
- Above replacement: Bihar (2.9), Uttar Pradesh (2.6), Madhya Pradesh (2.4), Rajasthan (2.3), Chhattisgarh and Jharkhand (2.2). Meghalaya, down from 2.9 (NFHS-5) to 2.2 (NFHS-6), is the outlier in the north-east.
- Lowest: Delhi (1.2); Kerala, Tamil Nadu and West Bengal (1.3); Andhra Pradesh, Jammu and Kashmir, Maharashtra and Punjab (1.4).
- Rural TFR is 2.1 and urban 1.5. Urban India has been below replacement for years.
- Infant mortality fell in step: from 129 per 1000 live births (1971) to 44 (2011) and 24 (2024). As more children survive, parents need fewer births to reach their desired family size.
- The pattern fits the rule that fertility declines with development. The lowest-fertility states have the highest female literacy, the lowest infant mortality and the most urban populations.
- These measures and determinants of fertility now show the southern states with an age composition that resembles an ageing society’s.
Causes of High Population Growth
- India’s high growth in the 20th century came from falling mortality combined with slowly falling fertility, sustained by momentum, social norms, poverty and gaps in services.
Demographic Momentum
- The National Population Policy 2000 estimated that about 58% of population growth came from the large share of people in the reproductive ages. This share was the legacy of past high fertility.
- Even at replacement fertility, a young population keeps growing for decades until its age structure evens out. This is population momentum, the main reason India will grow until the 2060s.
Poverty and Economic Factors
- In poor, agrarian households, children are economic assets:
- They provide labour on farms and in household work.
- They are old-age security where there are no pensions.
- Poverty also limits access to health care and contraception.
- High infant mortality leads families to have extra births as insurance against child deaths. NPP 2000 attributed about 20% of growth to such wanted fertility.
- NFHS-5 shows the gradient: the poorest fifth of households have a TFR of 2.6, the richest fifth 1.6.
Social and Cultural Factors
- Early marriage lengthens the reproductive span. NPP 2000 described the resulting pattern as “too early, too frequent, too many” births.
- In 2023–24, 20% of women aged 20–24 had married before 18 (NFHS-6), down from 23% in 2019–21.
- Son preference leads to repeated births until a son is born. It also drives a sex ratio deficit, which stood at 943 overall and 918 for children (0–6) in 2011.
- The joint family and the low status of young brides limit women’s reproductive choice.
- Female illiteracy is the strongest single correlate of high fertility.
- In 2024, illiterate mothers had a TFR of 3.2, against 1.8 for literate mothers (SRS).
- NFHS-5 gives 2.8 for women with no schooling and 1.8 for those with 12 or more years.
- Some conservative social and religious attitudes discourage contraception, but their effect is smaller than that of education and income.
Unmet Need and Weak Services
- NPP 2000 attributed about 20% of growth to unmet need for contraception: couples who wanted no more children but used no method. In 2000, only 44% of eligible couples were protected.
- Rural health services were weak:
- Few institutional deliveries.
- Reliance on untrained birth attendants.
- A contraceptive mix dominated by female sterilisation.
- By 2023–24 contraceptive use had risen to 69% of married women and unmet need had fallen to 8.5% (NFHS-6). The gaps remain widest in the EAG states and the north-east.
Women’s Status and Reproductive Rights
- The International Conference on Population and Development (Cairo, 1994) made women’s education, health and rights the centre of population policy.
- Fertility falls fastest where women decide on marriage, schooling, work and family size. This shift from control to choice runs through the population policy of India since 1994.
Kerala and the Development–Fertility Link
- Kerala shows that education and social development, not religion, decide fertility.
- Its TFR is 1.3 (2024), although a large share of its people are Muslim or Christian.
- Malappuram, a Muslim-majority district, saw one of the steepest fertility declines in India as girls’ schooling spread.
- Bihar and Uttar Pradesh, with low female literacy and weak services, still have the highest TFRs. Differences between religious groups within a state are far smaller than the differences between states.
| Factor | How it raises growth | Indian evidence |
|---|---|---|
| Momentum | Large cohorts in reproductive ages | About 58% of growth (NPP 2000) |
| Unmet need | Unwanted births | About 20% of growth (NPP 2000); 8.5% unmet need (NFHS-6) |
| Infant mortality | Extra births as insurance | About 20% of growth (NPP 2000); IMR 24 (2024) |
| Female illiteracy | Early marriage, little autonomy | TFR 3.2 vs 1.8 (illiterate vs literate mothers) |
| Poverty | Children as labour and security | TFR 2.6 vs 1.6 (poorest vs richest fifth) |
Consequences of Rapid Growth
- Pressure on land:
- Average operational holdings fell from 2.3 hectares (1970–71) to about 1.1 hectares (2015–16) as land was divided among heirs.
- Marginal holdings now dominate, and cultivation has pushed into forests, slopes and floodplains.
- Food and water:
- The Green Revolution kept food output ahead of population, but at the cost of groundwater depletion in Punjab, Haryana and western Uttar Pradesh.
- Per capita water availability keeps falling as the same rivers serve more people.
- Employment: about 10 million young people enter the labour force each year. Too few find regular non-farm jobs, so underemployment and disguised unemployment persist in agriculture.
- Urban stress: migration-fed city growth outruns housing, transport and sanitation, giving rise to slums, congestion and air pollution in the large metropolises.
- Environment: forest loss, soil erosion, river pollution and biodiversity loss are sharpest where dense rural populations depend on land and wood.
- Services and equity:
- High-growth states must spend more simply to keep school places, health centres and jobs in step with numbers.
- This widens the gap with low-growth states.
- These pressures are mediated by technology, institutions and distribution. India today feeds and educates far more people than it did in 1951, and the same numbers are also a market and a workforce.
Future Growth and the Demographic Dividend
Projections
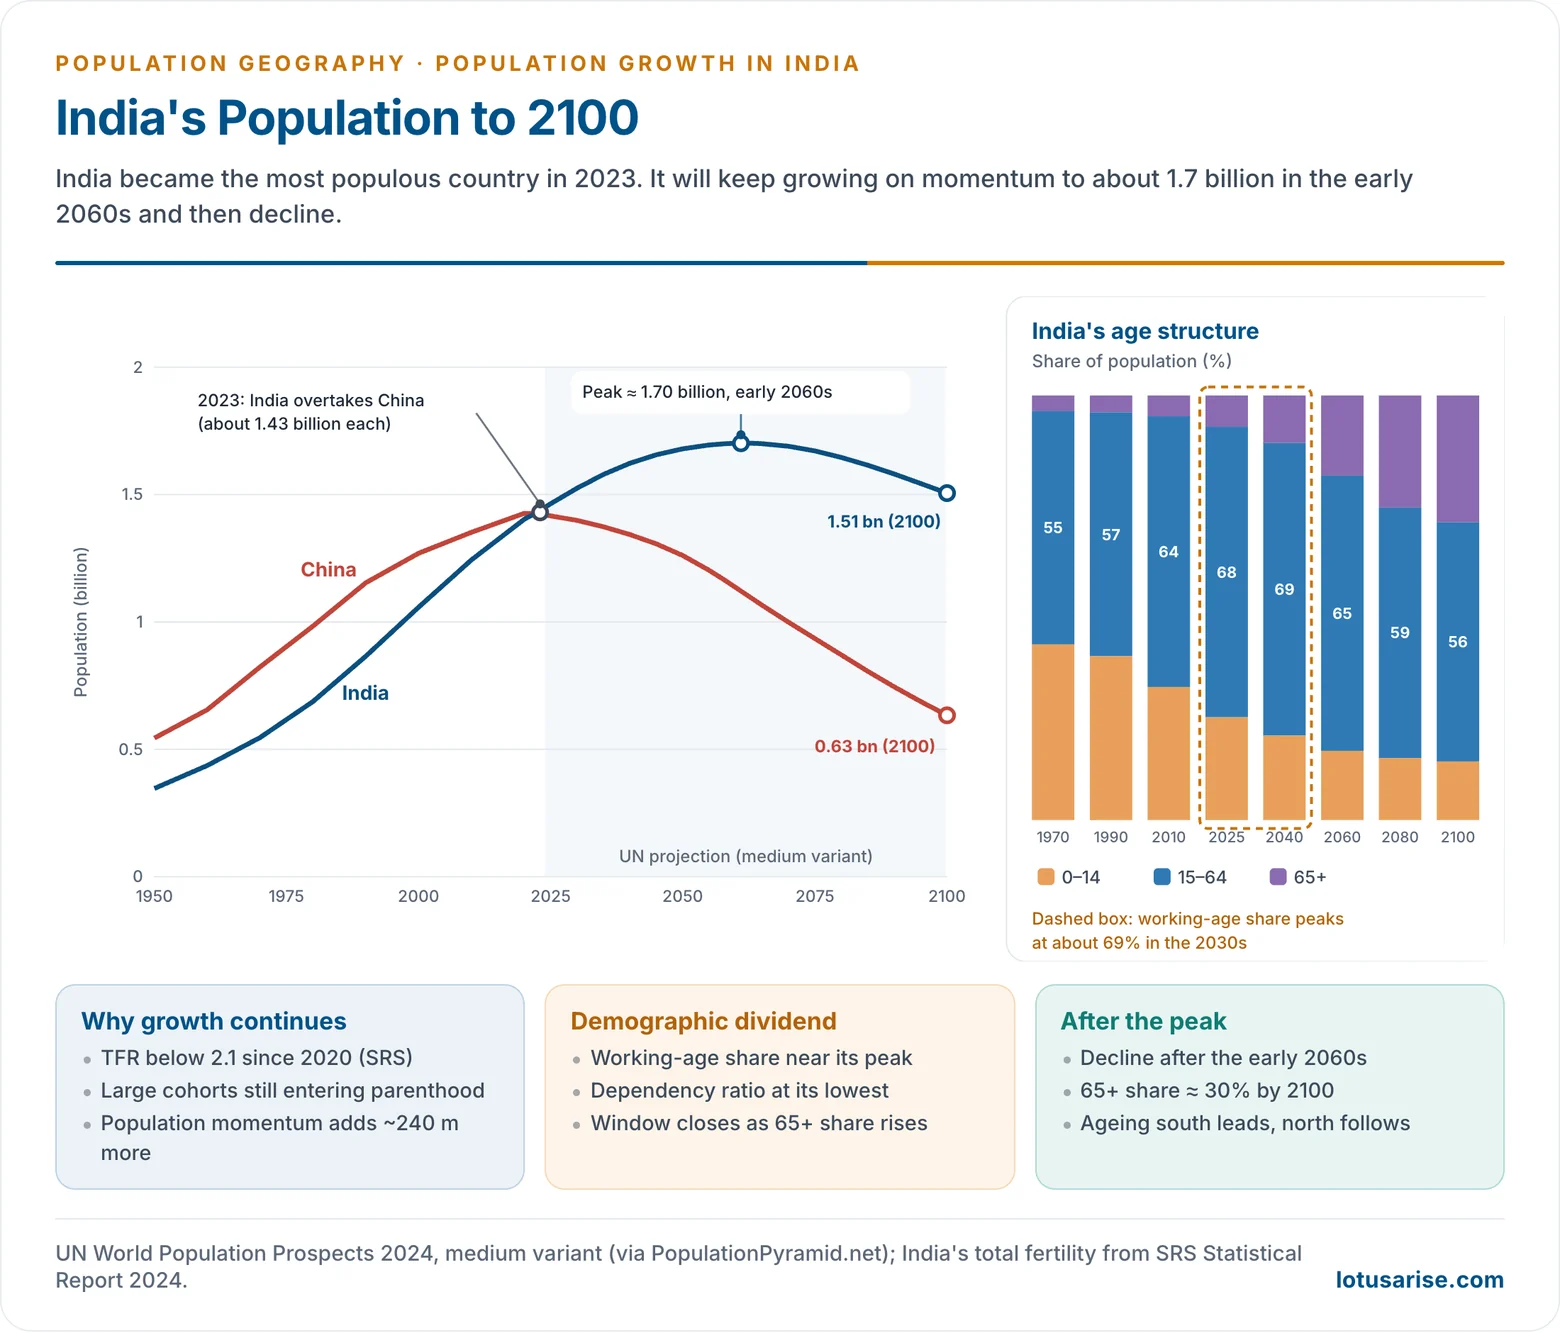
- UN World Population Prospects 2024 (medium variant):
- India overtook China in 2023, when both had about 1.43 billion people.
- India will grow to a peak of about 1.70 billion in the early 2060s, then decline to about 1.51 billion by 2100.
- China is projected to fall from 1.42 billion (2023) to about 0.63 billion by 2100.
- Earlier projections had India overtaking China around 2028. The crossover came sooner because China’s fertility collapsed faster than expected.
- About 240 million more people will be added before the peak, almost all through momentum, since fertility is already below replacement.
- The share of people aged 65 and over will rise from about 7% (2025) to about 15% (2050) and 30% (2100). The median age will rise from under 30 to about 39 by 2050.
- Regional futures will diverge:
- The southern states, Punjab, West Bengal and Himachal Pradesh will stop growing first and age fastest.
- Bihar and Uttar Pradesh will supply most of India’s remaining growth and most of its young workers.
- Migration from north to south will grow.
Demographic Dividend
- The demographic dividend is the potential boost to growth when the working-age share is high and the dependency ratio is low, after fertility has fallen and before the population ages.
- India’s working-age (15–64) share rose from about 55% (1970) to 68% (2025) and will peak at about 69% in the 2030s (UN WPP 2024).
- The dependency ratio (children and elderly per 100 people of working age) fell from about 82 in 1970 to about 46 in 2025, the lowest in India’s history.
- The window is time-bound. It closes earlier in the south, which is already ageing, than in the north, which is still young.
- It pays only if the young are healthy, educated, skilled and employed. Low female labour-force participation and informal jobs are the main risks.
- Turning these numbers into skills and productive work is the idea of population as social capital, or human capital.
Population and Resources
- India shows both sides of the population–resource debate:
- Malthusian pressure: small and fragmented holdings, groundwater depletion, urban congestion and unemployment in the high-growth states.
- Boserupian response: the Green Revolution, multiple cropping, irrigation and the growth of services absorbed a doubling of population without famine.
- India’s population is therefore both a constraint (pressure on land, water and infrastructure) and a resource (labour, markets and skills).
- The challenge has shifted from controlling numbers to managing distribution, quality and regional balance:
- Health and education in the lagging states.
- Jobs for the young.
- Care for a growing elderly population.
Previous Year Questions
1989Analyse the recent trends in the growth and density of population of India and evaluate the socio-economic and environmental problems generated by them.2010Explain how Demographic Transition created Demographic divide in contemporary India.2013Demographic dividend and its implications on Indian socio-economic environment.2013What do you understand by ‘Young India’? How can the present state of population composition be converted into an asset for the country?2020The process of demographic transition is not uniform in India. Examine this statement in the context of demographic transition theory.2022How would decline in Total Fertility Rate (TFR) below the replacement level, in many states of India affect the future population structure of the country?2023With a falling fertility rate and rising median age, how can India translate demographic dividend to economic dividend?2026Examine the trends in fertility rates across Indian states over time. How are they projected to evolve by 2050?





please provide economicgeography notes also
Already provided in separate section of economic geography
It was very comprehensive
U r really doing a great job sir… I am grateful to you sir for this service.
Worth to spend time on this informative blog
This content is so helpful that i can rely on without giving it a second thoughts.
i am very thankful
i love you sir, your content is awesome, trustworthy and reliable
correct onion territory to union territory… seems like a spelling error
Corrected, Thank You 🙏