

- Hydroelectric power is electricity made from falling or flowing water. It is a conventional and also a renewable source: the water drives the machines and is left for later use.
- India’s hydropower stands on two geographical advantages: snow-fed Himalayan rivers with steep gradients, and short, swift Western Ghats streams far from the coalfields.
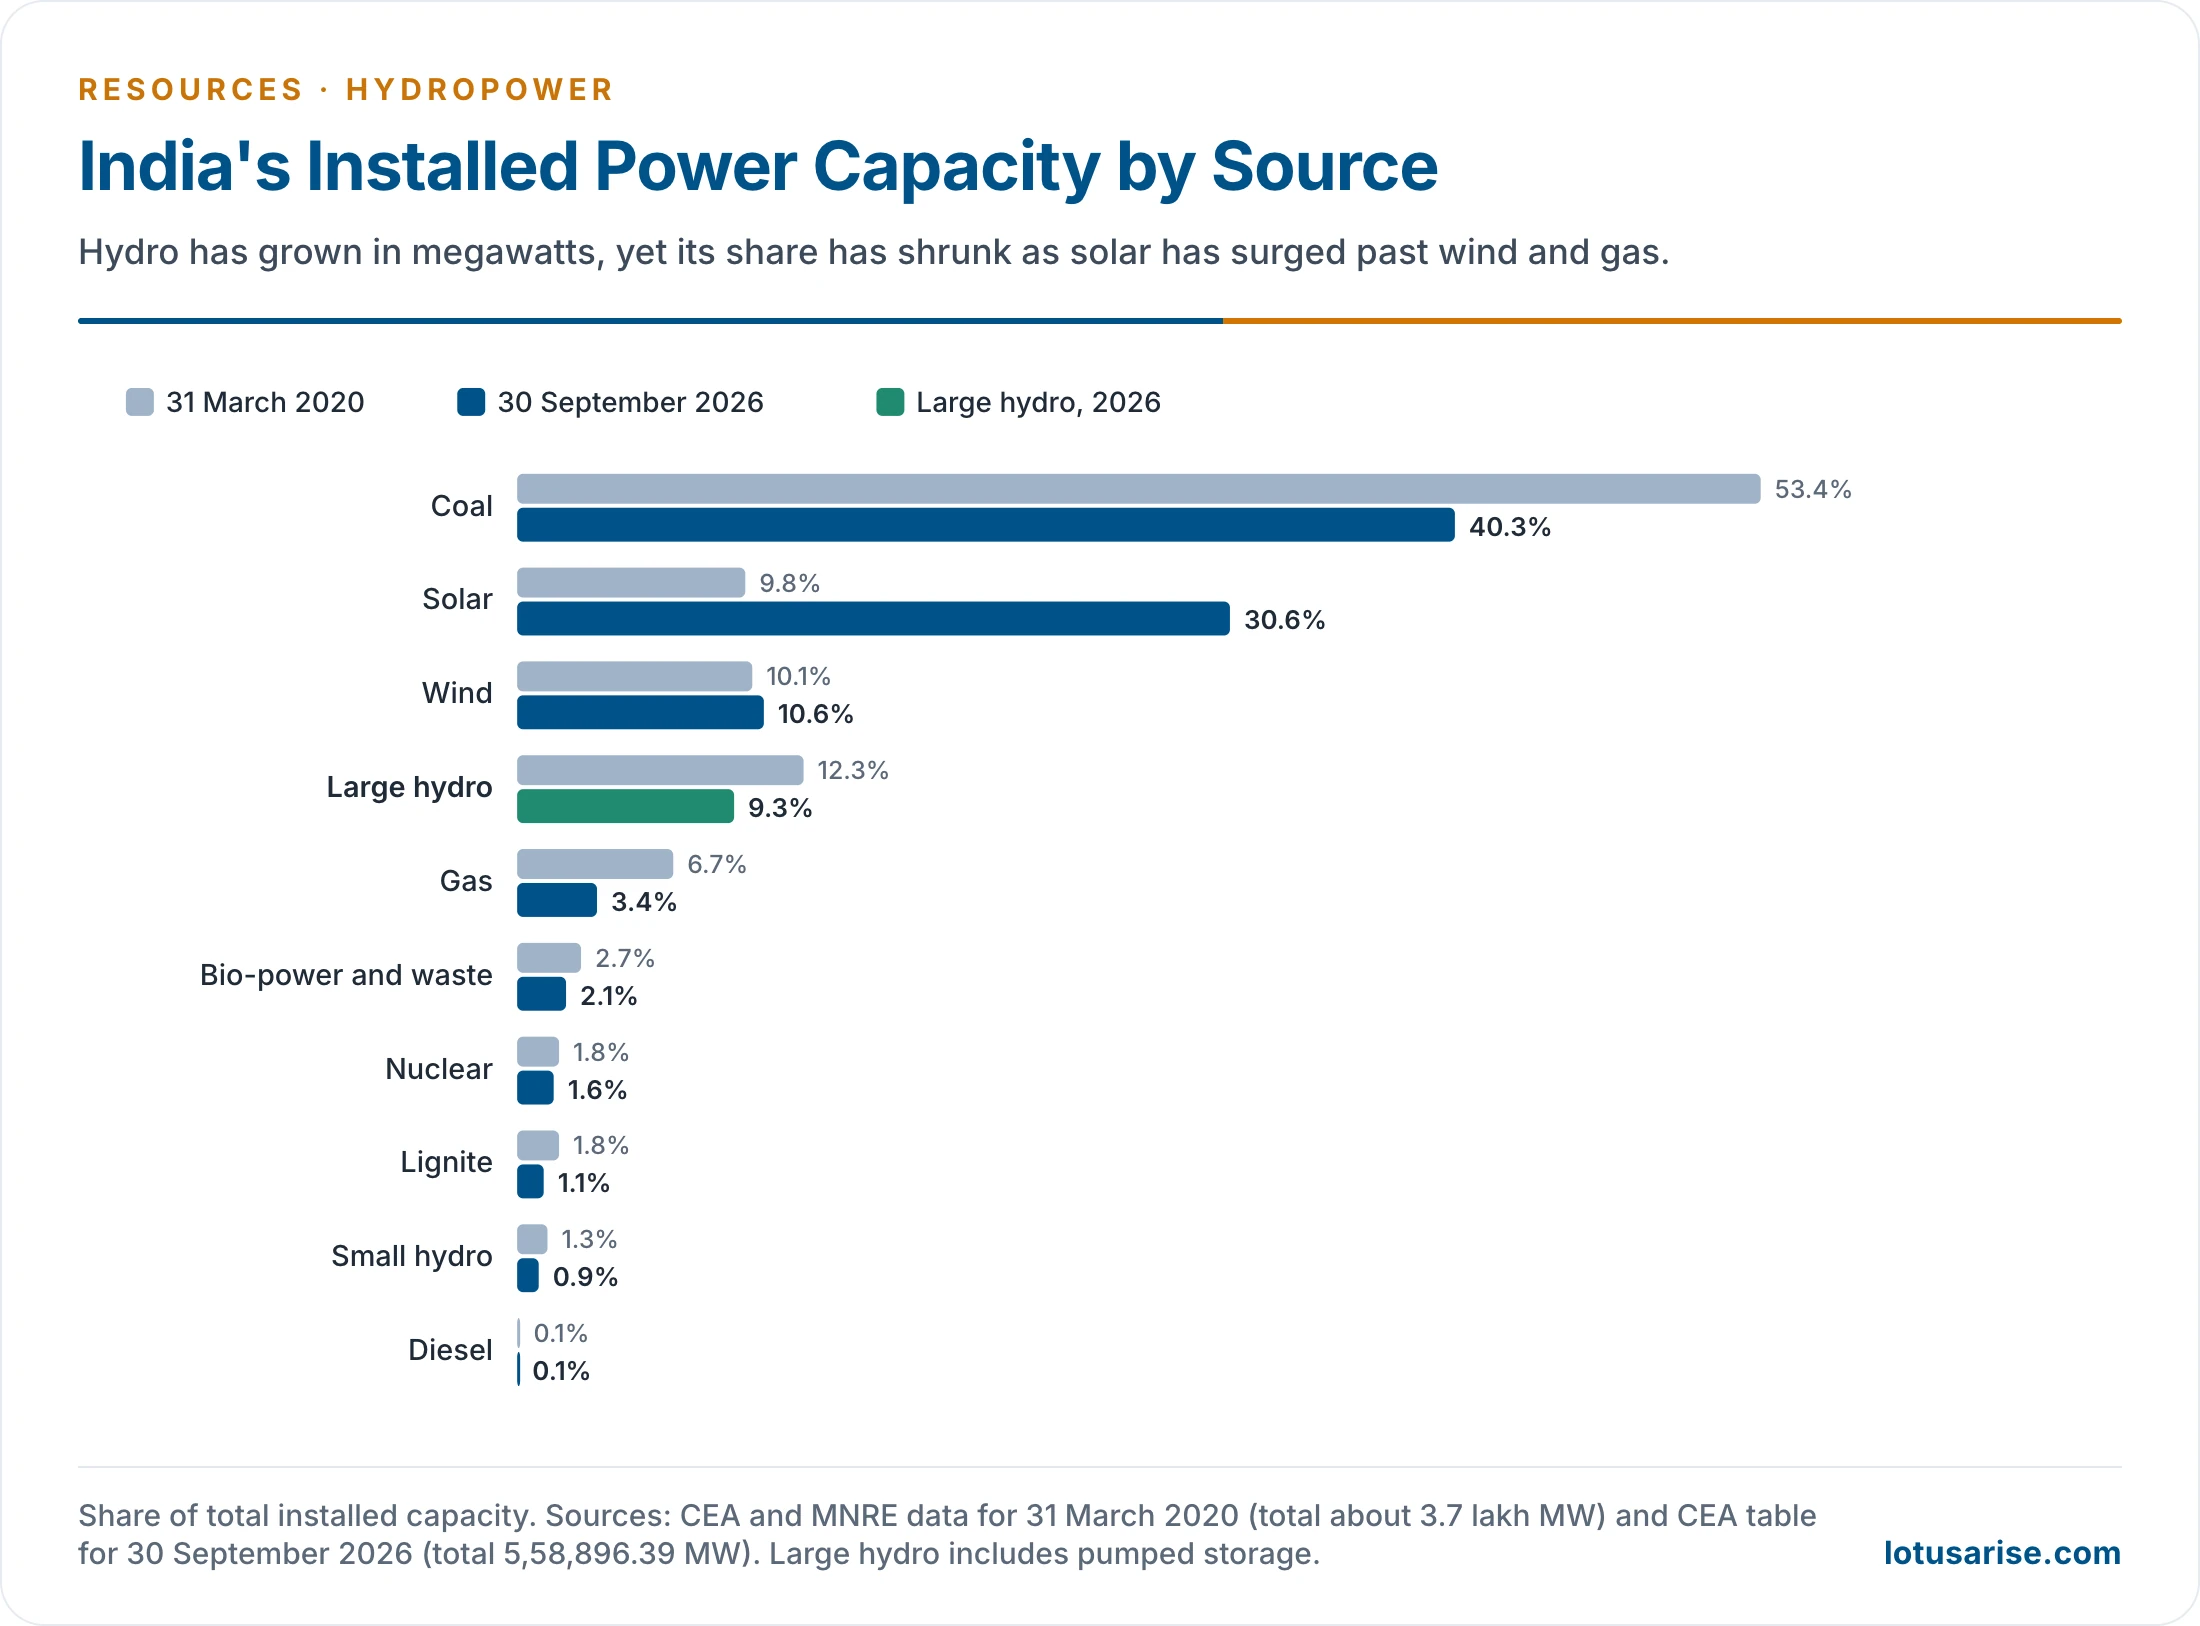
- As on 30 September 2026, large hydro stood at 52,064.66 MW, about 9.3% of the national capacity of 5,58,896.39 MW. Small hydro added 5,181.76 MW (CEA).
Hydroelectric Power
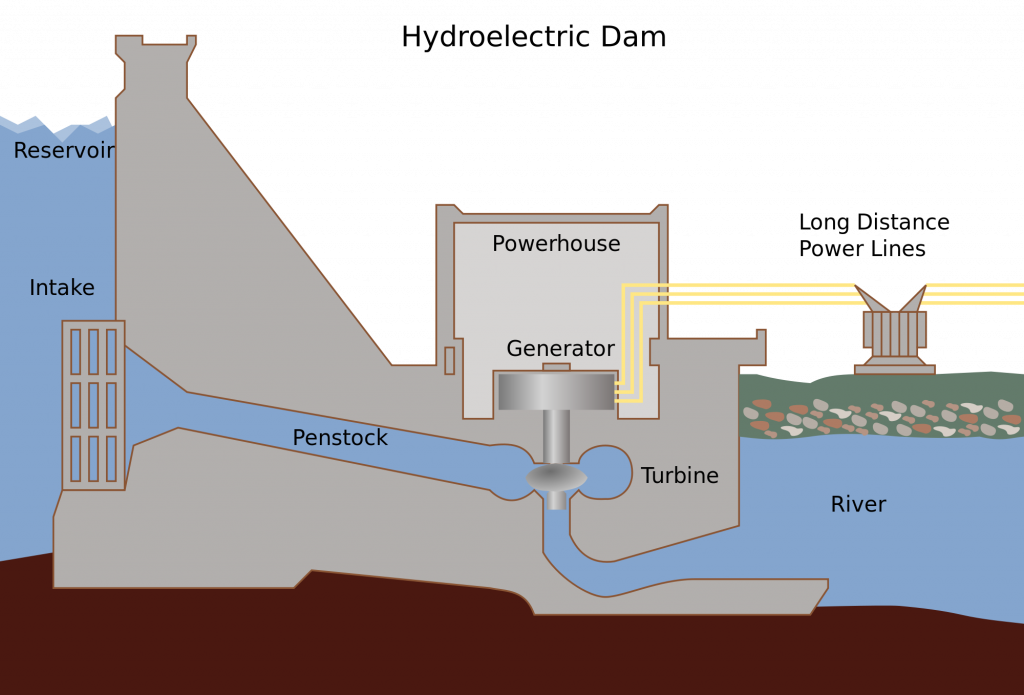
How a Station Works
- Hydraulic power begins with water held at a height, which carries potential energy. As it falls, this becomes kinetic energy.
- The moving water strikes a turbine, which gives mechanical energy, and the turbine shaft spins a generator.
- The output goes to a substation, where transformers step up the voltage before it enters the grid.
- Hydropower has long been called the cheapest and cleanest source, which needs qualifying.
- Operating cost is low and no fuel is burnt, but new large stations carry high initial tariffs.
- Big dams raise environmental and social issues, as at Tehri and on the Narmada.
- Small hydro is far freer of these problems, though not wholly free of them.
Early Development
- Power development in India began in the late 1890s, and hydro led it.
- 1897: the Sidrapong station near Darjeeling, 130 kW, supplied the town.
- 1902: the Sivasamudram (Shivanasamudra) station at the Kaveri falls in Karnataka, the first on a large scale. It powered the Kolar gold mines and Mysore.
- 1907: a 3 MW plant at Mussoorie.
- 1909: the Mohora station on the Jhelum.
- Western Ghats plants followed to serve Mumbai’s growing demand, and the 1930s brought stations in Himachal Pradesh, Uttar Pradesh, Tamil Nadu and Karnataka.
- Capacity stood at only 508 MW in 1947. The Five Year Plans then built multipurpose river projects across the country.
- The National Hydroelectric Power Corporation (NHPC) dates from 1975.
- Installed hydro rose from 0.6 thousand MW in 1950-51 to 40.5 thousand MW in 2013-14 and 52,064.66 MW by 2026.
- Older counts gave India 197 hydro power plants. The number moves with every commissioning and with the capacity limit used.
Types of Hydro Stations
- There are three types of facility, and not all of them need a dam.
| Type | Working | Dam? | Indian example |
|---|---|---|---|
| Impoundment | A dam stores river water in a reservoir. Released water spins a turbine, which turns a generator | Yes; the commonest type, usually large | Bhakra, Tehri |
| Diversion (run-of-river) | Part of the river goes through a canal or penstock and then through a turbine | May need none, or only a small one | Nathpa Jhakri, Subansiri Lower |
| Pumped storage | Water is pumped to an upper reservoir when demand is low and released through the turbines when demand peaks | Two reservoirs | Tehri, Pinnapuram |
- Pumped storage works like a battery. It stores surplus power from other sources, such as solar, wind and nuclear, for later use.
- It became central to the grid once solar output began to flood the midday hours.
- It stores energy; it is not a net source of it.
Classification by Installed Capacity
- Hydro projects are generally divided into small and large. In India, stations of up to 25 MW are Small Hydro Power (SHP).
- Micro: up to 100 kW.
- Mini: 101 kW to 2 MW.
- Small: 2 MW to 25 MW.
- Mega status under the Mega Power Policy (first framed in 1995) goes to hydro projects of 500 MW or more.
- For thermal projects the policy threshold is 1,000 MW or more. Older accounts give 1,500 MW.
- Who governs what: the Ministry of Power looks after large hydro, and the Ministry of New and Renewable Energy (MNRE) holds the mandate for small hydro.
Small Hydro Power
- SHP covers projects of up to 25 MW. The limit is a national choice with no global standard.
- China uses 50 MW, Brazil 30 MW, Australia and the European Union 20 MW, Norway 10 MW, the UK 5 MW and Sweden 1.5 MW.
- Most SHP is run-of-river, with a small barrage or only a weir that stores little or no water.
- This spares it most of the local damage of large-scale hydro, and it can serve remote rural areas independently, where extending the grid does not pay.
- Karnataka’s policy limits such projects in the Western Ghats and forest areas, because even small diversions can dry stream stretches.
- India and China are the major SHP players, with the highest numbers of installed projects.
- Estimates of the potential have grown with each survey:
- Older estimates: 6,780 MW, then about 19,750 MW at 6,474 sites.
- July 2016 database: 21,135.37 MW from 7,135 sites, assessed by the Alternate Hydro Energy Centre (AHEC) of IIT Roorkee. This is the source of the rounded 20 GW. MNRE now quotes about 21,133 MW at 7,133 sites.
- Status: 5,181.76 MW installed on 30 September 2026, about a quarter of the potential. It stood at 1,905 MW and 573 projects in 2006, and 3,456 MW and 939 projects in 2012.
- Leading potential: Himachal Pradesh, Karnataka, Arunachal Pradesh, Jammu and Kashmir, Uttarakhand and Chhattisgarh.
- Small Hydro Power Development Scheme: approved on 18 March 2026, with ₹2,584.60 crore for 2026-27 to 2030-31, aimed at about 1,500 MW from projects of 1–25 MW.
Geographical Conditions for Hydropower
- Perennial, large flow: this depends on rainfall and snow.
- Sufficient head: a natural fall, a dam across the river, or a diversion from one basin to another.
- A nearby market: large-scale storage of electricity has only recently become practical, and long lines waste power.
- Older figures put the loss at 8% over 160 km and 21% over 800 km. Power from Bhakra consumed at Delhi lost about 15%.
- Capital: generation is capital-intensive, since falls are few and dams costly.
- Technology: generation, distribution and use all depend on the technical level of the region.
- The erratic monsoon regime, the shortage of natural falls and sites far from consumers explain why development lagged behind potential. The monsoon sets this regime.
| Feature | Himalayan rivers | Peninsular rivers |
|---|---|---|
| Water source | Rain and snowmelt, so perennial | Rain alone, so a long lean season |
| Slope | Steep, dissected terrain, high velocity | Gentler; falls where the plateau edge drops |
| Storage | Run-of-river is widely possible | Storage is essential to regulate flow |
| Rival water use | Low in the upper reaches | Upper reaches seldom suit irrigation, so little clash there |
| Why develop it | About three-fourths of the potential | The south and west lie far from the coalfields |
| Key areas | Indus, Ganga, Brahmaputra basins | Western Ghats, north-west Karnataka, Nilgiri and Anamalai hills, upper Narmada |
Advantages of Hydropower
- Renewable: it uses water without consuming it, leaving this vital resource for other uses.
- No fuel: with no consumables there is little recurring cost, so long-term expenditure stays low.
- Cheaper at old stations and steady in price: old stations undercut coal and gas plants, and with no fossil fuel in the tariff, generation is free of fuel inflation.
- It also cuts financial losses from frequency fluctuations.
- Peak load: stations start and stop quickly, which makes hydro the preferred answer to grid peaks.
- The same feature gives ramping, black start and spinning reserve.
- A balanced mix with thermal: the two have complementary operating needs, and a good mix uses capacity best.
- Seasonal fit: in summer and monsoon, high hydro output meets the heavy agricultural load.
- In winter, thermal stations run at base load and hydro stations work as peak stations, taking care of weather-beating loads.
- Other gains: reservoirs can add flood moderation, irrigation, drinking water, aquaculture and recreation.
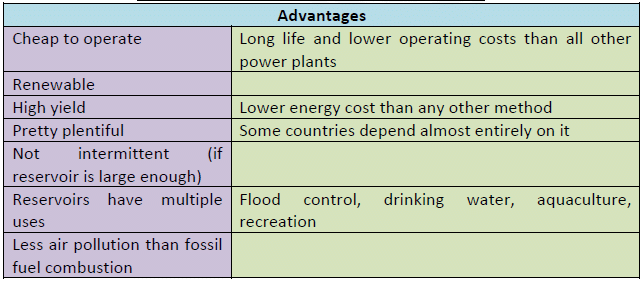
- This table’s claim of “lower energy cost than any other method” now holds only for old, paid-off stations.
Disadvantages of Hydroelectric Power
- Capital-intensive: among the costliest ways to build generating capacity.
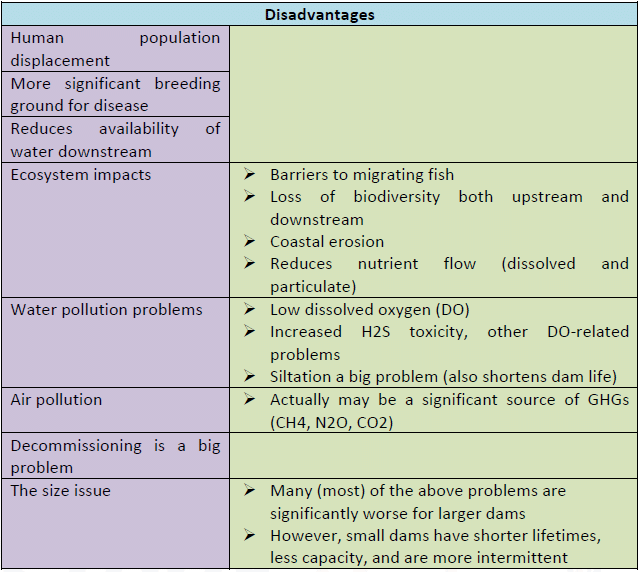
- Forest loss: projects lie mostly in hilly areas, where forest cover is better than in the plains, so diverting forest land is sometimes unavoidable.
- Submergence: reservoirs drown land and cause loss of flora and fauna and large-scale displacement.
- Site-bound: dams can only be built at specific locations.
- Farmland: large areas of agricultural land go under water.
- Hazard: Himalayan projects sit in the path of slope failures and glacial floods.
- The Chamoli disaster of 7 February 2021 destroyed the 13.2 MW Rishiganga project and seriously damaged Tapovan–Vishnugad (520 MW).
- The South Lhonak Lake outburst of 3–4 October 2023 destroyed the Chungthang dam of the 1,200 MW Teesta-III project and damaged the Teesta-V station downstream.
- Silting shortens reservoir life: Gobind Sagar lost over half a million acre-feet of storage between 1963 and 1988.
- The wider environmental account of large dams belongs with the impacts of large dams and mining.
Hydropower in India
Installed Capacity and Share
- Dated position kept for comparison: on 31 March 2020, utility-scale hydro was 46,000 MW, or 12.3% of total capacity. Small hydro was 4,683 MW, or 1.3%.
- Latest position (30 September 2026): large hydro 52,064.66 MW (about 9.3%); small hydro 5,181.76 MW (about 0.9%).
- The large-hydro figure includes pumped storage. Schemes above 25 MW excluding pumped storage were about 44,639 MW in operation, with about 13,274 MW under construction, in the August 2026 basin table.
- The share keeps falling: 50.36% of capacity in the 1960s, about 13% in 2018-19, and about 9.3% now. This reflects the rush of solar and thermal capacity, not a fall in hydro itself.
- Generation: 156 TWh in 2019-20, excluding small hydro, at an average capacity factor of 38.71%. The 2025-26 planning estimate was also 156 billion units, or 8% of generation.
- Output depends on the monsoon: 2023-24 saw a 16.3% fall after weak rain.
- World rank: India has been placed 5th globally for installed hydro capacity. This rank dates from about 2020.
- Regional pattern of capacity (30 September 2026): Northern 22,065.76 MW; Southern 13,596.15 MW; Western 7,392 MW; Eastern 5,987.75 MW; North Eastern 3,023 MW.
- Ownership: older data gave the public sector 92.5% of production. Sector data for 2026 shows central and state undertakings holding 88.5% of hydro capacity, so private growth remains modest, despite hopes for the Himalaya and the north-east.
- NHPC, SJVN, THDC, NEEPCO and State utilities do most of the building.
- Bhutan: India also imports surplus hydroelectric power from Bhutan.
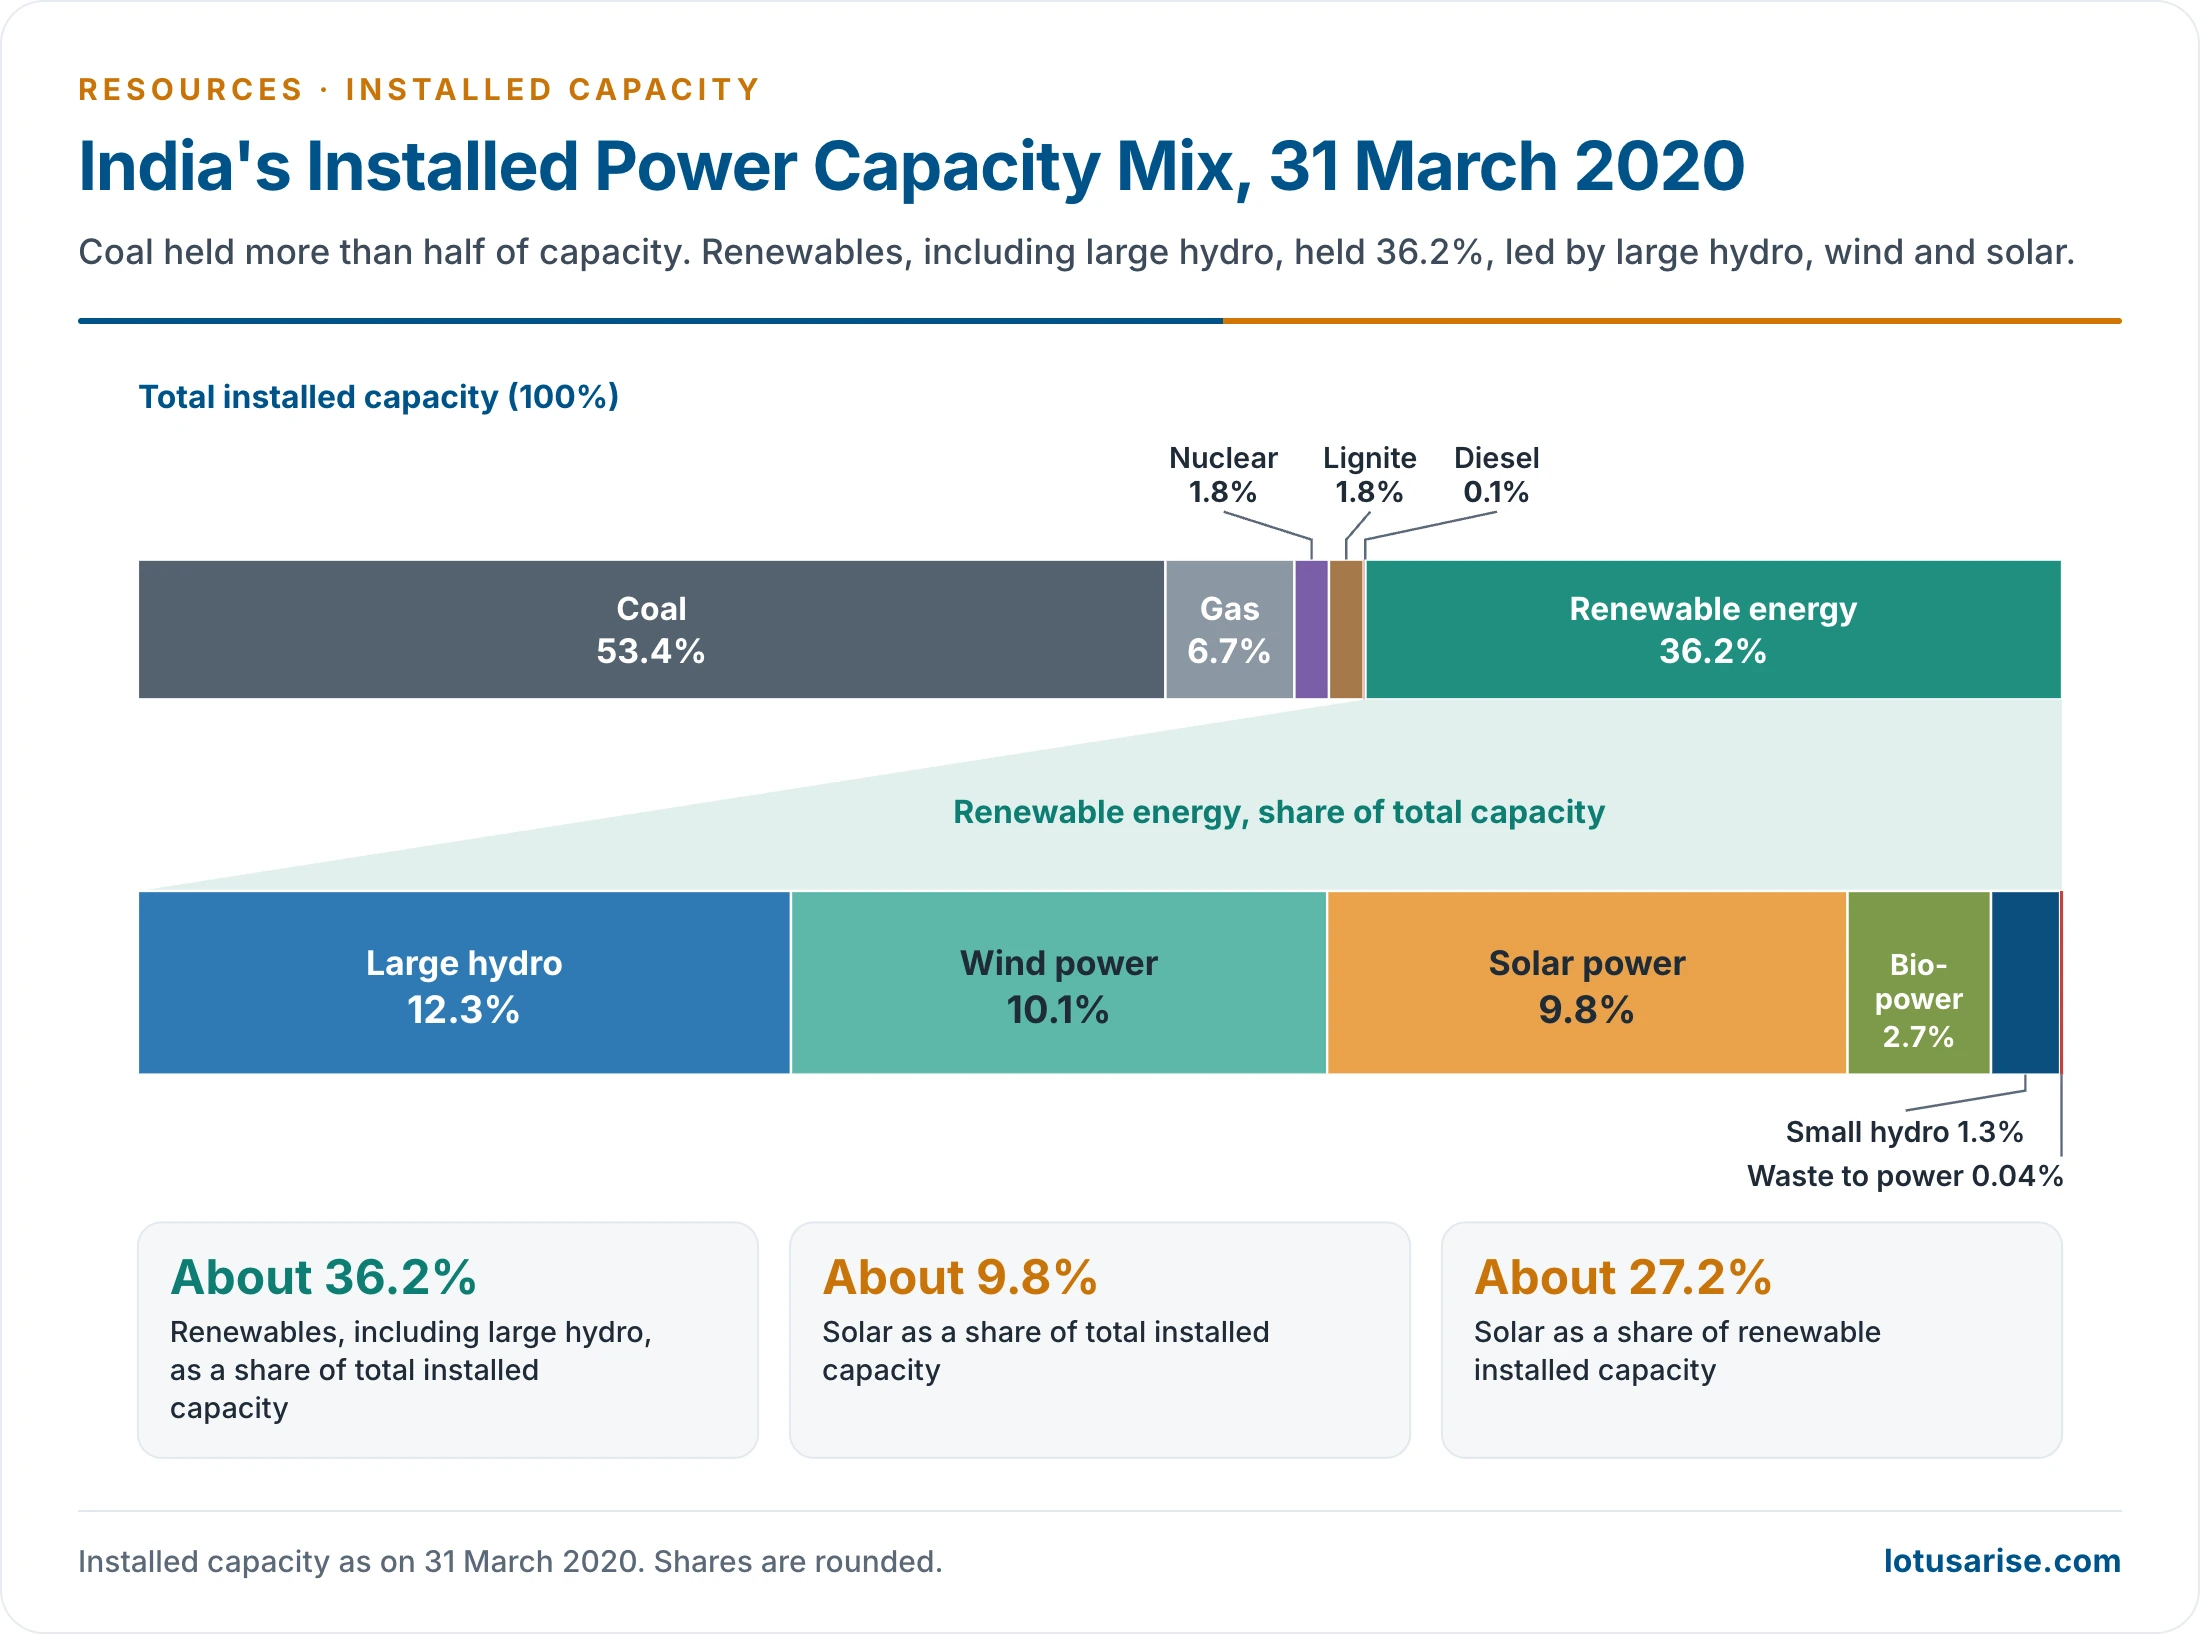
- This chart gives the mix on 31 March 2020, when solar was only 9.8%.
Potential
- Load factor: the ratio of energy actually used in a period to the energy that would have been used had peak demand run throughout. Hydro potential is often quoted at a stated load factor, so the figures below measure different things.
| Assessment | Measure | Figure |
|---|---|---|
| Central Water and Power Commission (older) | At 60% load factor | About 40 million kW |
| CEA re-estimate, 1978–87 | At 60% load factor | 84,000 MW, about 450 billion units a year |
| The same study | As installed capacity | 1,48,700 MW |
| The same study, schemes above 25 MW | As installed capacity | 1,45,320 MW |
| CEA reassessment, 2017–23 | Exploitable, schemes above 25 MW, no pumped storage | 1,33,410 MW |
- So 148,700 MW is an installed-capacity figure. At 60% load factor the same resource is about 84,000 MW.
- The older division of potential by basin:
| Basin | Potential at 60% load factor (thousand MW) | Share (%) | Exploitable capacity, 2017–23 (MW) |
|---|---|---|---|
| Brahmaputra | 35.0 | 41.7 | About 62,727 |
| Indus | 20.0 | 23.8 | About 32,322 |
| Ganga | 11.0 | 13.1 | About 15,591 |
| East-flowing rivers | 9.0 | 10.7 | Rest, about 22,770, in the four peninsular groups together |
| West-flowing rivers | 6.0 | 7.1 | As above |
| Central Indian basins | 3.0 | 3.6 | As above |
| Total | 84.0 | 100 | 1,33,410 |
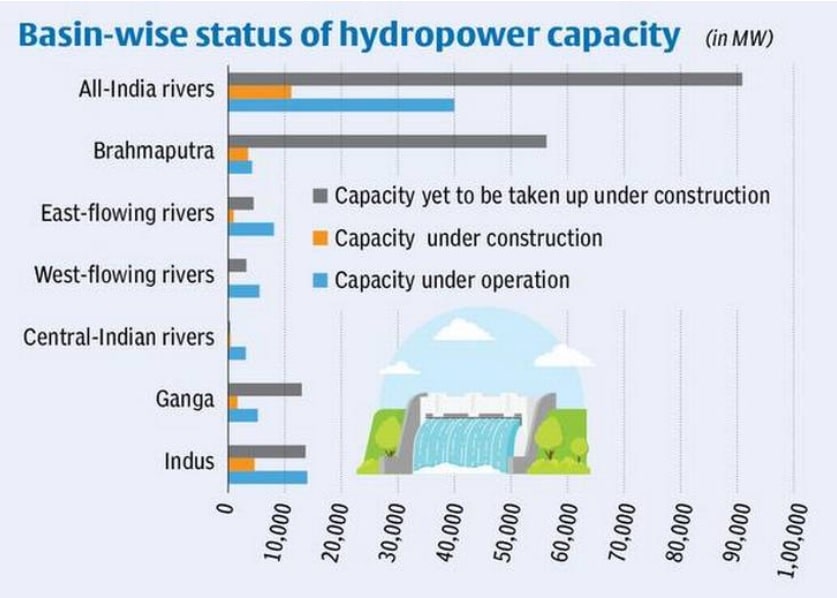
- This undated chart shows about 40,000 MW under operation. The “All-India rivers” row is the total of the basins below it.
- Where the resource lies: mainly in the northern and north-eastern regions, along the Indus, Ganga and Brahmaputra systems.
- Arunachal Pradesh has the largest unexploited potential, put at 47 GW, followed by Uttarakhand at 12 GW.
- Arunachal Pradesh, Himachal Pradesh, Jammu and Kashmir and Uttarakhand together hold about half of the potential.
- Other States with potential: Maharashtra, Chhattisgarh, Karnataka and Keralam (Kerala).
- Pumped storage: estimates have climbed sharply as off-stream sites were mapped.
- Older figure: over 90 GW at 63 sites, recognised in national energy policy for its grid services.
- CEA, end-2025: about 266.8 GW, of which 58 GW is on-stream and 209 GW off-stream.
- Roadmap of early 2026: 100 GW by 2035-36, from ten stations of about 7 GW then working.
Issues in Hydropower Generation
- Central India: hydro in the Godavari, Mahanadi, Nagavali, Vamsadhara and Narmada basins has not been developed on a major scale, because of likely opposition from tribal populations.
- Falling share: hydro gave around 10% of generation with thermal at about 80%, in the position of about 2020.
- Slow execution: projects suffer from complex planning, long land acquisition and resettlement, weak enabling infrastructure including transmission, thin markets and scarce long-term finance.
- Stalled projects: many languish from contract disputes, environmental litigation, local unrest, financial stress and unwilling buyers.
- Slow additions: only about 10,000 MW was added in the 10 years to 2019.
- Inter-State conflict: water and water power are State subjects, so riparian disputes delay projects.
- Subansiri Lower (2,000 MW) on the Arunachal–Assam border is the prime example: protests over downstream effects halted work on 16 December 2011. By 24 October 2026, five of its eight 250 MW units, 1,250 MW in all, were in commercial operation, and the rest are scheduled by December 2026.
- Geopolitics: large storage in Arunachal Pradesh is also a reply to China’s Yarlung Tsangpo project, begun on 19 July 2025.
- Siang Upper Multipurpose Project: a proposed 11,200 MW, still at preliminary feasibility stage in October 2026 and opposed locally.
- Dibang (2,880 MW): under construction, scheduled for February 2032.
- Western rivers: Ratle (850 MW), Pakal Dul, Kiru and Kwar are under construction in the Chenab basin, where the Indus Waters Treaty, held in abeyance by India since 23 April 2025, frames all building.
Clearance Issues
- Environmental clearance stays necessary for hydroelectric projects (HEPs).
- Several HEPs were dropped or redesigned on environmental grounds.
- E-flow, free-flow stretches, eco-sensitive zones and effects on wild flora and fauna are now better defined.
- The potential, including pumped storage, therefore needed reassessment with modern technology. The 2017–23 study did this for conventional schemes.
- Techno-economic clearance (TEC): thermal projects need none from the Central Electricity Authority (CEA), but HEPs above ₹1,000 crore need its concurrence.
- Site-specific changes during construction also need approval.
- Clearance comes in consultation with the Central Water Commission (CWC) and takes an inordinately long time.
- Proposed fix: shorten the TEC process, and place a CWC unit inside the CEA.
- More than engineering: these projects carry large socio-economic and environmental implications.
- Geological surprises are common during construction.
- Land acquisition needs a public hearing and Gram Sabha approval. Forest clearances take time.
- Resettlement and rehabilitation (R&R) is sensitive and costly, and is often under-budgeted at approval. This causes later cost and time overruns.
- Proposed fix: make adequate R&R cost part of the project cost, and include experts in social science, environment and communication in the project team.
- Allotting projects after clearances, on the pattern of Ultra Mega Power Projects, would avoid delay and overrun.
Financial Aspects
- Access: HEPs sit in difficult sites and need roads and bridges, which also open up neighbouring areas.
- Enabling infrastructure support (March 2019): ₹1.5 crore per MW up to 200 MW and ₹1 crore per MW above 200 MW.
- September 2024: Cabinet approved ₹12,461 crore for such infrastructure, covering 31,350 MW. The grant process still needs streamlining.
- Flood moderation: large HEPs perform it but earned no grant unless declared a national project by the Ministry of Water Resources (now Jal Shakti). The Ministry of Power now supports it case by case.
- Tariff: with a debt-equity ratio of 70:30, tariffs were set to recover debt in the first 12 years. This frontloading made hydro unviable.
- The 2019 reform: debt repayment over 18 years, project life of 40 years, and an escalating tariff of 2% a year to bring down the initial tariff.
- Tariff regulations had to change to apply this, and tariff reform alone does not address cost and time overrun.
- Contracts: geological surprises, R&R and environmental factors create situations the contracts never foresaw, leading to arbitration, litigation and delay.
- Delayed payments cripple contractors, so a quick mechanism for resolving contract disputes is needed.
Solutions for Hydropower
- Climate commitments: India pledged 40% of installed capacity from non-fossil sources by 2030, and pursued renewable targets of 175 GW by 2022 and 450 GW by 2030.
- Since revised: 50% by 2030 (2022), 500 GW by 2030, and 60% by 2035 (2026). The 50% share was reached in June 2025, and non-fossil sources stood at over 54% of about 552 GW on 31 July 2026.
- Hydro matters here for grid integration of renewable energy and for balancing its infirmity.
- Policy reforms: the 2008 Hydro Power Policy encouraged private participation, and the 2016 National Tariff Policy dealt with frequency response markets and longer certainty of power purchase agreements.
- Monitoring: the CEA and Ministry of Power have fast-tracked priority schemes, notably the 50,000 MW Hydro Electric Initiative.
- Renewable status: in March 2019, the Government recognised large hydropower as renewable. Projects built after that date can benefit from the renewable purchase obligation. Earlier, only projects up to 25 MW counted.
- Hydropower purchase obligation (HPO): foreseen in the 2019 decision and the Draft Electricity (Amendment) Bill 2020, and fixed by order of 29 January 2021, rising from 0.18% in 2021-22 to 2.82% in 2029-30.
- It now falls within the wider renewable consumption obligation under the Energy Conservation Act 2001.
- Ideas from observers: new ancillary service markets, full renewable status with separate purchase benefits, and more integrated planning.
- Draft policies were expected to help stalled projects and private uptake and make tariffs more competitive.
- Record of performance:
- In 2020, the sector was praised for restoring electricity to tens of millions after a huge plunge in demand.
- In 2019, the Teesta-V station (510 MW) in Sikkim was rated an example of international good practice in sustainability after an independent assessment, four years before the 2023 flood damaged it.
Way Forward
- The better option is to re-engineer the power market: treat hydropower as peaking and grid-balancing power, and spread its higher tariff across all energy consumed, on a prorated basis.
- Hydro’s future lies increasingly in this role, beside thermal and wind power, and within the wider energy transition.
Plants and Projects
List of Hydroelectric Power Plants in India
| State | River | Plant |
|---|---|---|
| Andhra Pradesh–Telangana | Krishna | Nagarjunasagar |
| Andhra Pradesh–Telangana | Krishna | Srisailam |
| Andhra Pradesh, Odisha | Machkund | Machkund |
| Gujarat | Narmada | Sardar Sarovar |
| Himachal Pradesh | Baira | Baira-Siul |
| Himachal Pradesh | Satluj (Sutlej) | Bhakra Nangal |
| Himachal Pradesh | Beas | Dehar |
| Himachal Pradesh | Satluj | Nathpa Jhakri |
| Himachal Pradesh | Baspa | Baspa-II |
| Himachal Pradesh | Beas | Pandoh Dam |
| Himachal Pradesh | Ravi | Chamera-I |
| Himachal Pradesh | Ravi | Chamera-II |
| Himachal Pradesh | Beas | Pong |
| Jammu and Kashmir | Chenab | Salal |
| Jammu and Kashmir | Jhelum | Uri |
| Jammu and Kashmir | Chenab | Dulhasti |
| Jharkhand | Subarnarekha | Subarnarekha |
| Karnataka | Kalinadi | Kalinadi |
| Karnataka | Sharavathi | Sharavathi |
| Karnataka | Kaveri | Shivanasamudra |
| Keralam | Periyar | Idukki |
| Madhya Pradesh | Sone | Bansagar |
| Madhya Pradesh | Narmada | Indira Sagar |
| Uttar Pradesh, with the reservoir reaching Madhya Pradesh | Rihand | Rihand |
| Maharashtra | Koyna | Koyna |
| Manipur | Leimtak | Loktak |
| Odisha | Sileru | Balimela |
| Odisha | Mahanadi | Hirakud |
| Sikkim | Rangit | Rangit |
| Sikkim | Teesta | Teesta |
| Uttarakhand | Bhagirathi | Tehri |
- More stations appear in the plant list and by State below.
| State or region | Other stations |
|---|---|
| Jammu and Kashmir | Lower Jhelum, Chenani, Sind, Baglihar, Karrah, Banihal |
| Himachal Pradesh, Punjab | Giri Bata, Andhra, Binwa, Rukti, Rongtong, Bhabanagar, Bassi, Ganguwal, Kotla, Upper Bari Doab |
| Uttar Pradesh, Uttarakhand | Khodri, Chibro (Tons), Matatila (Betwa), Obra, the Upper Ganga Canal falls |
| Rajasthan | Rana Pratap Sagar, Jawahar Sagar |
| Madhya Pradesh | Gandhi Sagar, Pench, Bargi |
| Jharkhand, West Bengal | Maithon, Panchet, Tilaiya |
| Odisha | Rengali |
| North-east | Dikhu, Doyang, Gomuti, Kopili, Khandong, Kyrdemkulai, Serlui, Ranganadi |
| Gujarat | Ukai, Kadana |
| Maharashtra | Bhivpuri, Khopoli, Bhira, Purna, Vaitarna, Paithan |
| Andhra Pradesh, Telangana | Lower Sileru, Upper Sileru, Nizam Sagar |
| Karnataka | Tungabhadra, Mahatma Gandhi (Jog), Bhadra, Shimsha, Krishnaraja Sagar, Munirabad, Linganamakki |
| Keralam | Sabarigiri, Kuttiady, Sholayar, Sengulam, Pallivasal, Kallada, Neriamangalam, Parambikulam-Aliyar, Poringal, Lower Periyar |
| Tamil Nadu | Pykara, Mettur, Kodayar, Aliyar, Sarkarpathy, Moyar, Suruliyar, Papanasam, Kundah |
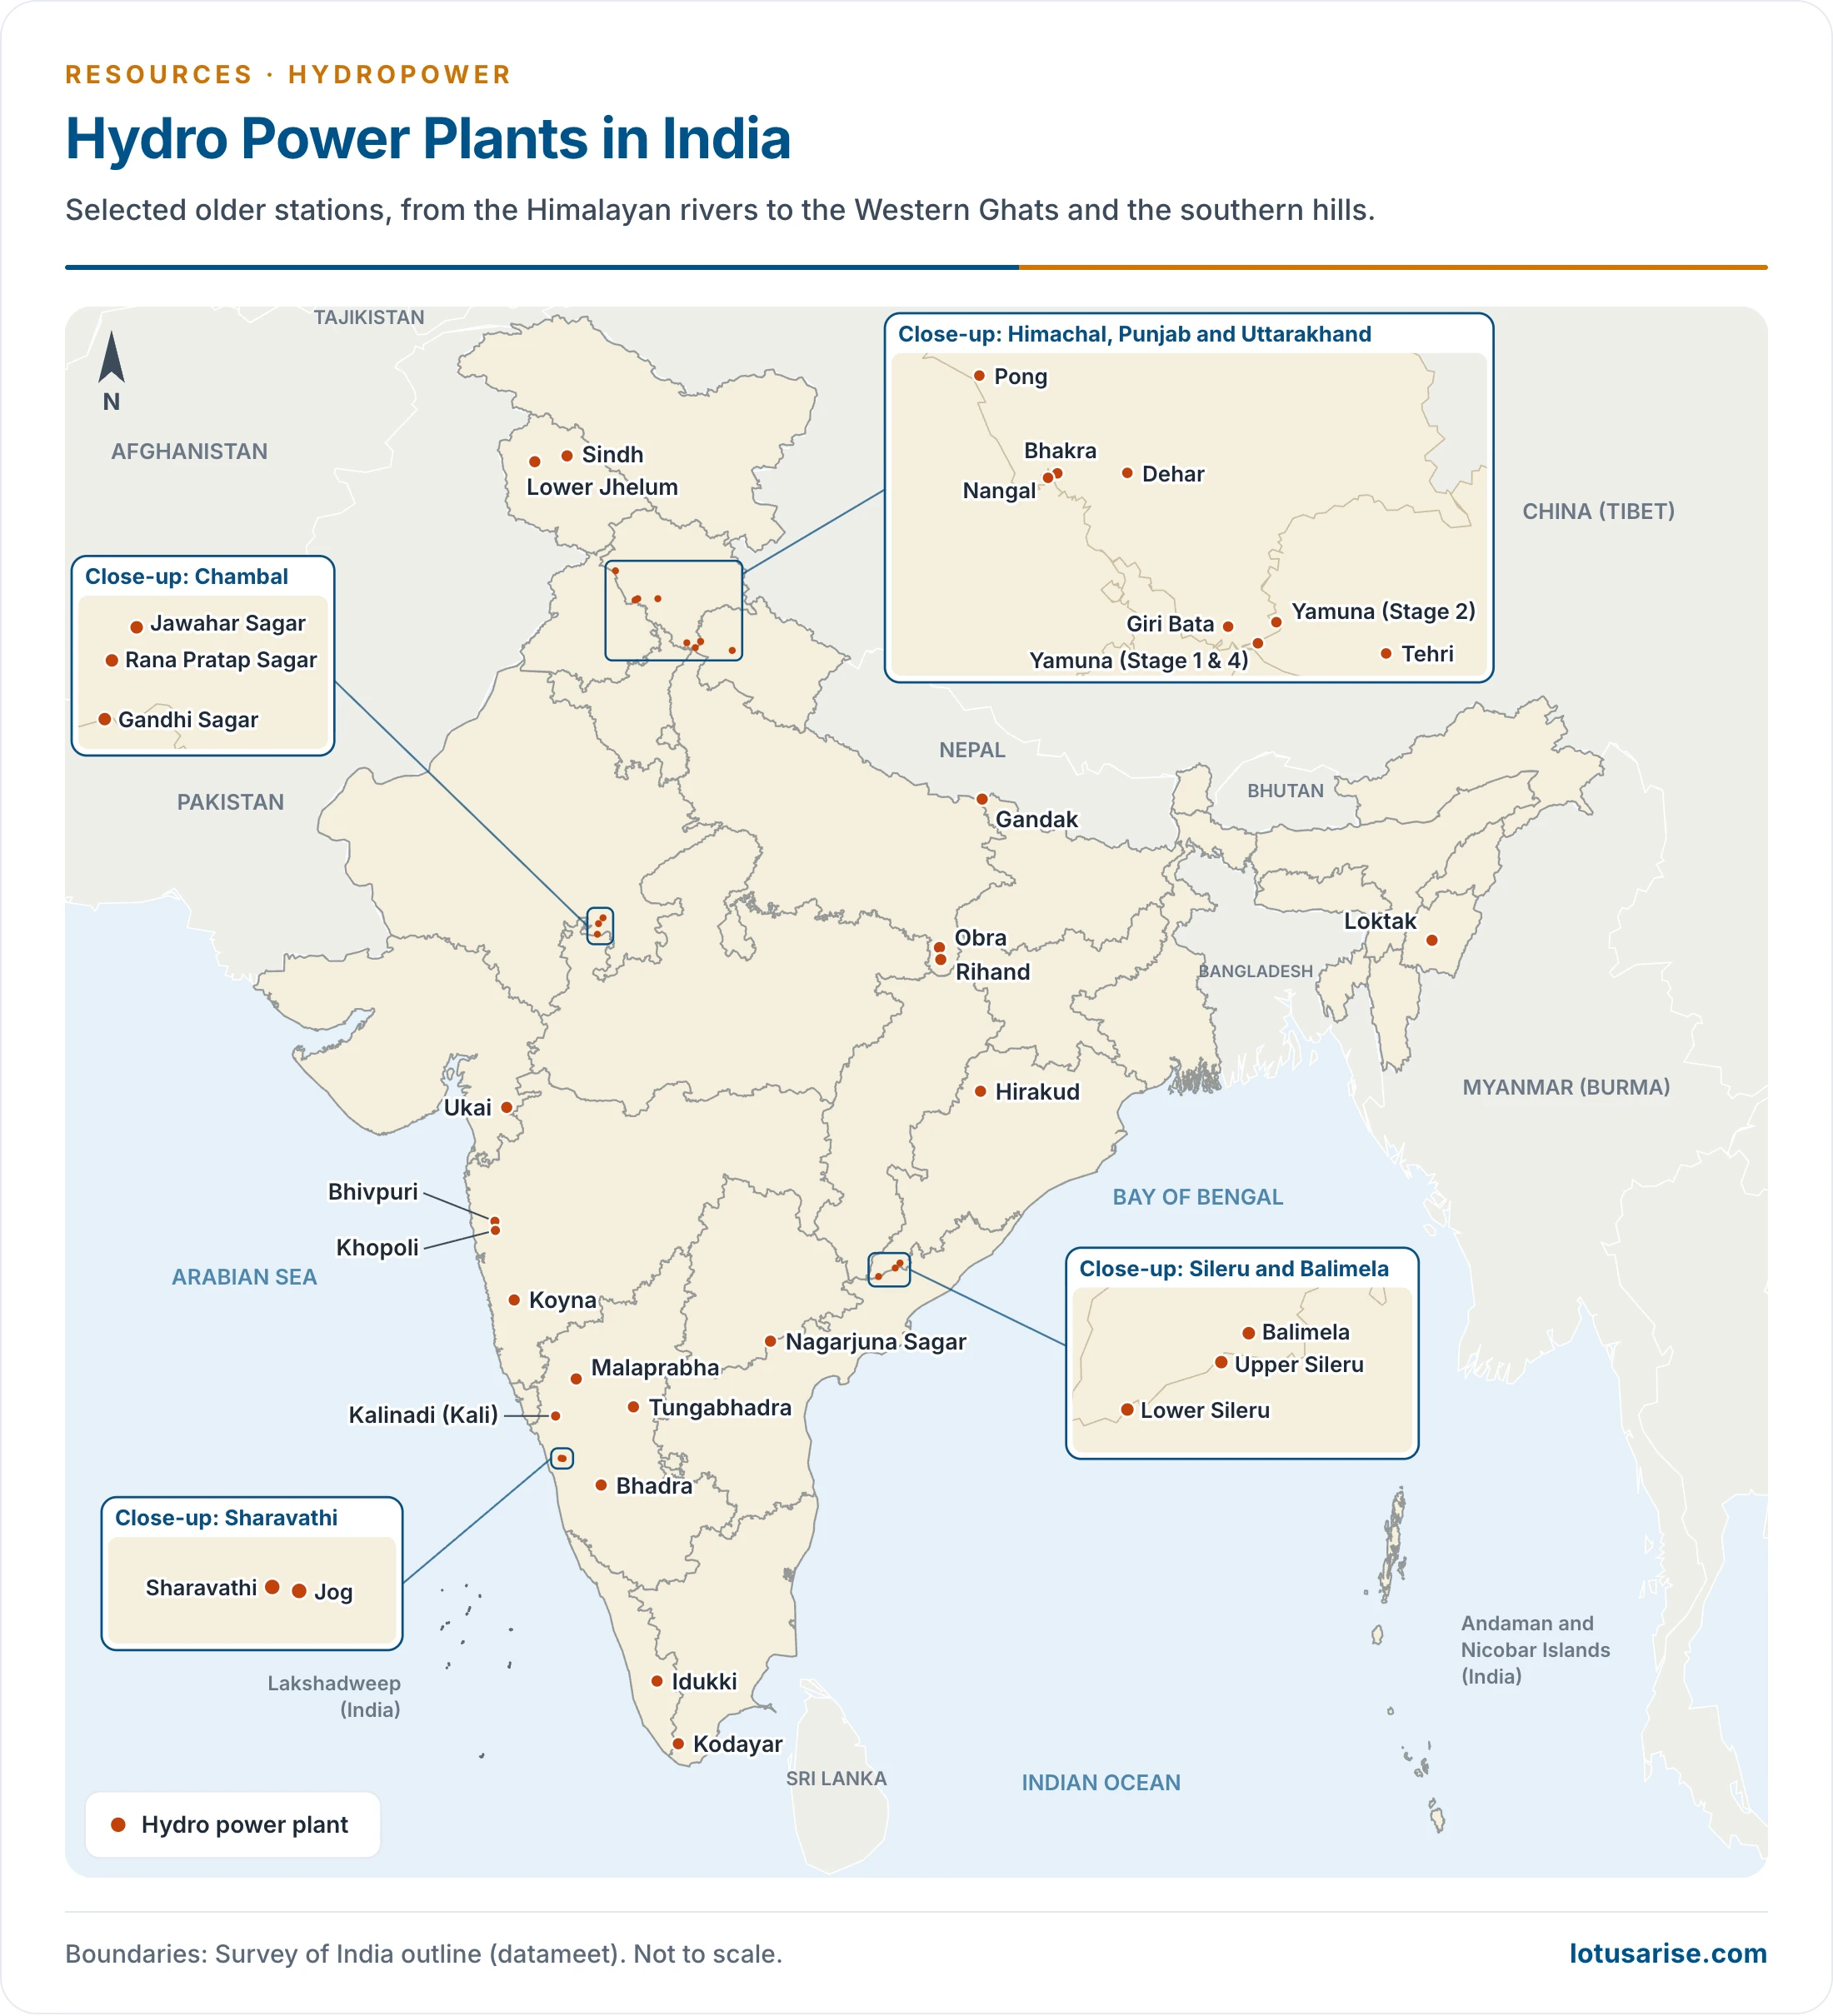
- This map shows older stations. It leaves out newer ones such as Nathpa Jhakri and Subansiri Lower.
Facts About Hydroelectric Power Plants
- Koyna (1,960 MW), on a Krishna tributary about 240 km from Mumbai, has long been named India’s largest completed plant.
- The Tehri complex now totals 2,400 MW, with Tehri, Koteshwar and the 1,000 MW Tehri pumped storage plant, fully commissioned on 12 April 2026.
- The first station: Sidrapong (1897) was India’s first; Shivanasamudra (1902) was the first large one.
- Tehri: at 260.5 m, Tehri is India’s tallest dam, and among its highest hydropower projects.
- THDC India owns it. NTPC bought a 74.496% stake from the Government under an agreement of March 2020, following approval in 2019.
- Srisailam has 1,670 MW, across a 900 MW left-bank and a 770 MW right-bank station. It is often placed second or third nationally.
- Nathpa Jhakri (1,500 MW), with a 27.4 km headrace tunnel, is an underground station and among the largest of its kind.
- Sardar Sarovar is often called the world’s second-largest concrete dam by volume, after Grand Coulee in the USA.
- Tata Hydro-electric grid: Khopoli, Bhivpuri and Bhira near Lonavala feed Mumbai and its surroundings.
- Upper Ganga Canal: its 12 falls between Haridwar and Meerut drive small stations such as Bahadurabad, Mohammadpur, Nirgajni, Chitaura, Salawa, Bhola, Palra and Sumera.
- Hill States: hydro has long dominated supply in Himachal Pradesh, Meghalaya, Sikkim, Uttarakhand and Nagaland, and it counts heavily in Keralam, Jammu and Kashmir, Mizoram and Odisha.
Multipurpose River Valley Projects
- A multipurpose project serves several ends at once: flood control, irrigation, power, navigation, fishing and tourism. Such projects have marked India’s planned development since 1951.
| Project | River | States | Main works | Power and benefits |
|---|---|---|---|---|
| Bhakra Nangal | Satluj | Himachal Pradesh, Punjab, Haryana, Rajasthan | Bhakra Dam (226 m), Gobind Sagar; Nangal Dam; 64.4 km Nangal Hydel Channel | Bhakra, Ganguwal, Kotla stations; about 15 lakh ha irrigated |
| Damodar Valley | Damodar | Jharkhand, West Bengal | Tilaiya, Konar, Maithon, Panchet | Power, flood control, irrigation |
| Hirakud | Mahanadi | Odisha | 61 m high, 4,801 m long, near Sambalpur | Power for a mineral belt; irrigation |
| Kosi | Kosi | Bihar, Nepal | Barrage at Hanumannagar in Nepal (agreement 1954, revised 1961), embankments, canals | 20 MW, shared equally; flood control |
| Rihand | Rihand (Son) | Uttar Pradesh | Dam near Pipri, Govind Ballabh Pant Sagar; Obra dam | Power for Son valley coal, mineral and industrial belts |
| Chambal | Chambal | Madhya Pradesh, Rajasthan | Gandhi Sagar, Rana Pratap Sagar, Jawahar Sagar, Kota Barrage | Power; irrigation |
| Tungabhadra | Tungabhadra (Krishna) | Karnataka, Andhra Pradesh | 2,441 m long, 50 m high dam at Mallapur | 126 MW; three main canals |
| Gandak | Gandak | Bihar, Uttar Pradesh, Nepal | Barrage at Valmikinagar (1959 agreement) | 15 MW station gifted to Nepal; canals |
| Narmada Valley | Narmada | Madhya Pradesh, Gujarat, Maharashtra, Rajasthan | 30 major, 135 medium, 3,000 minor dams planned; Sardar Sarovar, Indira Sagar, Bargi | Sardar Sarovar: 1,450 MW |
| Nagarjuna Sagar | Krishna | Telangana, Andhra Pradesh | 124.7 m dam; Jawahar and Lal Bahadur canals | Power; irrigation |
| Tehri | Bhagirathi | Uttarakhand | 260.5 m rock-fill dam at the Bhilangana confluence | 2,400 MW complex |
| Beas | Beas | Punjab, Haryana, Rajasthan, Himachal Pradesh | Pandoh diversion to Dehar; Pong Dam (116 m) | 1,020 MW; perennial irrigation |
- Others include the Mahi, Mayurakshi, Ramganga and Machkund projects. The major dams are mapped State by State.
- Narmada debate:
- Critics warned of waterlogging, forest loss and displacement. An official count of 1993 put submergence at 245 villages and 38,044 families in three States.
- Supporters point to irrigation for 18 lakh ha in Gujarat and water for its dry Saurashtra and Kachchh.
- Sharing: water goes 65.18% to Madhya Pradesh, 32.14% to Gujarat, 1.79% to Rajasthan and 0.89% to Maharashtra. Power goes 57% to Madhya Pradesh, 27% to Maharashtra and 16% to Gujarat.
- Height: raising from 121.92 m to 138.68 m was permitted in June 2014.
- Tehri debate: conceived in 1949 and begun in 1978, it faced long protests on seismic and safety grounds. It submerged old Tehri town and displaced its people.
Previous Year Questions
2026Construction of large dams poses serious challenges. Describe the threats and solutions associated with it.2013Map item: Rihand Dam2003Explain the concept of Command Area development in respect of Multi-Purpose projects of India.1994Explain the salient features of Sardar Sarovar Project and elucidate the controversy related to its implementation.





Thank you team for such a nice content of geography optional. I found some of the topics are yet to be uploaded and the same status I had observed 3-4 months back. So kindly tell me by when it will be uploaded or we have to cover it from some other sources.
Please make your own notes.