

- Wind energy is the kinetic energy of moving air. Turbines change it into mechanical power, and a generator changes that into electricity.
- It is an important renewable source in India, resting on monsoon and coastal winds, the western drylands and passes through the Western Ghats.
- As on 30 September 2026, installed wind capacity was 59,201.07 MW, about 10.6% of the national capacity of 5,58,896.39 MW (CEA). All of it is onshore.
Wind Energy
- Many of the largest operational onshore wind farms lie in the USA, India and China.
- An older claim gave Germany, USA, Denmark, Spain and India 80% of world capacity. Today China leads, and India holds 4th place at the end of 2025 (GWEC).
- Early use: sailing ships and windmills used wind long before electricity. Power from wind needs only an initial outlay, since no fuel is bought once a turbine runs, for about 20 years.
How It Works
- Conversion devices such as wind turbines have a few sails, vanes or blades radiating from a central axis.
- Wind against the blades rotates them about the axis, and this rotation does useful work.
- Connecting the turbine to an electric generator gives electricity.
- Efficiency: a turbine compares well with a heat engine, since no heat is wasted in burning fuel, though physics caps the share of wind energy that any rotor can capture at about 59% (the Betz limit).
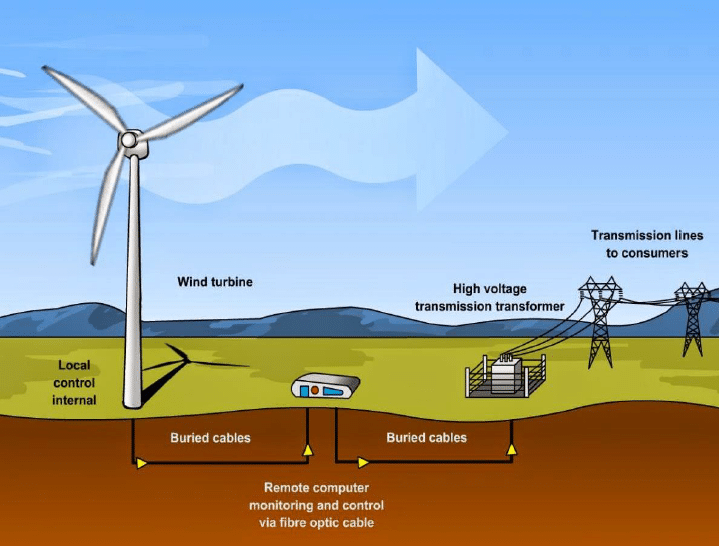
Wind Farm or Park
- A wind farm, also called a wind park, wind power station or wind power plant, is a group of turbines at one location producing electricity.
- Farms range from a few turbines to several hundred over a wide area.
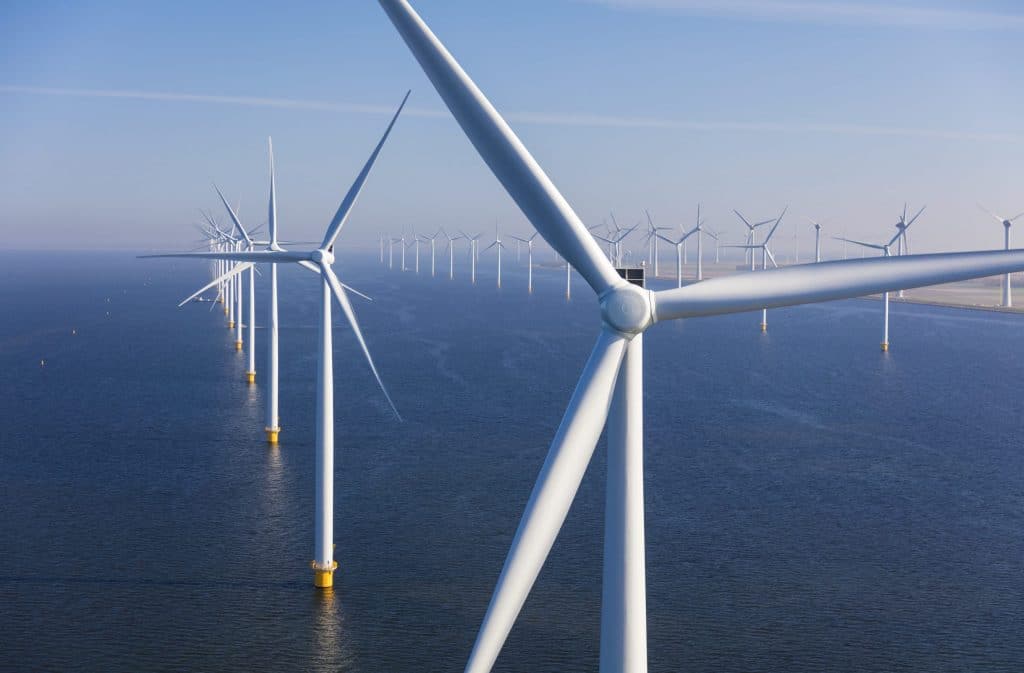
Types of Wind Farms
- Onshore: turbines located on land.
- Offshore: turbines located out at sea or in fresh water.
- Fixed-foundation turbines stand in shallow water, up to roughly 55–70 m deep.
- Floating turbines are anchored to the seabed in deeper water. Floating farms are still in their infancy.
- Cables buried in the ocean floor carry the power ashore.
- Distance and depth: older accounts say offshore farms must be “at least 200 nautical miles from the shore and 50 feet deep”. There is no such rule. 200 nautical miles marks the outer limit of the EEZ, and many farms stand far nearer the coast.
| Feature | Onshore | Offshore |
|---|---|---|
| Cost | Lower | Much higher |
| Wind | Variable, blocked by relief | Stronger and steadier |
| Turbines | Limited by road transport | Larger and taller |
| Local objection | Landscape and noise | Property values and tourism near the coast |
| Status in India | 59,201.07 MW | None commissioned |
Advantages of Offshore Wind
- Size: windmills can be built larger and taller than on land, so they collect more energy.
- Less intrusion: being far out at sea, they trouble neighbours much less, which allows larger farms per square mile.
- Stronger wind: speed and force are much higher at sea, so more energy is generated at a time.
- Clear flow: there are no hills or buildings to block the wind.
Disadvantages of Offshore Wind
- Cost: this is the biggest drawback. Offshore farms are expensive to build and maintain. Their hard-to-reach sites are exposed to very high winds in storms and hurricanes, and repairs are dear.
- Ecology: the effect on marine life and birds is not yet fully understood.
- Coastal objections: farms closer to the shore, generally within 26 miles, can be unpopular, as they may affect property values and tourism.
Advantages of Onshore Wind
- Cost: relatively cheap, which allows large farms.
- Short lines: the shorter distance to the consumer means less voltage drop in the cables.
- Quick to build: a turbine goes up in months. Older accounts set this against a nuclear station that can take over twenty years.
Disadvantages of Onshore Wind
- Landscape: many people regard turbines as an eyesore.
- Uneven output: they do not produce energy all year round, because of poor wind speeds or blockage by buildings or hills.
- Noise: turbine sound has been likened to a lawnmower, a source of noise pollution for neighbours. At the usual 300 m from a house it measures nearer 43 decibels, close to a refrigerator, though people living nearby can still find it penetrating.
Working of Wind Turbines
- Turbines turn the wind’s kinetic energy into mechanical energy. This can do specific tasks, such as grinding grain or pumping water, or a generator can make electricity from it.
- Design: most turbines have three aerodynamic blades, propeller-like, around a rotor connected to the main shaft.
- Towers lift the rotor into faster and less turbulent wind, at 100 feet (30 m) or more above the ground. Modern assessments now use hub heights of 100–150 m.
- Three main variables decide output:
- Wind speed: stronger winds give more energy, and available power rises with the cube of the speed. Turbines generate at 4–25 metres per second.
- Blade radius: doubling the radius can give four times the power, since swept area rises with its square.
- Air density: heavier air exerts more lift on a rotor. Density depends on altitude, temperature and pressure.
- High sites have thin air and are less productive. The dense air near sea level drives rotors more effectively.
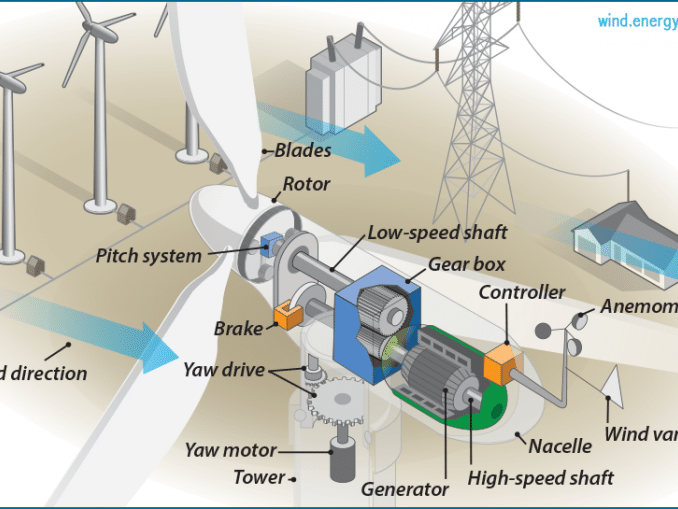
- The edges of this figure cut off three labels: wind direction, anemometer and wind vane.
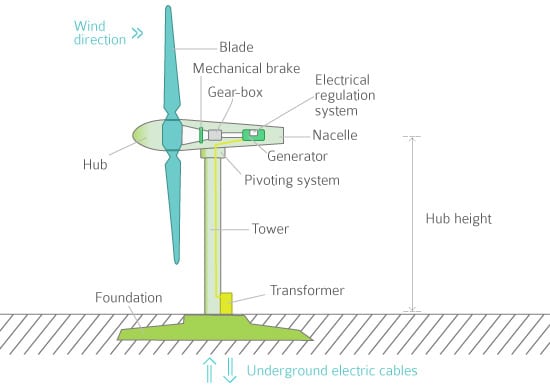
Wind Energy in India
Geography of the Resource
- India’s best sites combine strong seasonal winds, open land and exposure to the coast.
- Passes: the Aralvaimozhi gap behind Muppandal and the Palghat gap funnel the south-west monsoon winds in Tamil Nadu.
- Western margin: the Kachchh and Saurashtra coasts and the Thar drylands around Jaisalmer.
- Plateau edges: Western Ghats crests in Maharashtra and Karnataka, and the Deccan uplands of Andhra Pradesh.
- Season: output peaks in the south-west monsoon, complementing solar, which dims under monsoon cloud.
- Muppandal–Perungudi: this stretch near Kanyakumari is among the densest concentrations of wind capacity at one location, and the national wind institute sits at Chennai.
- State pattern of potential: at 80 m, Gujarat came first, followed by the southern coastal States of Andhra Pradesh, Tamil Nadu and Karnataka.
- Early mapping: from 1985, a national programme monitored wind to find sites and build a wind atlas.
- The older power-density map at 50 m covered 10 States. The best band, 350–450 W per sq m, lay in small pockets in Gujarat, Tamil Nadu, Karnataka and Andhra Pradesh.
- More than 95% of commercially exploitable resources lie in seven States: Andhra Pradesh, Gujarat, Karnataka, Madhya Pradesh, Maharashtra, Rajasthan and Tamil Nadu.
| Assessment | Height | Potential |
|---|---|---|
| Older national estimate | 50 m | 49,130 MW (2% of land) |
| Centre for Wind Energy Technology | 80 m | 1,02,778 MW (2% of land) |
| Lawrence Berkeley National Laboratory, USA | 80 m and 120 m | 2 million and 3.1 million MW |
| National Institute of Wind Energy (NIWE) | 100 m | 302 GW |
| NIWE | 120 m | 695.50 GW |
| NIWE, latest gross estimate | 150 m | 1,163.9 GW |
- Potential rises with height and better turbines, so these figures are not contradictions.
Status of Wind Energy
- Industry: the sector is led by an indigenous wind power industry and has shown steady progress, with a strong ecosystem and project skills. Its manufacturing base was about 10,000 MW per annum in 2021.
- Capacity over time:
| Date | Installed wind | Note |
|---|---|---|
| December 2013 | 20,149.5 MW | About 67% of renewable capacity; 5th in the world |
| 31 March 2020 | 37.7 GW | See the State chart |
| 31 March 2021 | 39.25 GW | 4th in the world; 60.149 billion units in 2020-21 |
| 30 June 2026 | 57,443 MW | Official figure |
| 30 September 2026 | 59,201.07 MW | Latest |
- Growth rates: between 2010 and 2020, the compound annual rate was 11.39% for generation and 8.78% for capacity. In 2002-03 to 2013-14 it had been about 26% for capacity.
- Recent additions and generation:
- 2023-24: 3,253 MW added; 83 billion units.
- 2024-25: 4,151 MW added; 83 billion units.
- 2025-26: a record 6,057 MW added; 106 billion units.
- Plan record: additions beat targets in the 10th Plan (5,427 MW against 1,500 MW) and the 11th Plan (10,260 MW against 9,000 MW). Growth then slowed in 2012-14 when subsidies were withdrawn, and a Wind Mission was proposed.
- Share and rank in 2012-13: India then held about 7% of world capacity, and wind made up about two-thirds of its renewable capacity. Solar has since overtaken wind at home, while wind’s own share of national capacity has stayed near 10–11%.
- Offshore target: the Ministry of New and Renewable Energy (MNRE) set 5 GW by 2022 and 30 GW by 2030. No offshore project had been commissioned by 2026.
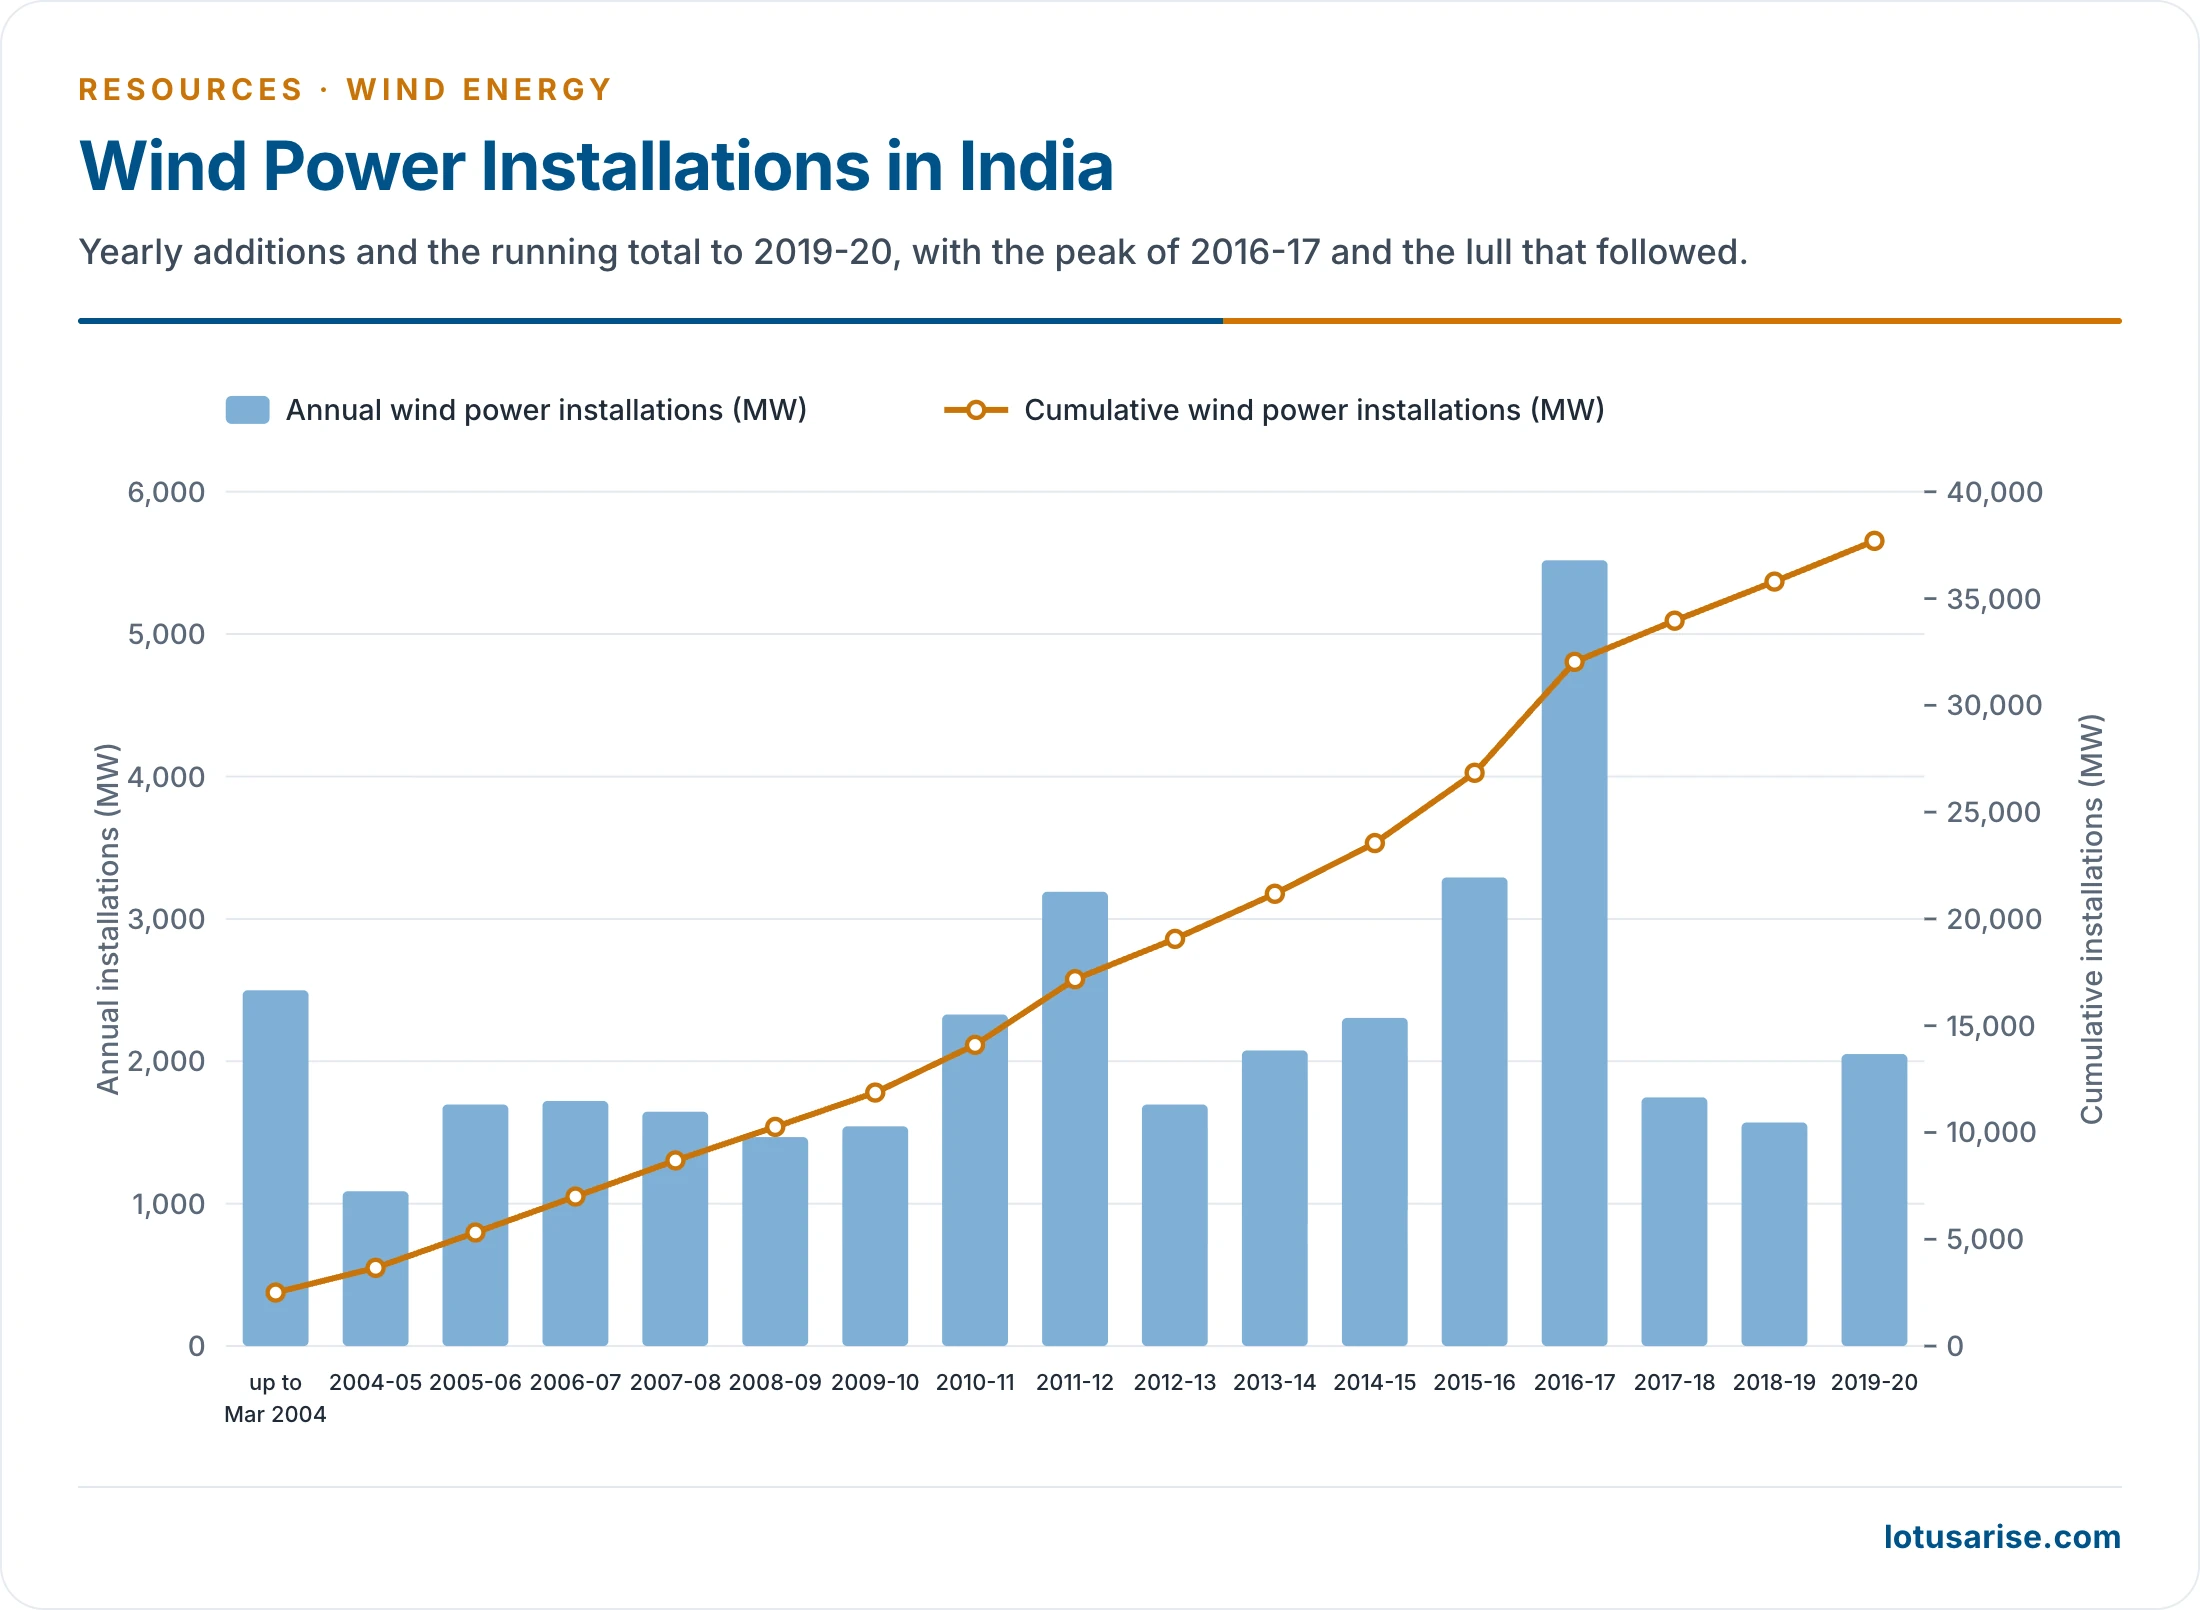
- This chart stops at 2019-20. It shows the 2016-17 peak and the lull that followed, and later years have brought record additions.
Offshore Potential
- The coastline, long given as 7,516.6 km and often rounded to 7,600 km, was re-assessed in 2025 to 11,098.81 km. Policy documents use the older figure.
- Figure in use: about 70 GW of technical potential off Gujarat and Tamil Nadu (GWEC 2026).
- The 127 GW figure: a much-repeated 127 GW, or 1,27,000 MW, comes from a study of Tamil Nadu’s wind potential at 80 m. It does not measure the offshore resource of the whole country.
- Cost: in 2014, offshore cost ₹12–18 crore per MW against about ₹6 crore onshore.
Policies Related to Wind Energy
- National Wind-Solar Hybrid Policy, 2018: a framework for large grid-connected wind-solar photovoltaic hybrid systems, for optimal and efficient use of wind and solar resources, transmission infrastructure and land.
- National Repowering and Life Extension Policy, 2023: replacing or extending old, low-output turbines on the best early sites.
- Renewable purchase and consumption obligations, Green Energy Corridors, 100% foreign direct investment through the automatic route, and an Approved List of Models and Manufacturers.
- Inter-State transmission waiver: full for projects commissioned by 30 June 2025, then graded.
National Offshore Wind Energy Policy, 2015
- Draft (May 2013): proposed a steering committee and a national offshore authority.
- Notified in October 2015, to develop offshore wind in the Indian Exclusive Economic Zone (EEZ) along the 7,600 km coastline. Its objectives are to:
- Explore and promote offshore farms in the EEZ, including under Public Private Partnership.
- Reduce carbon emissions by large-scale generation from offshore wind.
- Promote investment in energy infrastructure and achieve energy security.
- Promote spatial planning and management of offshore renewable resources through suitable incentives.
- Encourage indigenisation of the technology.
- Promote research and development.
- Create a skilled workforce and employment.
- Develop Project EPC (Engineering, Procurement and Construction) and Operation and Maintenance (O&M) in the offshore industry.
- Build and maintain coastal infrastructure and a supply chain for heavy construction, fabrication and O&M work.
- Nodal agency: the National Institute of Wind Energy (NIWE).
- Later steps: Offshore Wind Energy Lease Rules on 19 December 2023, and a Viability Gap Funding scheme of June 2024 (₹7,453 crore) for 1 GW off Gujarat and Tamil Nadu.
Maritime Zones
- Two main maritime areas can host structures such as wind farms:
- Indian territorial waters, generally up to 12 nautical miles (nm) from the baseline.
- Exclusive Economic Zone, beyond 12 nm and up to 200 nm, where international law gives India the right to construct wind farm installations.
Problems in the Wind Energy Sector
- The lull after 2017: India added about 5.5 GW in 2016-17, and only about 2 GW (1,766 MW) in 2017-18.
- Early incentives withdrawn: growth came from generation incentives, accelerated depreciation and tax benefits, which the Government gradually withdrew.
- Price gap: an older comparison set solar at Rs 2.23 per unit and wind at about Rs 4.50, so investors found solar more lucrative.
- Wind’s own auctions then fell to a record Rs 2.43 in December 2017, and rose again to Rs 3.17 by May 2023.
- Policy in transition: the policies were still being reset in those years.
- Auctions: the December 2017 framework brought a tariff ceiling in every auction. Winds are region-specific, which makes a set tariff hard to reach.
- Distribution company risks: curtailment of generation and delayed payments to producers.
- Wildlife: Great Indian Bustard habitat in Rajasthan and Gujarat limits overhead lines, under Supreme Court orders of 19 April 2021 and 21 March 2024.
- Ageing fleets: many of the windiest sites hold small, old machines, which is why repowering matters.
Challenges in Harnessing Offshore Wind Energy
- Data: offshore work needs long data collection first. Germany spent eight years gathering metocean and geological data before its first projects.
- Support infrastructure: this requires heavy investment.
- Higher installation cost: India lacks local substructure makers, installation vessels and trained workers, and offshore turbines need stronger structures and foundations.
- Higher maintenance cost: waves and high winds, especially in storms and hurricanes, damage turbines, and repairs are costlier and harder.
- Lack of support: Europe leads offshore, and its tariffs have come down to about India’s onshore level, after years of incentives. India lacks equal support.
- Who will invest: solar is very cheap, and the onshore wind sector is itself not fully developed.
- Evidence: SECI cancelled offshore tenders of 4.5 GW after poor response, and the Gujarat tender drew no bid by its final date of 31 July 2025.
Way Forward
- Renewable purchase obligation: distribution companies, open access consumers and captive users can buy clean energy as part of their consumption.
- Lower taxes: the GST law exempts electricity sales, but wind generators cannot claim input tax credits on goods and services bought for a project.
- Feed-in tariff (FiT): distribution companies could adopt FiT regulations and make offshore procurement mandatory, tailoring the FiT to each project until it becomes viable.
- Deemed generation: offshore projects need protection from curtailment, since State Load Dispatch Centres (SLDCs) may be unable to absorb large output.
- Sub-sea substations: the Power Grid Corporation of India Ltd could develop underwater evacuation and subsea substations, reducing developers’ risk.
- Repowering: replacing small early machines on the windiest sites adds output with no new land.
- Hybrids and storage: pairing wind with solar and pumped hydro makes the supply firmer, which helps resolve the wider energy crisis.
Wind Power Plants and States
Major Wind Power Plants in India
- This list gives the capacities long quoted for the ten largest. New parks in Kachchh and elsewhere are changing the order.
| Wind power plant | Megawatt (MW) | Location |
|---|---|---|
| Muppandal wind farm | 1,500 | Kanyakumari, Tamil Nadu |
| Jaisalmer Wind Park | 1,064 | Jaisalmer, Rajasthan |
| Brahmanvel wind farm | 528 | Dhule, Maharashtra |
| Dhalgaon wind farm | 278 | Sangli, Maharashtra |
| Vankusawade Wind Park | 259 | Satara, Maharashtra |
| Vaspet | 144 | Vaspet, Maharashtra |
| Tuljapur | 126 | Osmanabad (Dharashiv), Maharashtra |
| Beluguppa Wind Park | 100.8 | Beluguppa, Andhra Pradesh |
| Mamatkheda Wind Park | 100.5 | Mamatkheda, Madhya Pradesh |
| Anantapur Wind Park | 100 | Nimbagallu, Andhra Pradesh |
Top States by Installed Wind Capacity
- The lead has changed. Tamil Nadu long topped the table, but Gujarat now leads.
| State | Older position | 30 June 2026 (MW) | Generation 2025-26 (million units) |
|---|---|---|---|
| Gujarat | Second-largest; wind gave about 19% of its electricity in 2018 | 16,086 | 33,706 |
| Tamil Nadu | Largest; 8,631 MW of 30,447 MW at end-2018, wind about 28% of its electricity | 12,273 | 24,200 |
| Karnataka | Fourth | 8,896 | 18,804 |
| Maharashtra | Third | 6,318 | 8,610 |
| Rajasthan | Fifth; wind about 20% of its electricity | 5,516 | 7,345 |
| Andhra Pradesh | About 11% of capacity in 2020 | 4,461 | 8,902 |
| Madhya Pradesh | About 7% of capacity in 2020 | 3,686 | 4,706 |
- By 30 September 2026: Gujarat 17,043.76 MW, Tamil Nadu 12,335.42 MW, Karnataka 8,973.74 MW, Maharashtra 6,484.81 MW and Rajasthan 5,815.29 MW.
- Earlier output: Tamil Nadu alone gave 59.675 billion units of 119.483 cumulative billion units from 2005-06 to 2011-12, ahead of Maharashtra, Karnataka and Gujarat.
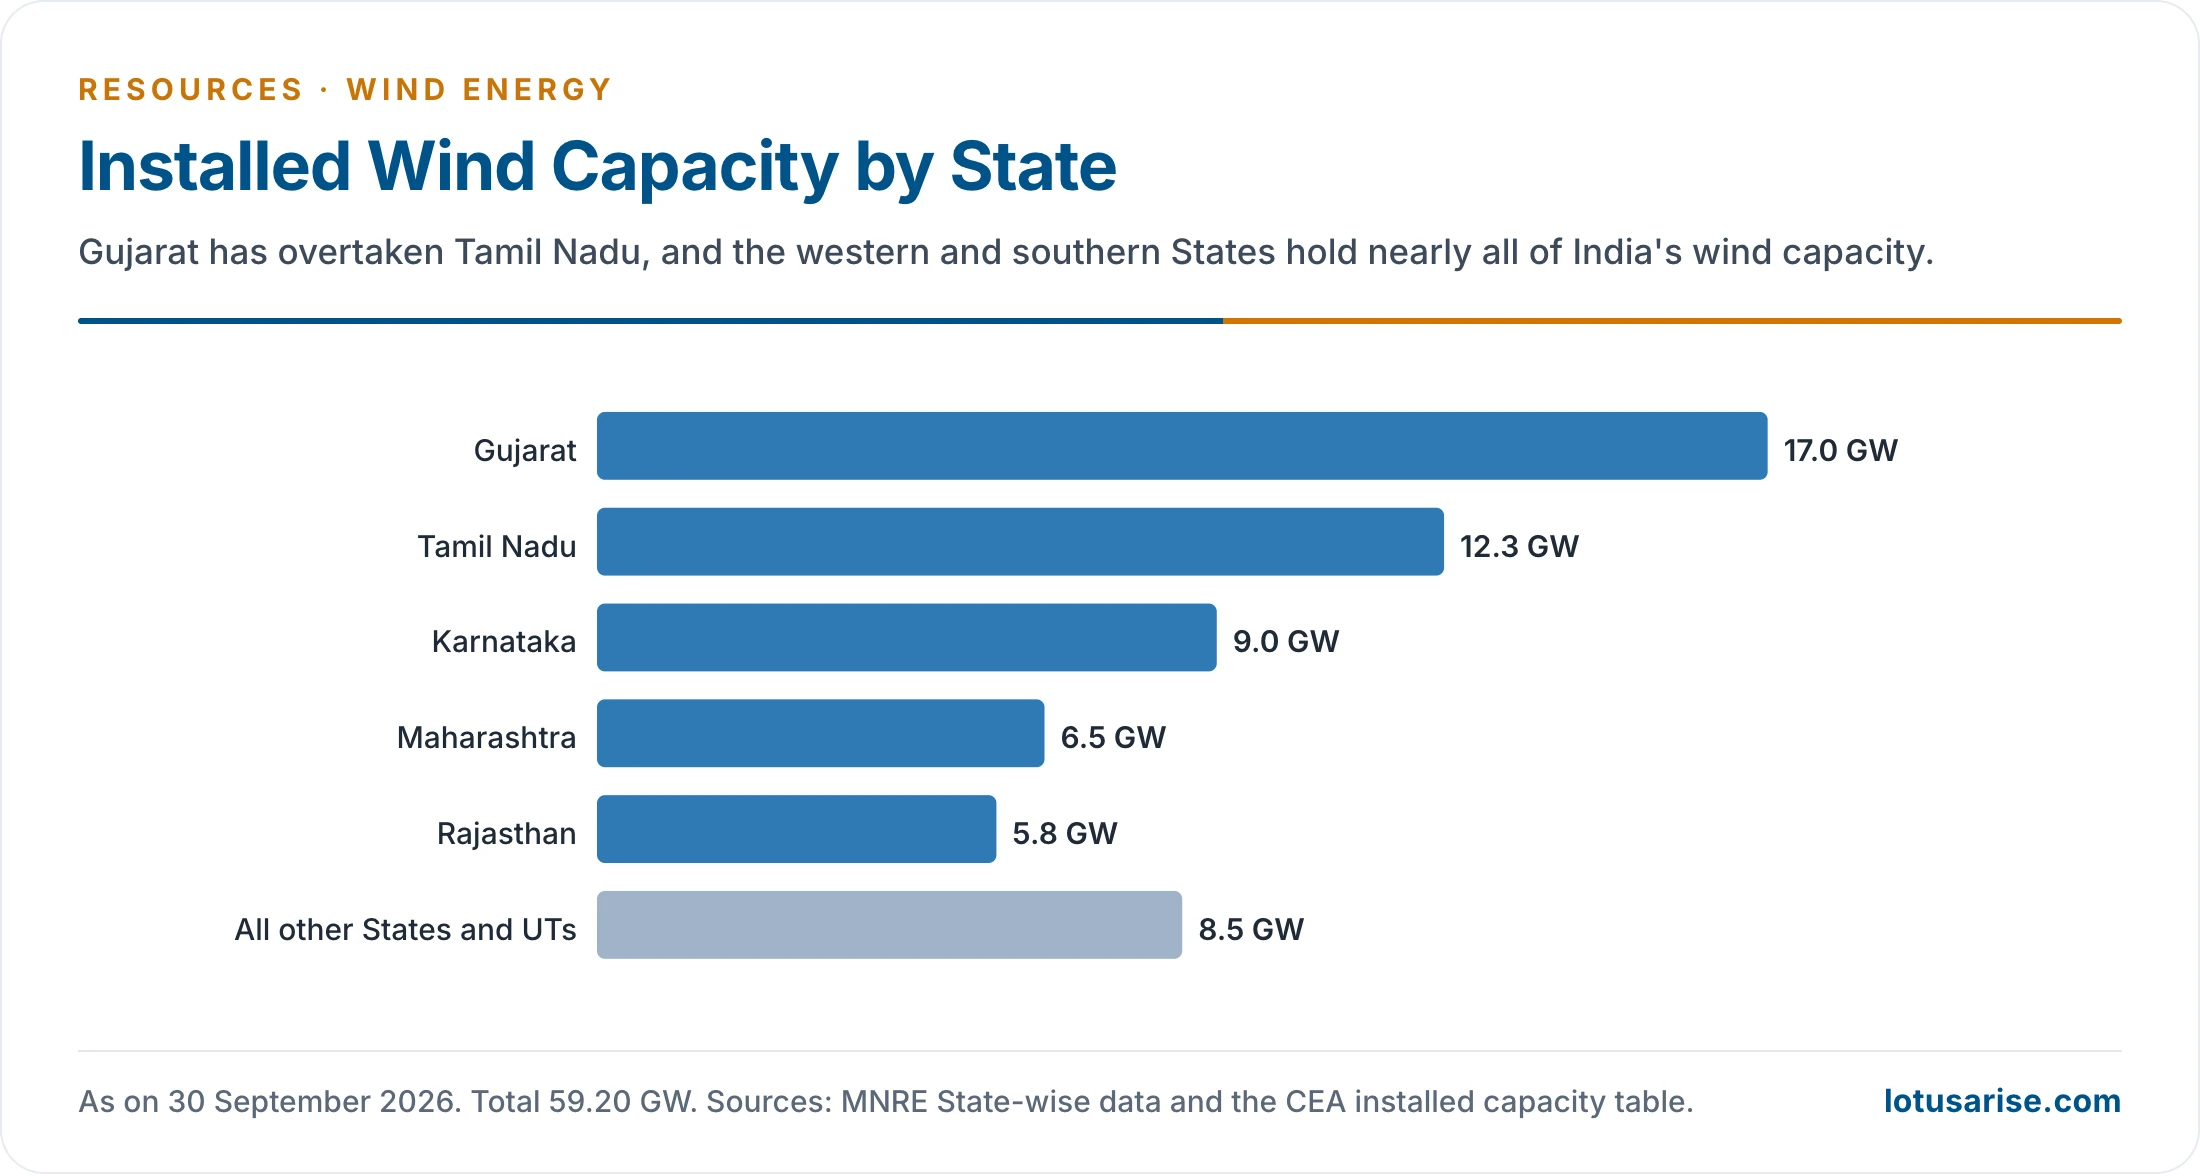
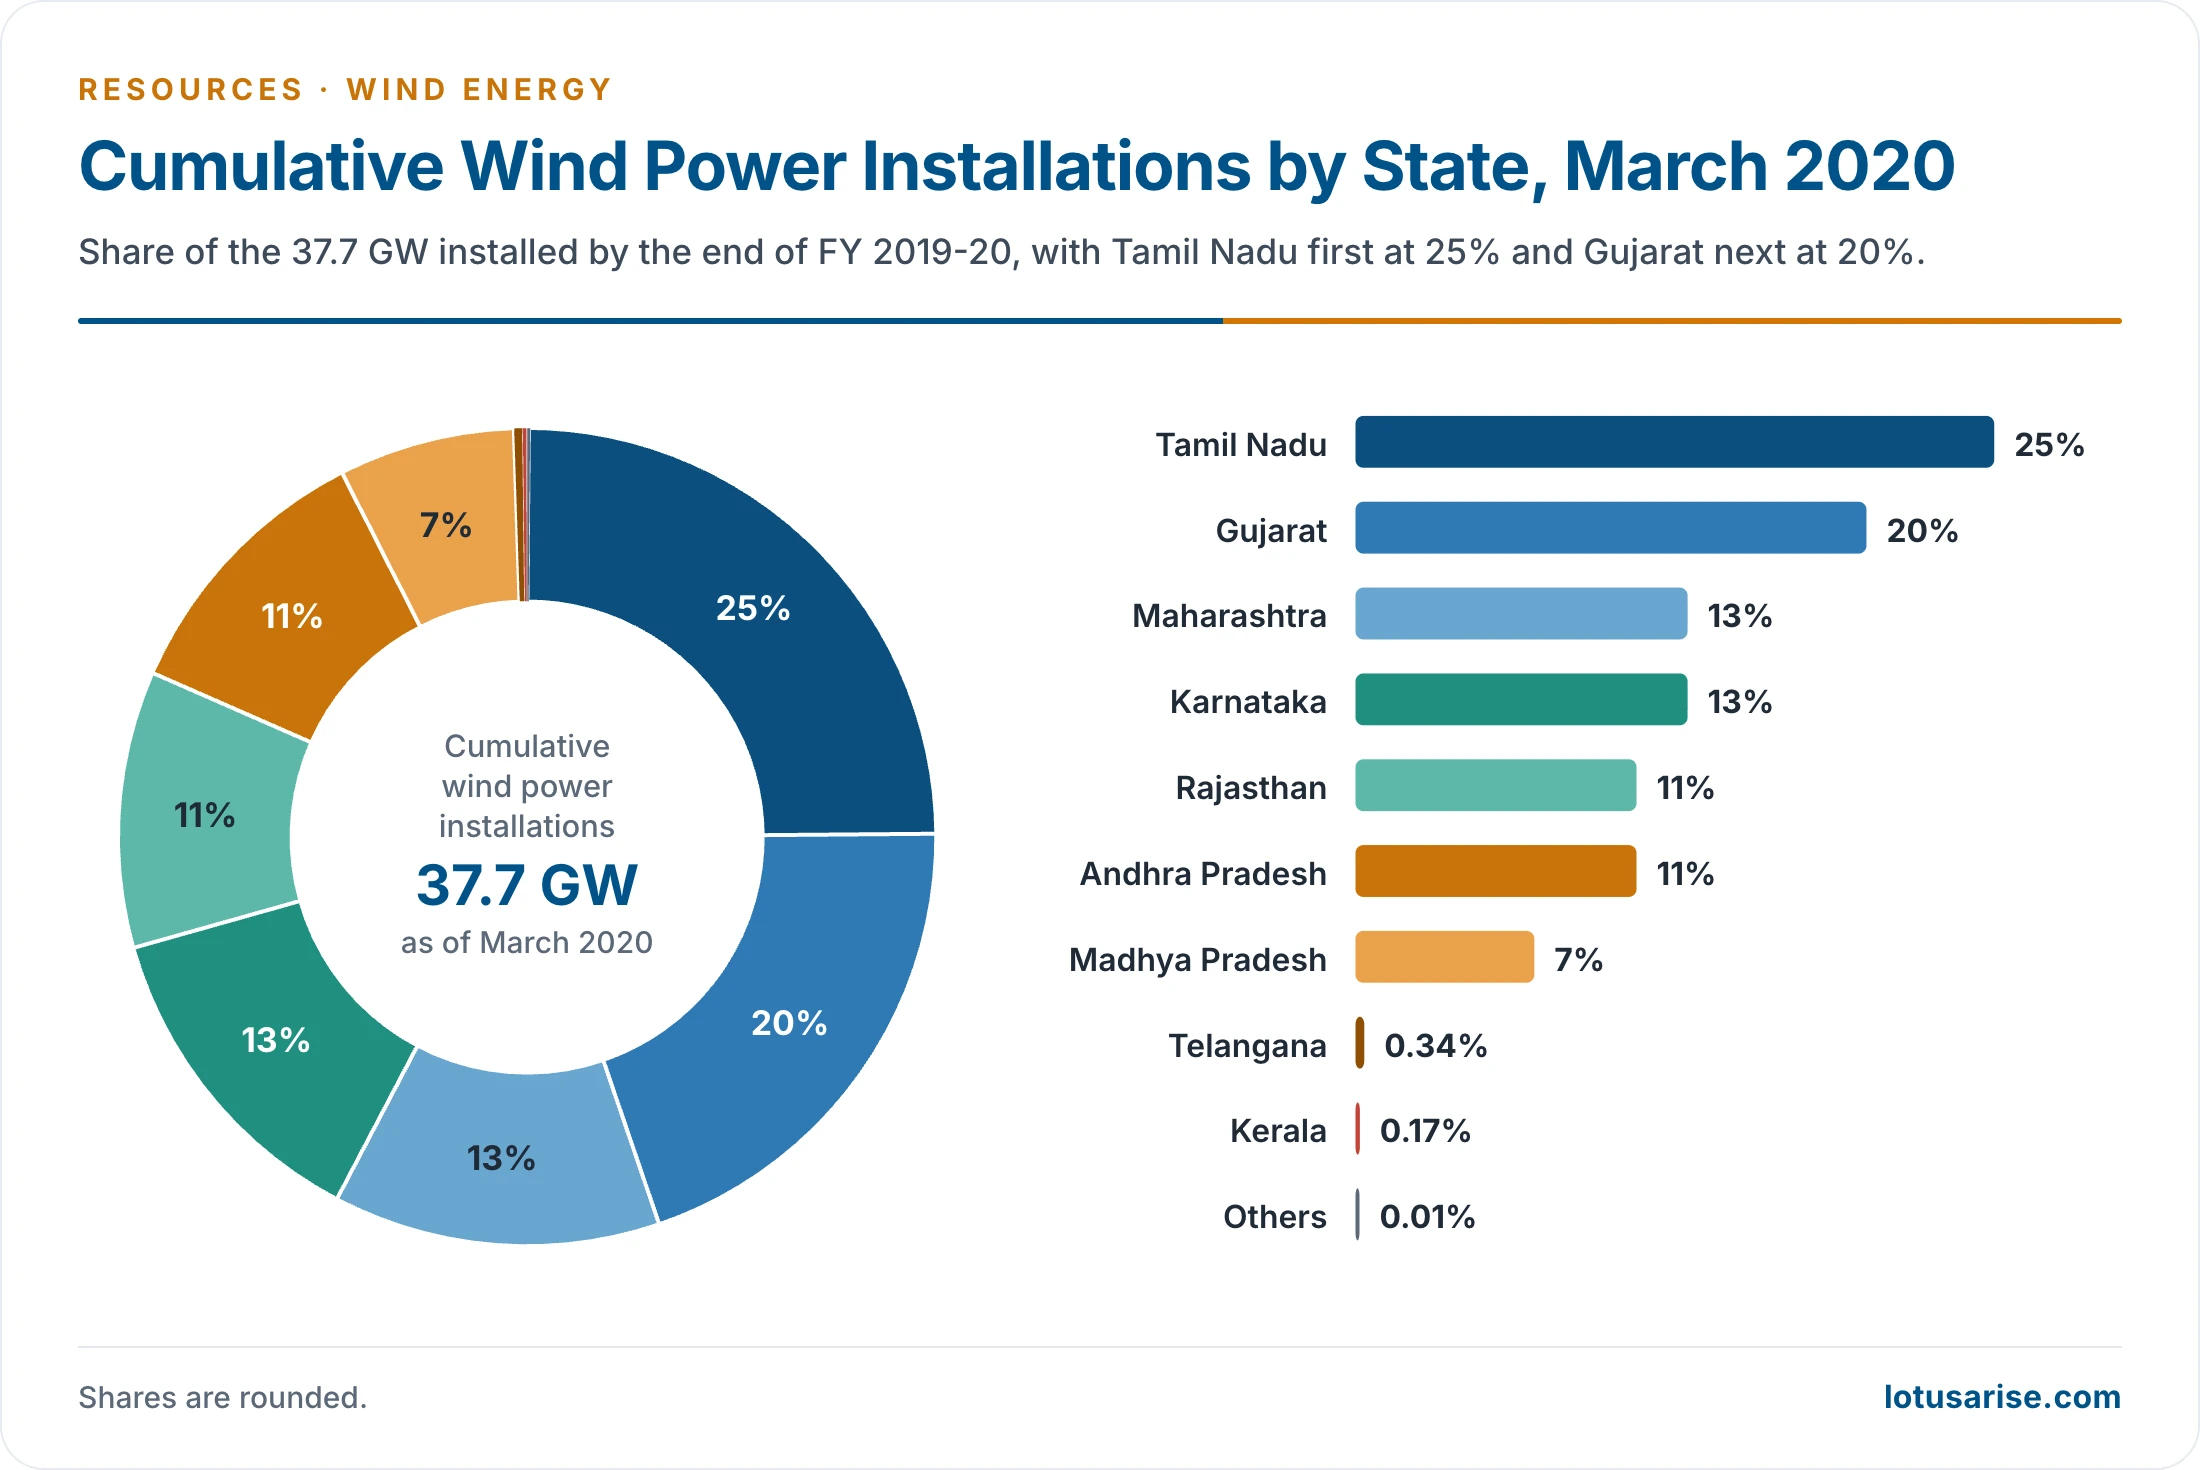
- This chart gives FY 2019-20, ending at 37.7 GW in March 2020, with Tamil Nadu first at 25%. Gujarat has since taken the lead.
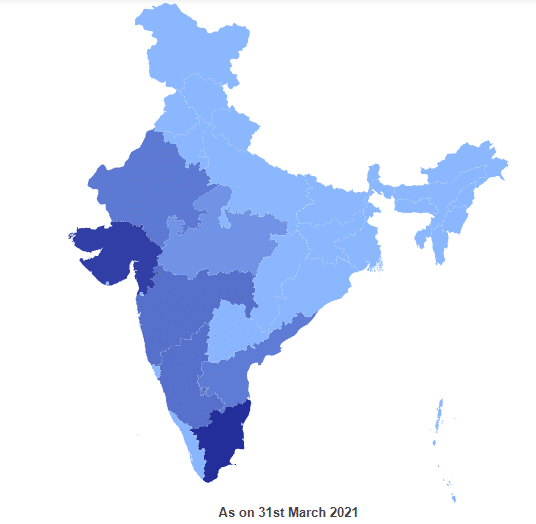
- This map, as on 31 March 2021, has no legend. The darker the State, the greater its capacity, with Tamil Nadu and Gujarat darkest.
Previous Year Questions
2023Discuss the green energy initiatives of India as a signatory nation to the Paris Agreement.2022The peninsular location of India provides scope for harnessing non-conventional energy resources. Discuss with examples.2018Keeping the recent developments in view, how can the energy crisis of India be circumvented by harnessing non-conventional energy resources?2016Give an account of the development of renewable resources of India.2005“Non-conventional energy is the energy of the future in India.” Justify this statement.





THANK YOU SIR ITS REALLY HELPFUL ALL YOUR ARTICLES IS WONDERFUL
ONCE AGAIN THANK YOU SIR FOR THE HELP WHO CAN’T AFFORD COACHING
Really these notes are very helpful.👍
Thank a lot .