

- Energy security is the uninterrupted availability of energy at an affordable price. In the long run this includes supplies that are timely, diversified and environmentally sustainable.
- Energy transition is the structural shift of an energy system from one dominant source to another. Today this means the shift from fossil fuels to low-carbon sources: renewables, nuclear, green hydrogen and electrification, backed by efficiency.
- The two are linked. The fossil system made energy insecure (price shocks, chokepoints, cartels) and unsustainable (emissions). A well-managed transition can address both, but it also creates new dependencies on critical minerals, grids and storage.
- The 2022 European gas crisis and the 2026 Hormuz shock, the two latest episodes of the recurring energy crisis, showed both faces: countries burned more coal for short-term security, yet also sped up renewables and electric vehicles to cut import dependence.
Energy Security

Meaning and the Four As
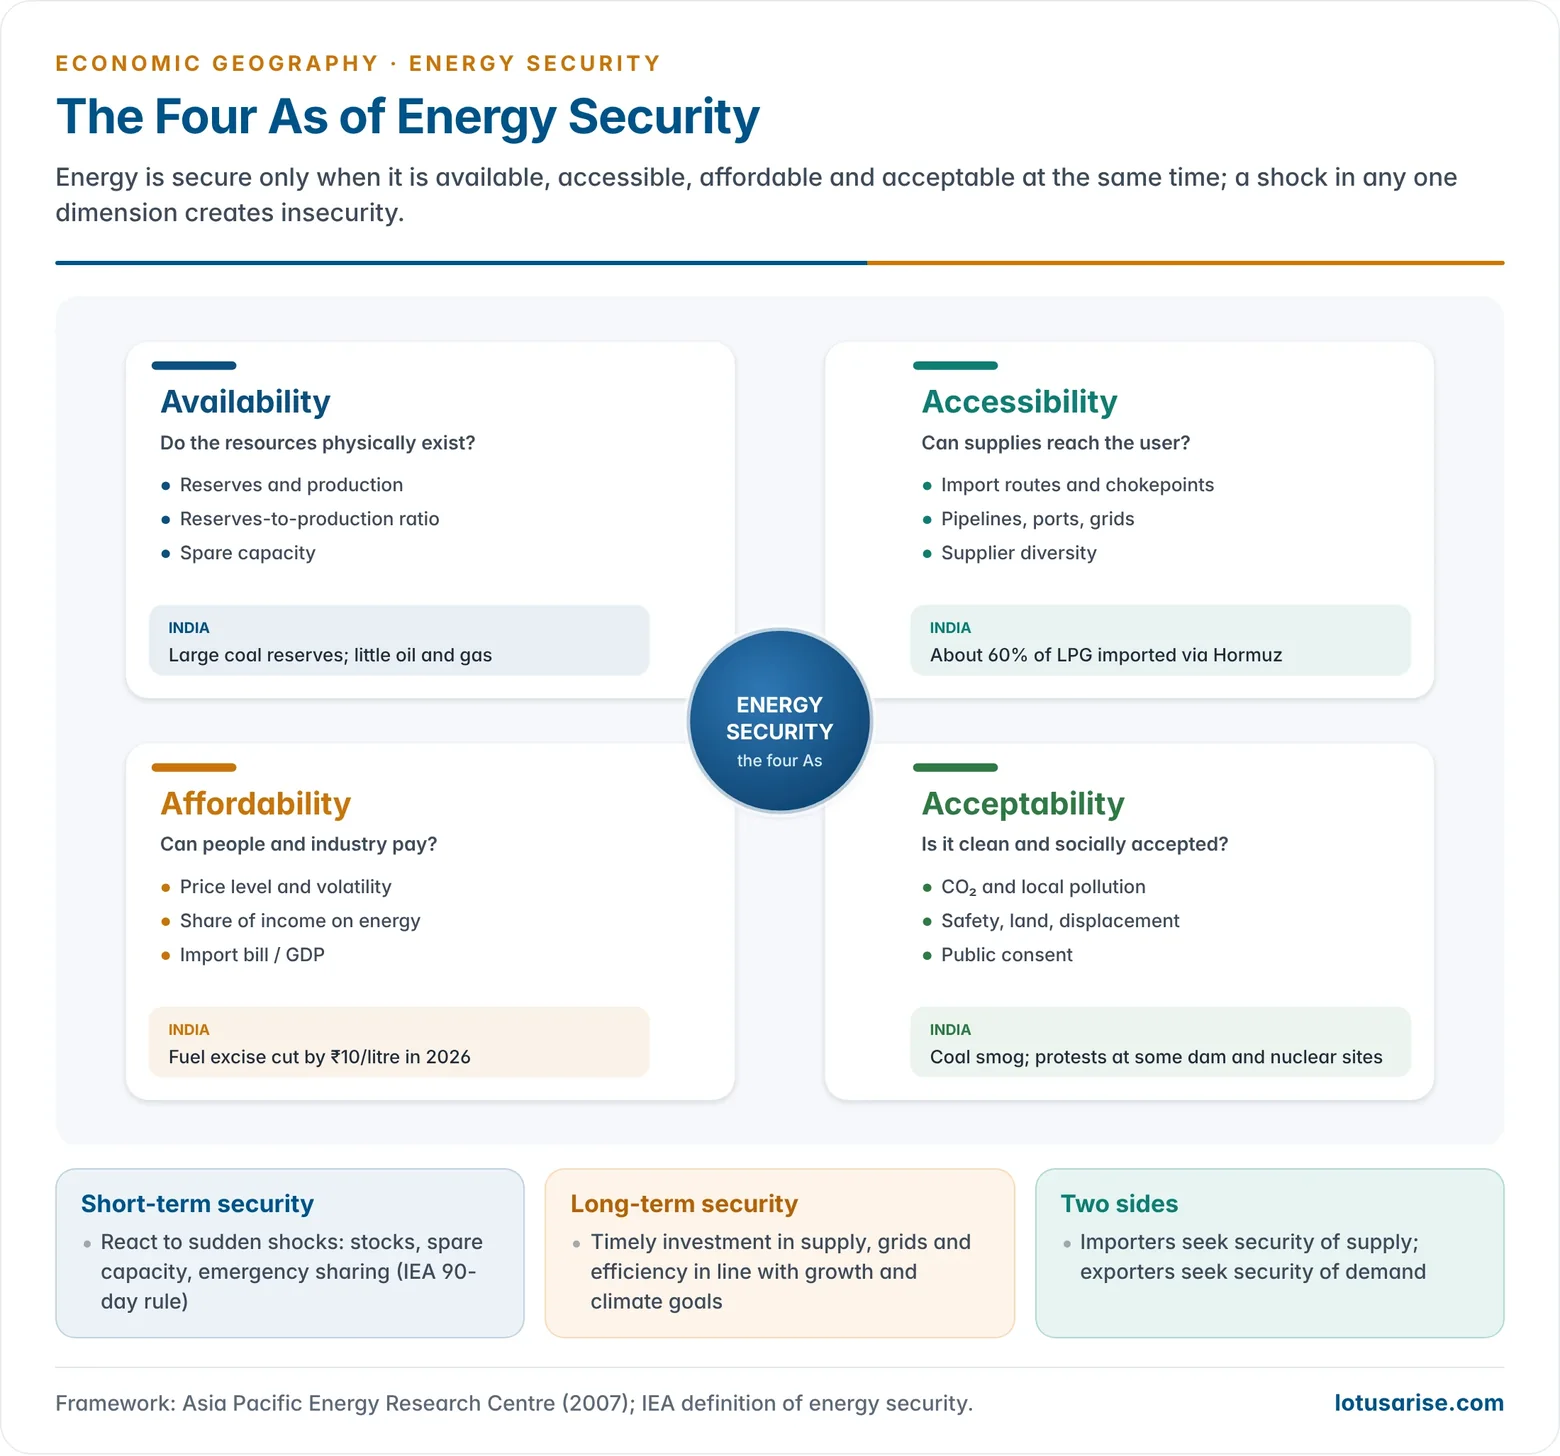
- The International Energy Agency (IEA) defines energy security as the uninterrupted availability of energy sources at an affordable price.
- Short-term security: the ability to react quickly to sudden supply-demand shocks, through stocks, spare capacity and emergency sharing.
- Long-term security: timely investment to supply energy in line with economic growth and environmental needs.
- The four As framework (Asia Pacific Energy Research Centre, 2007) sets out its dimensions:
| Dimension | Meaning | Typical indicators | Indian example |
|---|---|---|---|
| Availability | Physical existence of resources and supply | Reserves, production, reserves-to-production ratio | Coal reserves; limited oil and gas |
| Accessibility | Ability to reach and move supplies | Import routes, chokepoint exposure, infrastructure | 60% of LPG imported via Hormuz |
| Affordability | Prices people and industry can bear | Price level, volatility, share of income on energy | Excise cuts on fuel in 2022 and 2026 |
| Acceptability | Environmental and social acceptance | Emissions, local pollution, safety | Coal pollution; resistance to some nuclear and dam sites |
- Two sides of security:
- For importers it means security of supply.
- For exporters such as Saudi Arabia, Russia and Qatar it means security of demand: stable markets and revenue.
- Common indicators:
- import dependence;
- diversity of fuels and suppliers;
- days of stock cover (IEA members hold 90 days of net imports);
- energy intensity of GDP;
- exposure to chokepoints.
Why Oil Is Central to Energy Security
- Largest single energy source: oil is still the biggest source of primary energy. World consumption reached about 103 million barrels a day in 2025.
- Transport depends on it: about nine-tenths of the energy used in road, air and sea transport still comes from oil products, and transport has few quick substitutes.
- Industry, farming and defence: oil feeds petrochemicals, plastics, fertilisers, asphalt and lubricants, and powers tractors, pumps and armed forces.
- Concentrated and traded: reserves and spare capacity are concentrated in West Asia and OPEC+, and about a fifth of world oil passes through the Strait of Hormuz. Oil is therefore the fuel most exposed to war, embargo and cartel action.
- Price setter: oil prices influence gas contracts, inflation, exchange rates and trade balances, so an oil shock is a macroeconomic shock.
- Strategic tools: this is why countries hold strategic petroleum reserves, buy equity oil abroad, diversify suppliers, and why the IEA was founded in 1974.
Role of Oil in the Clean Energy Transition
- Bridge fuel: while renewables, storage and grids scale up, oil keeps transport and industry running. A disorderly exit could cause shortages and price spikes.
- Feedstock for clean technologies: petrochemicals supply the plastics, resins, fibres and lubricants used in solar panels, wind-turbine blades, battery casings and lightweight EV bodies. Petrochemicals are expected to be the largest driver of future oil demand.
- Revenue for transition: oil earnings fund diversification and clean energy in exporting countries:
- the UAE’s Masdar;
- Saudi Arabia’s Vision 2030 solar and hydrogen projects;
- Norway’s sovereign wealth fund.
- Oil companies as energy companies: some majors invest in offshore wind, biofuels, carbon capture and hydrogen, using their engineering skills. Critics see much of this as greenwashing.
- Cleaner oil and substitutes: methane-leak control, refinery efficiency, biofuels and ethanol blending (India reached E20 in 2025), sustainable aviation fuel and synthetic e-fuels.
- Peak demand debate: the IEA expects world oil demand to plateau at about 105–106 million barrels a day around 2030, as electric vehicles spread and China’s demand slows. OPEC expects growth to continue for longer.
- Transition risks for oil:
- stranded assets, meaning fields that may never be fully used;
- fiscal stress for petro-states that have not diversified;
- security risks if investment falls faster than demand.
Energy Mix and the Transition
Energy Mix as a Step towards Sustainability
- Energy mix is the combination of primary sources (coal, oil, gas, nuclear, hydro, solar, wind, biomass, geothermal) used to meet a country’s demand.
- Why a diverse mix supports sustainability:
- Resilience: no single fuel failure or supplier can halt the system.
- Lower emissions: each low-carbon source added reduces carbon intensity.
- Use of local resources: solar in deserts, wind on coasts, hydro in mountains and geothermal on plate boundaries reduce imports.
- Price stability: renewables have near-zero fuel cost, which dampens volatility.
- Complementarity: solar peaks by day and wind often at night or in the monsoon, while hydro and storage balance both.
- Limits:
- intermittency;
- land and water needs;
- grid and storage costs;
- local opposition;
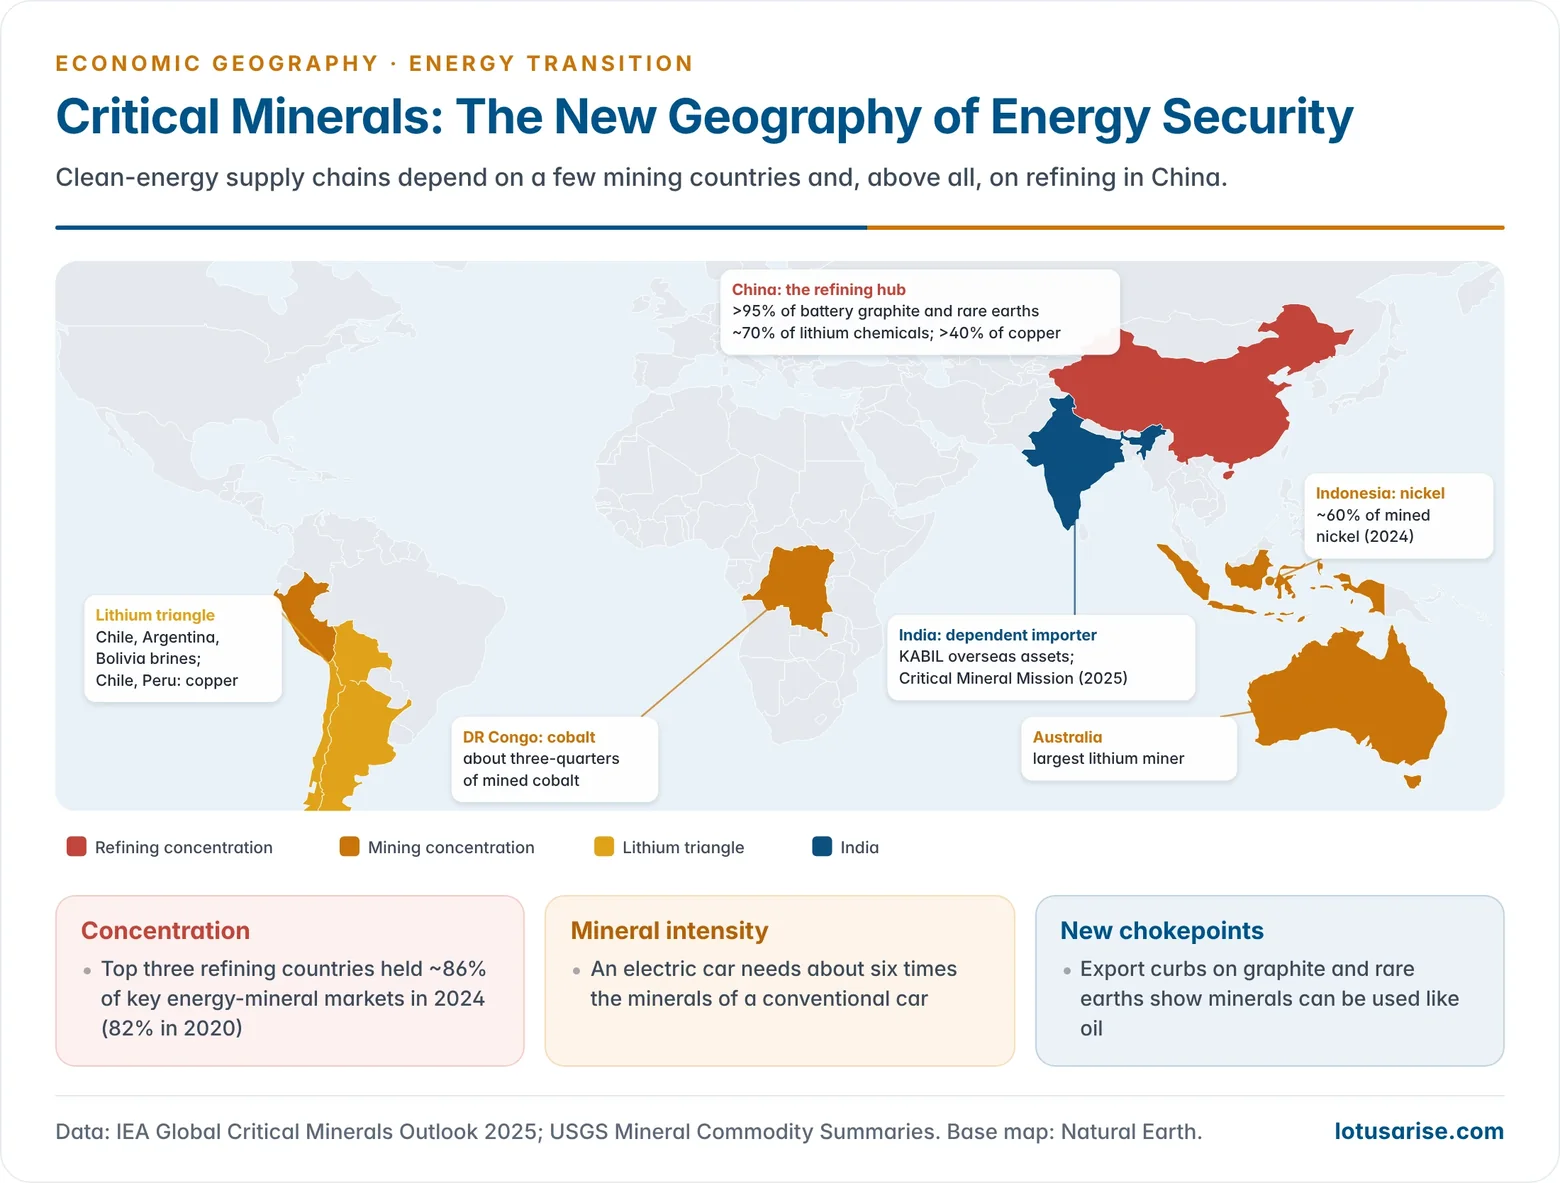
- mineral intensity. An electric car needs about six times the minerals of a conventional car.
The World Mix Today
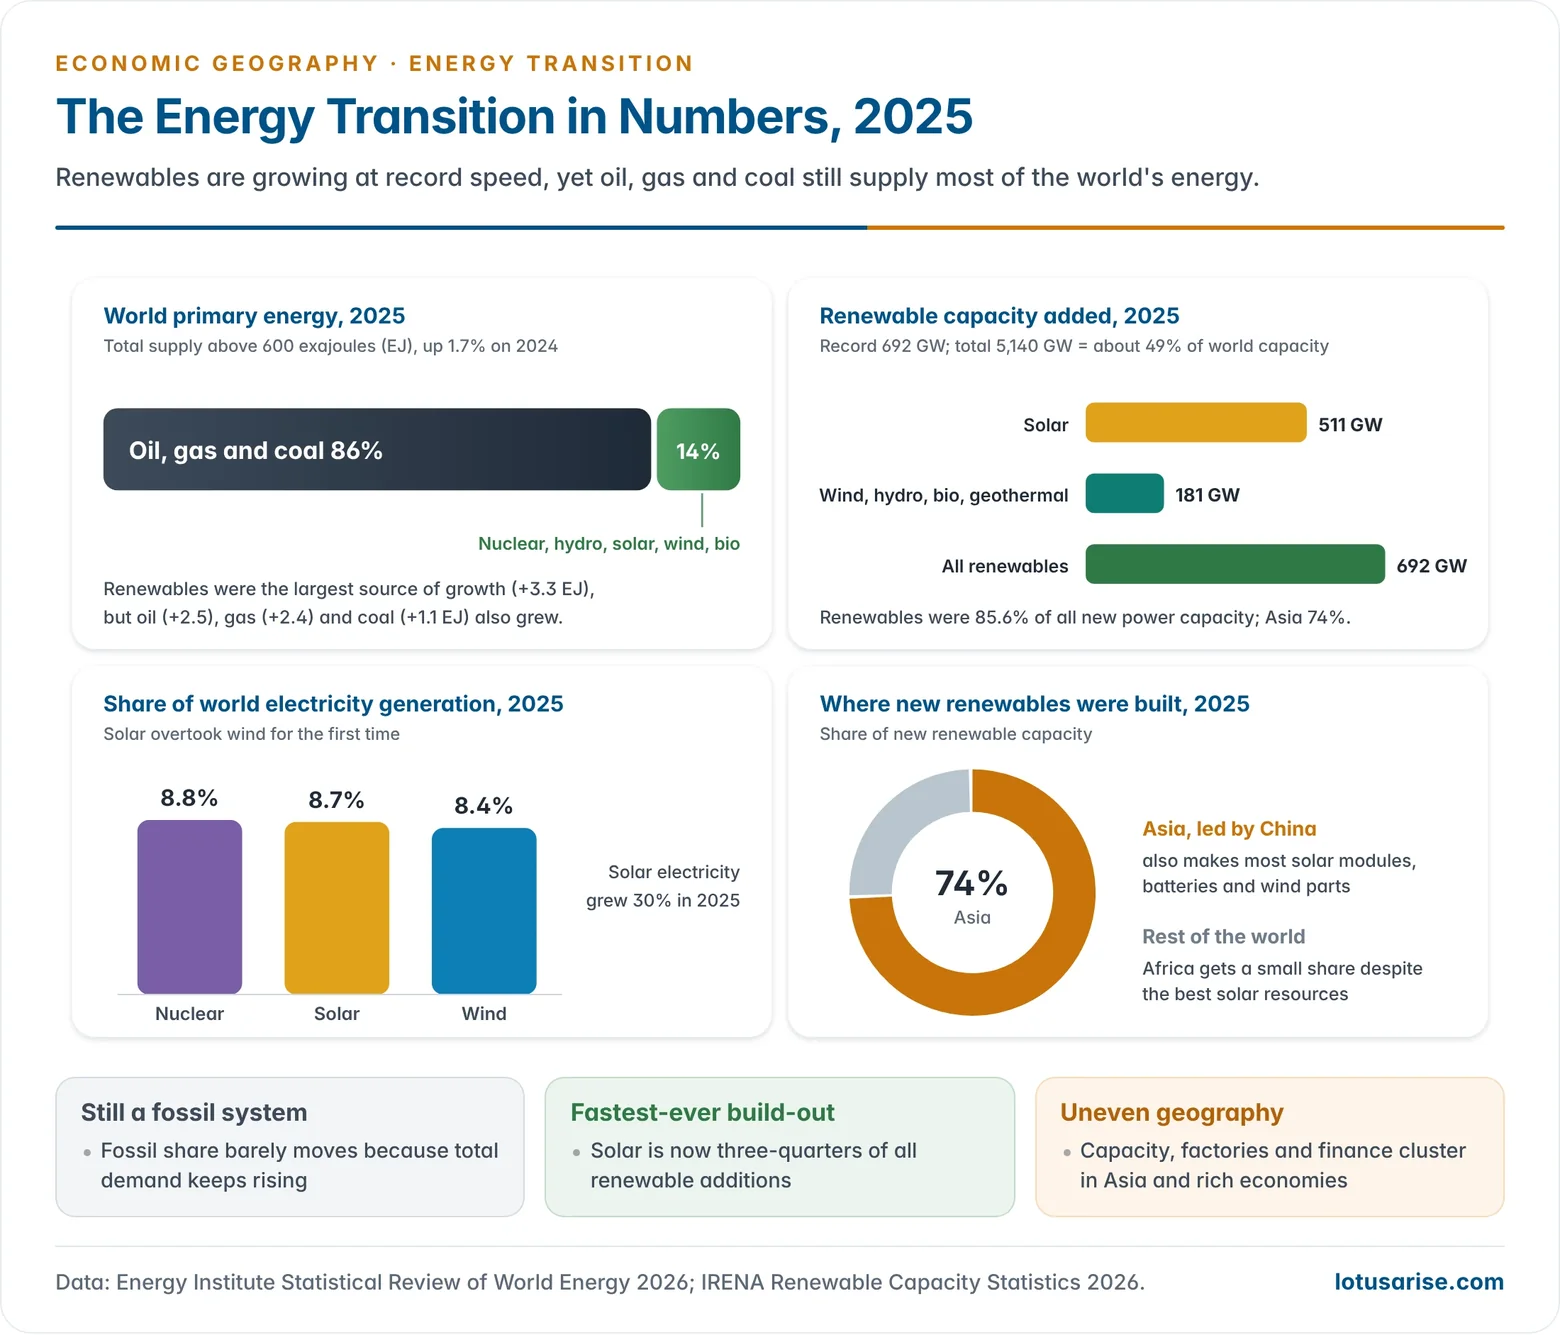
- Fossil dominance persists: in 2025 fossil fuels still supplied about 86% of primary energy. Total primary energy passed 600 exajoules, and oil, gas and coal all grew.
- Renewables lead growth: renewables were the largest source of new energy supply in 2025.
- A record 692 GW of renewable capacity was added, 511 GW of it solar.
- Total renewable capacity reached about 5,140 GW, nearly half of world power capacity.
- In power generation, solar (8.7%) overtook wind (8.4%) for the first time and nearly matched nuclear (8.8%).
- Asia leads: Asia accounted for about three-quarters of new renewable capacity, and China dominates the manufacture of solar modules, batteries and wind components.
- Historic transitions were slow: the shifts from wood to coal and from coal to oil each took 50–70 years. The present transition must be much faster to meet climate goals.
Geography of Renewable Energy
- Solar:
- best in the subtropical high-pressure deserts and drylands: Sahara, Arabia, Atacama, Thar, south-west USA and Australia;
- large parks such as Bhadla (Rajasthan), Noor Ouarzazate (Morocco) and Al Dhafra (UAE).
- Wind:
- strongest in the westerly belts and coasts: the North Sea, Baltic, Great Plains, Patagonia and Inner Mongolia;
- in India, the wind energy belts of the Tamil Nadu and Gujarat coasts.
- Hydro: mountainous, humid regions:
- China (Three Gorges), Brazil, Canada and Norway;
- the Himalaya, where the potential is large but so are the hazards.
- Geothermal: along plate boundaries such as Iceland, Kenya’s Rift Valley, Indonesia, the Philippines and New Zealand.
- Bioenergy: sugarcane ethanol in Brazil, maize ethanol in the USA, and compressed biogas in India.
Nuclear Power and the Impact of Nuclear Shutdowns
- Nuclear power gives steady, low-carbon base-load electricity. Its drawbacks are accident risk, radioactive waste, high capital cost, long construction times and proliferation concerns.
- Countries most affected by a nuclear shutdown are those that depend heavily on it or have few domestic alternatives:
- France draws about two-thirds of its electricity from nuclear and exports power to neighbours. A fleet shutdown, as with corrosion problems in 2022, raises prices across Europe.
- Slovakia, Ukraine, Hungary, Belgium, Czechia, Finland and Switzerland rely on nuclear for roughly a third to over half of their power.
- Japan: after the Fukushima disaster (March 2011) all reactors went offline. Japan turned to imported LNG, oil and coal, which caused trade deficits and higher emissions. Only about 14 reactors had restarted by 2025.
- Germany closed its last three reactors on 15 April 2023. It relied more on coal, gas imports and renewables, and paid higher power prices during the 2022–23 crisis.
- Taiwan became nuclear-free in May 2025, increasing LNG dependence.
- Nuclear revival:
- At COP28 (2023) over 20 countries pledged to triple nuclear capacity by 2050.
- Belgium repealed its phase-out law (2025).
- Small modular reactors (SMRs) are being developed in the USA, Canada, the UK and China.
- India:
- 24 operating reactors (about 8 GW) at its nuclear power plants, with a target of 100 GW by 2047;
- the SHANTI Act, 2025 (Sustainable Harnessing and Advancement of Nuclear Energy for Transforming India) opens parts of the sector to private participation.
Coal: The Hardest Transition
- Coal is the most carbon-intensive fuel, yet it remains the base of power in China, India, Indonesia and South Africa.
- Environmental problems of coal production:
- land degradation and loss of forest from open-cast mining, as in Jharia, Singrauli, Korba and Talcher;
- mine fires and subsidence. The Jharia coalfield has burned for over a century;
- air pollution from dust and power plants (SO₂, NOx, particulates);
- acid mine drainage and water pollution;
- fly ash disposal;
- methane release, a potent greenhouse gas.
- Economic problems:
- Indian coal from the Gondwana coalfields is high in ash and low in calorific value, so it is costly to transport;
- coking coal must be imported;
- railway freight costs are high, and pithead and load-centre locations are mismatched;
- mines and plants are often loss-making;
- tribal displacement and rehabilitation costs;
- stranded-asset risk as renewables become cheaper.
- Coal-dependent regions: whole economies in Jharkhand, Chhattisgarh and Odisha, and in the Appalachians and Ruhr earlier, depend on coal jobs and royalties.
- This makes a just transition necessary: reskilling workers, diversifying local economies and restoring mined land.
- Global policy:
- at COP26 (Glasgow, 2021) the text was changed from coal “phase-out” to “phase-down” at India’s and China’s insistence;
- Just Energy Transition Partnerships were agreed with South Africa (2021), Indonesia and Viet Nam (2022).
Net Zero 2050: Transition as the Instrument
Why the Energy Transition Is Central to Net Zero
- Net zero means balancing remaining greenhouse-gas emissions with removals so that the net addition is zero. Limiting warming to 1.5 °C requires global CO₂ to reach net zero around 2050.
- Energy is about three-quarters of global greenhouse-gas emissions. Net zero is therefore impossible without transforming how energy is produced and used.
- The IEA Net Zero by 2050 roadmap (2021) identifies six pillars:
- energy efficiency;
- behavioural change;
- electrification of transport, heating and industry;
- renewables;
- hydrogen and hydrogen-based fuels;
- bioenergy and carbon capture (CCUS).
- The COP28 UAE Consensus (2023) committed parties to transition away from fossil fuels in energy systems, triple renewable capacity and double the rate of efficiency improvement by 2030.
- National targets: the EU, the USA, the UK and Japan aim for net zero by 2050, China by 2060, and India by 2070.
Challenges of the Transition
- Critical minerals: clean technologies need lithium, nickel, cobalt, graphite, copper and rare earths. Their supply, like the distribution of key natural resources generally, is highly concentrated.
- The top three refining countries hold about 86% of the market for key energy minerals (2024).
- China refines over 95% of battery-grade graphite and rare earths and about 70% of lithium chemicals.
- Indonesia mines about 60% of the world’s nickel, and the DR Congo about three-quarters of its cobalt.
- Finance gap: most clean-energy investment flows to China, the advanced economies and a few emerging economies. Africa receives a small share despite the best solar resources.
- Grids and storage: intermittent renewables need transmission lines, batteries, pumped hydro and flexible demand. Grid bottlenecks already delay projects.
- Hard-to-abate sectors: steel, cement, chemicals, aviation and shipping need green hydrogen, CCUS or new processes that are still costly.
- Equity and justice: developing countries stress common but differentiated responsibilities, low per capita emissions and their right to development. They want finance and technology transfer, not trade barriers such as the EU’s Carbon Border Adjustment Mechanism.
- Security trade-offs: the transition swaps oil chokepoints for mineral chokepoints. A sudden collapse in fossil investment before alternatives are ready could also cause new crises.
India’s Energy Transition and Energy Security
Commitments
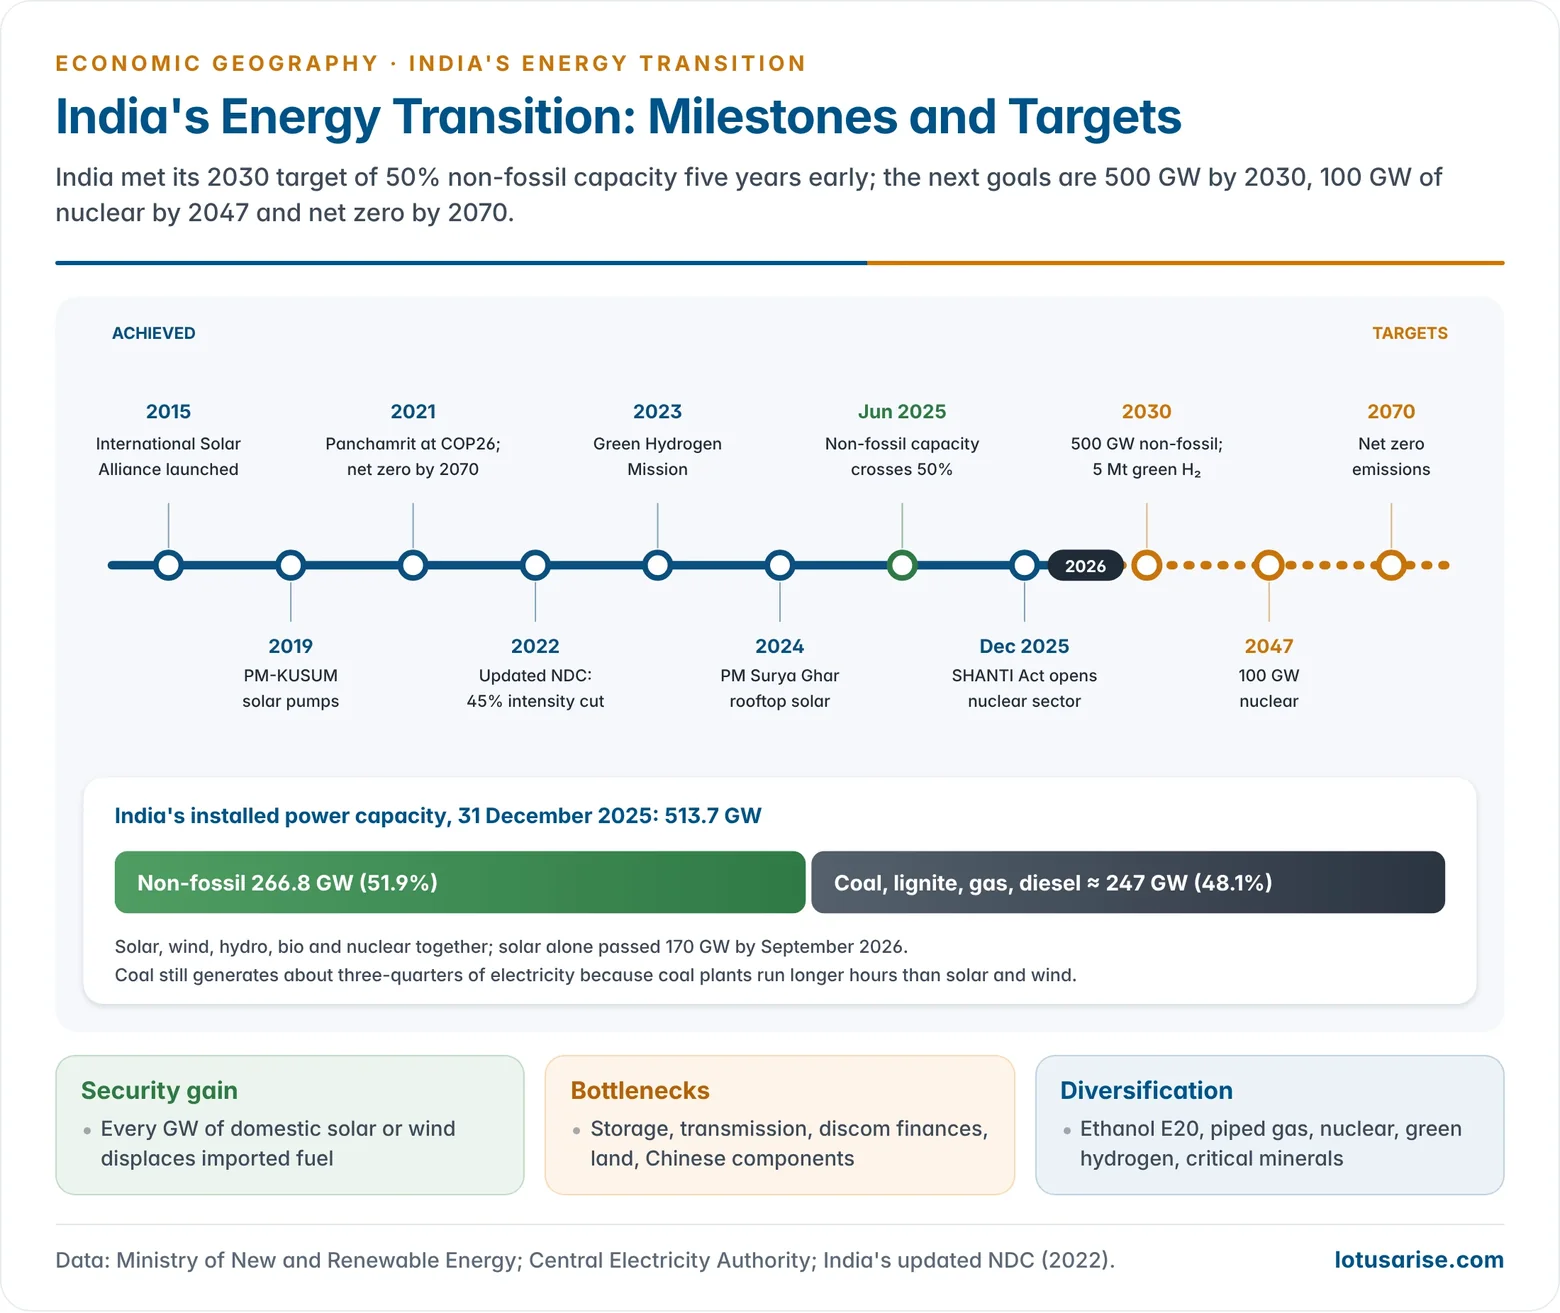
- Panchamrit (COP26, 2021):
- 500 GW of non-fossil capacity by 2030;
- 50% of energy requirements from renewables by 2030;
- cut projected emissions by one billion tonnes by 2030;
- reduce the emission intensity of GDP by 45% below 2005 levels by 2030;
- net zero by 2070.
- The updated NDC (2022) made the 45% intensity cut and 50% of installed power capacity from non-fossil sources by 2030 formal targets.
Progress
- Non-fossil capacity crossed 50% of installed capacity in June 2025, five years ahead of target. By December 2025 it was about 267 GW out of 514 GW.
- Solar capacity passed 170 GW by September 2026, and India ranks third in the world in installed renewable capacity.
- Large solar parks at Bhadla (Rajasthan), Pavagada (Karnataka) and the Khavda renewable park (Gujarat), with wind along the Gujarat and Tamil Nadu coasts.
Policies and Missions
- International Solar Alliance (2015, with France).
- PM-KUSUM (solar pumps for farmers) and PM Surya Ghar (rooftop solar for one crore homes, 2024).
- National Green Hydrogen Mission (2023): 5 million tonnes a year of green hydrogen by 2030.
- Production-linked incentives for solar modules and advanced batteries; Green Energy Corridors for transmission.
- National Critical Mineral Mission (2025) and overseas mineral assets through KABIL.
- Ethanol blending (E20), compressed biogas under SATAT, and nuclear expansion under the SHANTI Act.
Security Measures
- Diversified crude imports: large Russian purchases after 2022, and supplies from the USA, Guyana and Brazil.
- Strategic Petroleum Reserves, expanding LNG terminals and the city gas network, and energy partnerships with the UAE, Saudi Arabia and the USA.
Challenges
- Coal still generates about three-quarters of electricity.
- Storage and grid integration lag; distribution companies are financially weak; land acquisition is difficult.
- Renewables are concentrated in a few states.
- Imports of solar cells and battery materials from China are high.
- The 2026 crisis showed that LPG and crude import dependence remain India’s sharpest vulnerability.
- The lesson: domestic renewables, electrified transport and efficiency improve both climate outcomes and energy security. This is why India treats the transition as a security strategy, not only a climate goal.
Previous Year Questions
2025Why is oil important for energy security? What is the role of oil in the clean energy transition?2023Discuss the green energy initiatives of India as a signatory nation to the Paris Agreement.2023Critically examine the role of petroleum energy resources on International Geopolitics with special reference to India.2021How is energy transition seen as an instrument for achieving zero carbon by 2050?2015“Energy mix is a step towards sustainability.” Discuss.2014Discuss environmental and economic problems associated with coal production.2013Write short note: Countries most effected in case of shut down of Nuclear power.




