

- The global shift is the large-scale relocation of manufacturing since the 1960s.
- It ran from the old industrial cores of North America, Western Europe and Japan to East Asia, and then to South and Southeast Asia, Mexico and Eastern Europe.
- The term comes from Peter Dicken’s Global Shift (first published 1986). He showed how transnational corporations, states and technology together remake the map of production.
- The shift has two faces:
- deindustrialisation in much of the developed world;
- industrialisation in parts of the developing world.
- Yet the two are not a simple mirror image. Today’s phase adds automation, reshoring, “China plus one” and chip geopolitics.
From the NIDL to Global Value Chains

Phases of the Global Shift
| Phase | Period | What moved | Where to | Drivers |
|---|---|---|---|---|
| Early offshoring | 1960s–1970s | Textiles, garments, simple electronics assembly | Four Tigers, Mexico (maquiladoras) | Wage gaps, EPZs, containers |
| China as workshop | 1980s–2000s | Most labour-intensive assembly, then electronics and machinery | Coastal China | Reform (1978), SEZs, WTO entry (2001) |
| Fragmented global value chains | 1990s–2008 | Stages of products split across many countries | East and Southeast Asia, Eastern Europe, Mexico | ICT revolution, falling tariffs, the internet |
| Slowbalisation | 2008–2019 | Trade growth slows; China moves up the chain | China inland, Vietnam, Bangladesh | Rising Chinese wages, the 2008 crisis |
| Resilience and rivalry | 2020–present | Chips, batteries, pharmaceuticals, phones | US, Mexico, India, Vietnam, Eastern Europe | COVID-19, tariffs, export controls, industrial policy |
- The first phase is the new international division of labour of the 1970s. Labour-intensive stages left the North while control stayed there.
- The next phases deepened it into global value chains (GVCs): one product’s stages, from design and components to assembly and services, sit in different countries.
- About half of world trade now moves through GVCs (World Bank, 2020).
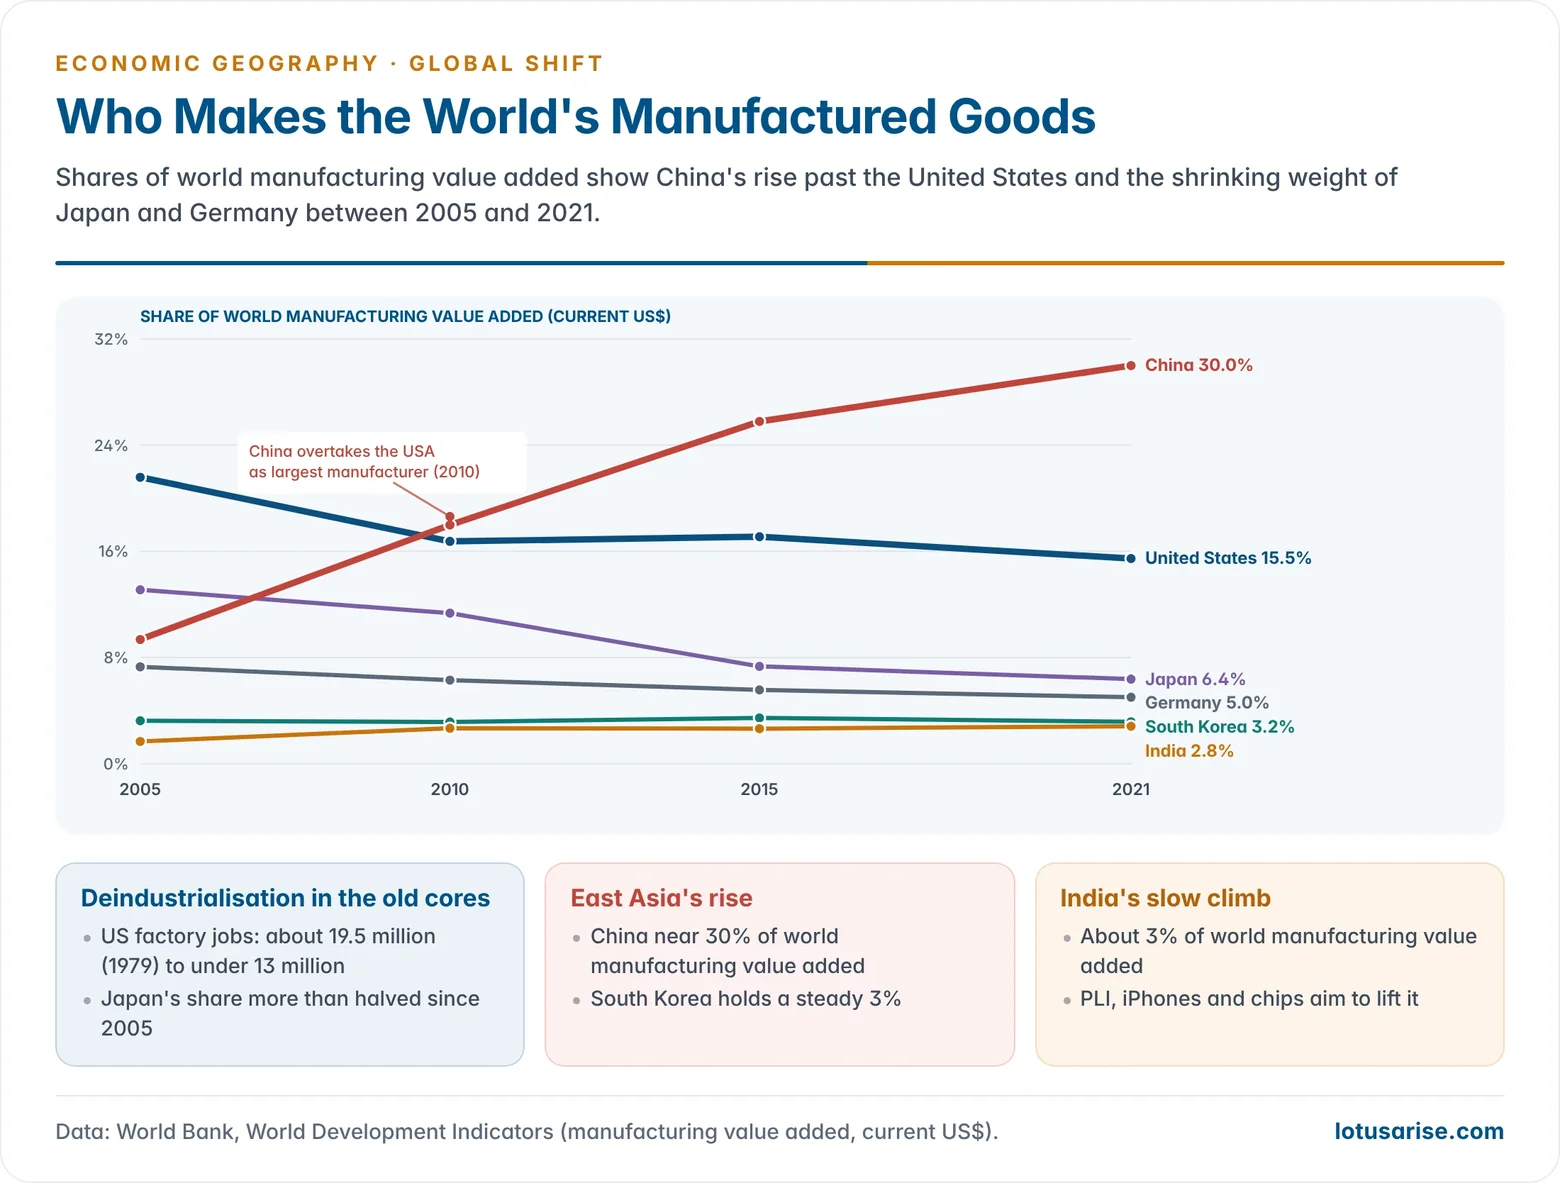
- Today China produces about 29% of world manufacturing value added (2023), roughly 12 percentage points ahead of the United States. Fifty years ago the developed world produced most of it.
Explaining the Global Shift
- Peter Dicken’s framework: the shift results from the interaction of four sets of actors and forces:
- transnational corporations, which organise production networks;
- states, which bargain with firms through incentives, trade policy and regulation;
- technology, which shrinks time and space (containers, ICT) and transforms production (automation);
- labour and consumers, whose costs, skills and demand vary across places.
- Product life cycle model (Raymond Vernon, 1966):
- new products are made near innovating firms and rich markets, as in the USA;
- once standardised, production moves to other developed countries and finally to low-cost locations, which explains the offshoring of radios, televisions and later PCs.
- Flying geese model (Kaname Akamatsu, 1930s; widely applied from the 1960s):
- industries move in sequence from a lead economy to followers as wages rise;
- Japan → the Tigers → coastal China → Southeast Asia and South Asia;
- textiles first, then electronics, then cars and chips.
- Spatial divisions of labour (Doreen Massey, 1984): firms place control, research, skilled production and routine assembly in different regions. The global shift repeats this pattern on a world scale.
- Cost arbitrage versus capability:
- early phases chased cheap labour;
- today supplier ecosystems, skills, infrastructure, energy costs and political risk weigh as heavily. This explains why China kept its lead despite rising wages.
Governance of Global Value Chains
- Gary Gereffi (1994) distinguished two kinds of chains:
- producer-driven chains, such as cars, aircraft and chips, controlled by manufacturers that own technology;
- buyer-driven chains, such as garments, toys and footwear, controlled by brands and retailers that own design and markets.
- Later work (Gereffi, Humphrey and Sturgeon, 2005) identified five governance types: market, modular, relational, captive and hierarchy. They differ in how complex the transactions are and how capable the suppliers are.
- Upgrading is how a place moves up a chain:
- process upgrading (doing tasks better);
- product upgrading (better products);
- functional upgrading (taking on design or branding);
- chain upgrading (moving to a new sector).
- Taiwan and South Korea are the classic successes.
Deindustrialisation in the Developed World
- Deindustrialisation is the long-run fall in manufacturing’s share of employment (and, more slowly, of output) in an economy.
- US manufacturing jobs peaked at about 19.5 million in 1979 and are now under 13 million, even though real output kept rising.
- In the UK and Western Europe, manufacturing fell to around a tenth of jobs. Rust belts formed in the US Midwest, the Midlands, northern England, Wallonia and the Ruhr.
- Causes (after Robert Rowthorn and Ramana Ramaswamy, 1997, and later work):
- Productivity growth: machines and better processes need fewer workers for the same output. This is the largest single cause.
- Shift of demand to services as incomes rise.
- Trade and offshoring: imports from low-wage economies, especially the “China shock” after 2001, which hit US regions making furniture, toys and textiles.
- Outsourcing of services such as cleaning, logistics and design. Some “manufacturing” jobs were reclassified as service jobs.
- Consequences:
- regional unemployment and decay of one-industry towns;
- wage polarisation and a shrinking middle class;
- population loss in cities such as Detroit (which declared bankruptcy in 2013);
- political backlash, with protectionism and populism;
- and, on the positive side, brownfield renewal in places like Pittsburgh, Manchester and the Ruhr.
- Policy responses (reindustrialisation):
- the US uses the CHIPS Act, the Inflation Reduction Act and tariffs;
- the EU uses its Green Deal Industrial Plan, Chips Act and Critical Raw Materials Act;
- the UK and Japan have their own industrial strategies.
- All aim to bring back strategic, high-value manufacturing rather than mass factory employment.
- Is deindustrialisation simply the mirror of Asian industrialisation? Only partly.
- Productivity explains more job loss than trade.
- Much FDI still flows between developed countries.
- Rich countries still lead in high-value manufacturing: aircraft, machinery, pharmaceuticals and chip equipment.
- Germany, Japan, South Korea and Switzerland kept large manufacturing sectors through skills, specialisation and exports.
Industrialisation in the Developing World
- East Asia led the way:
- Japan, then the Four Tigers, then China under reform, SEZs and WTO entry;
- then Vietnam, Malaysia, Thailand and Indonesia.
- Mexico became the main US near-shore base. In 2023 Mexico overtook China as the largest source of US goods imports.
- Eastern Europe (Poland, Czechia, Hungary, Slovakia) became Germany’s car and parts workshop.
- India’s path has been different:
- its gains came mainly in services, such as IT and business process outsourcing;
- manufacturing has stayed at about 15–17% of GVA;
- Make in India (2014) and the production-linked incentive (PLI) schemes (2020) aim to change this through electronics, phones, pharmaceuticals, solar modules and auto parts.
- By 2025 India assembled about a quarter of the world’s iPhones (about 55 million units).
- Smartphones became India’s largest single export item in 2024–25, at about $24 billion, overtaking petroleum products and diamonds.
- Vietnam as a model of the China-plus-one era:
- Since the Doi Moi reforms (1986) and WTO entry (2007), Vietnam has drawn electronics FDI. Samsung’s plants in Bac Ninh and Thai Nguyen make a large share of its phones, and Intel’s test plant is in Ho Chi Minh City.
- Electronics overtook garments and footwear as its leading export, though much of the value still lies in imported Chinese and Korean components.
- Bangladesh shows the limits of the model: it is the world’s second-largest apparel exporter, but it remains dependent on one sector, with low wages and safety concerns after Rana Plaza (2013).
- Premature deindustrialisation: Dani Rodrik (2016) showed that many developing countries in Latin America and Sub-Saharan Africa are deindustrialising at much lower incomes than the West did. Automation and Asian competition close the classic factory route to development.
| Feature | Developed world | Developing world |
|---|---|---|
| Employment in manufacturing | Long decline (deindustrialisation) | Rise in East Asia; stagnation or early peak elsewhere |
| Activities kept or gained | Design, R&D, high-value goods, services | Assembly, components, increasingly design (China) |
| Main driver | Productivity, offshoring, services shift | FDI, EPZs, cheap labour, state industrial policy |
| Spatial effect | Rust belts, brownfields, knowledge cities | Coastal export zones, megacity growth, inland shift |
| Examples | Detroit, Midlands, Ruhr, Wallonia | Pearl River Delta, Bac Ninh, Bajío, Sriperumbudur |
The New Phase: Reshoring, China Plus One and Automation
Rewiring of Supply Chains
- Shocks that exposed long chains:
- the 2011 Japanese tsunami and Thai floods;
- the US–China trade war (2018);
- the COVID-19 shutdowns (2020–22);
- chip shortages (2021);
- the Russia–Ukraine war (2022);
- Red Sea attacks (2024);
- sweeping US tariffs (2025).
- Strategies:
- Reshoring: bringing production home. Examples are US chip fabs and EV battery plants under the CHIPS Act and Inflation Reduction Act (2022).
- Near-shoring: moving close to markets: Mexico for the USA, Eastern Europe and Morocco for the EU.
- Friend-shoring: sourcing from allies, under export controls and trusted-supplier lists.
- China plus one: keeping China but adding another base, typically Vietnam, India, Malaysia, Indonesia or Thailand.
- Limits: China still dominates batteries, solar, rare-earth processing and many intermediate inputs. Many “new” factories in Vietnam or Mexico depend on Chinese components. Diversification is real but slow and partial.
Automation and the Economics of Labour
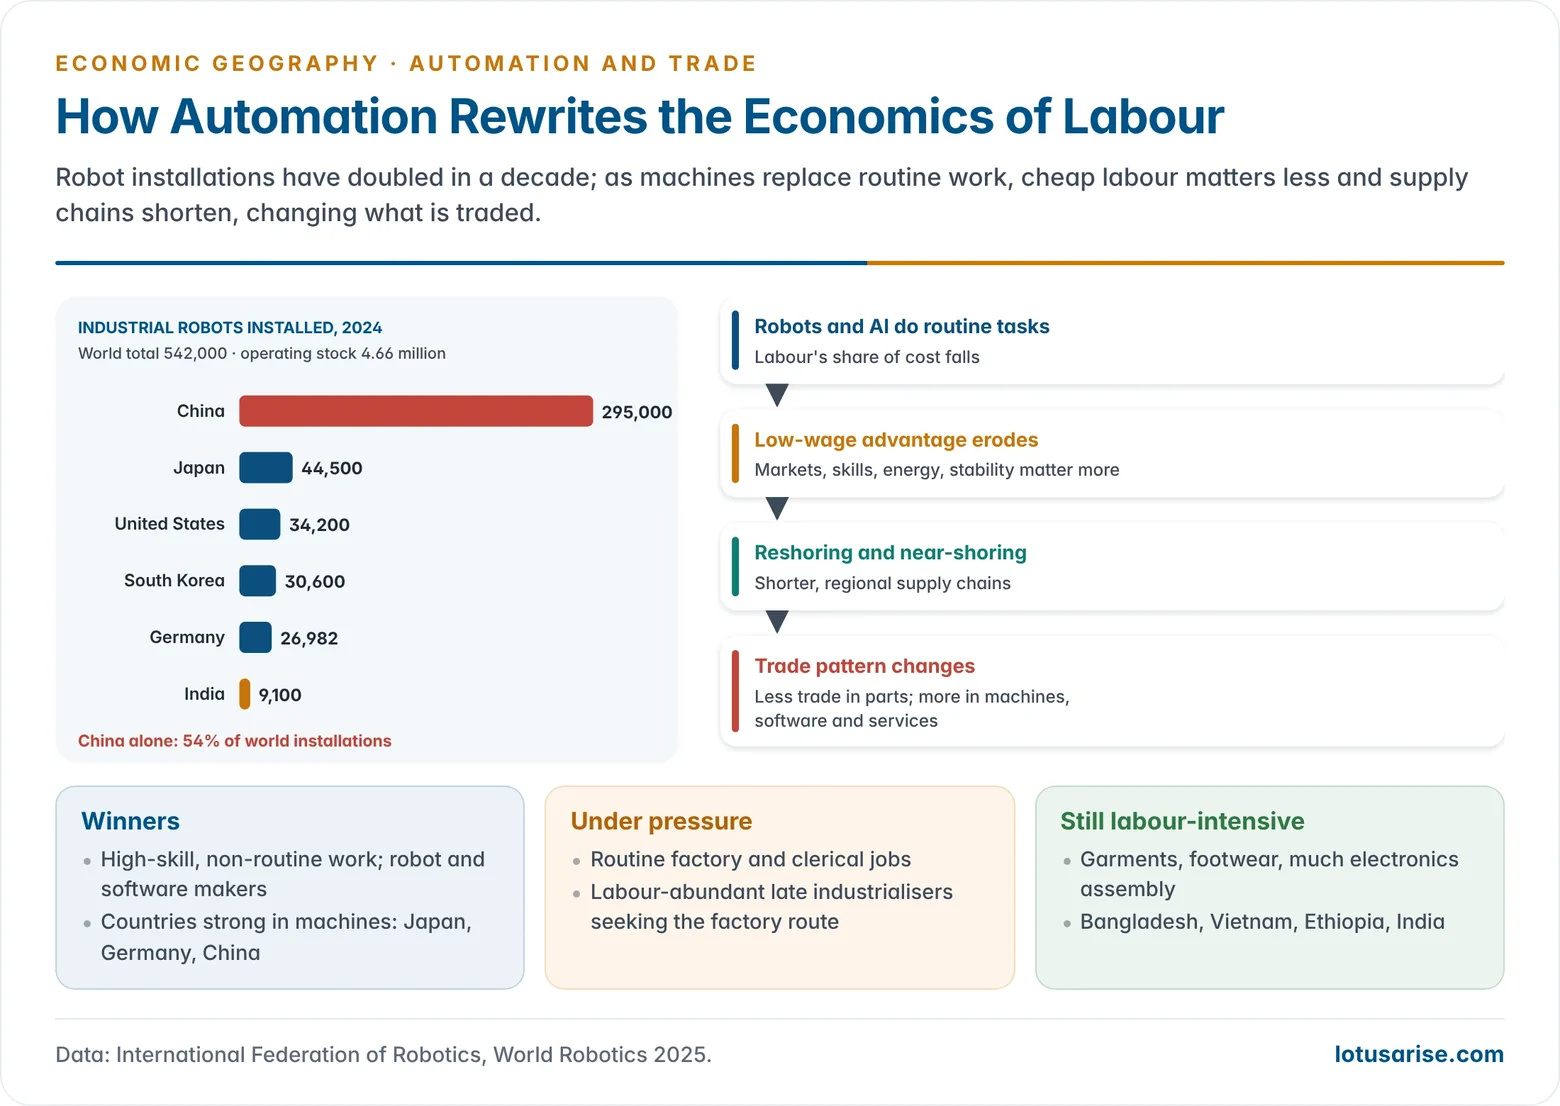
- Industrial robots: 542,000 were installed worldwide in 2024, more than double the figure ten years earlier, bringing the operating stock to 4.66 million (IFR, 2025).
- China alone installed 295,000 (54%), more than the rest of the world combined.
- Japan, the USA, South Korea and Germany follow. India installed about 9,100 and ranks sixth.
- Effects on the economics of labour:
- Automation erodes the low-wage advantage. When robots do the work, wage differences matter less, and closeness to markets, skills, energy and stability matter more.
- Routine manual and clerical jobs are most at risk. High-skill and non-routine jobs gain. Wage inequality widens within countries.
- For labour-abundant developing economies, the classic path of labour-intensive export manufacturing narrows.
- Effects on trade patterns:
- reshoring of some production to high-income markets, which shortens chains;
- less trade in intermediate parts, and more trade in machines, robots, software and services;
- 3D printing (additive manufacturing) enables local, on-demand production of parts;
- China’s heavy automation lets it keep production despite rising wages.
- Not a one-way story: automation also makes firms more productive and can create demand. Low-wage assembly of garments and footwear (Bangladesh, Ethiopia) still relies on hand labour.
Geography of Semiconductor Manufacturing
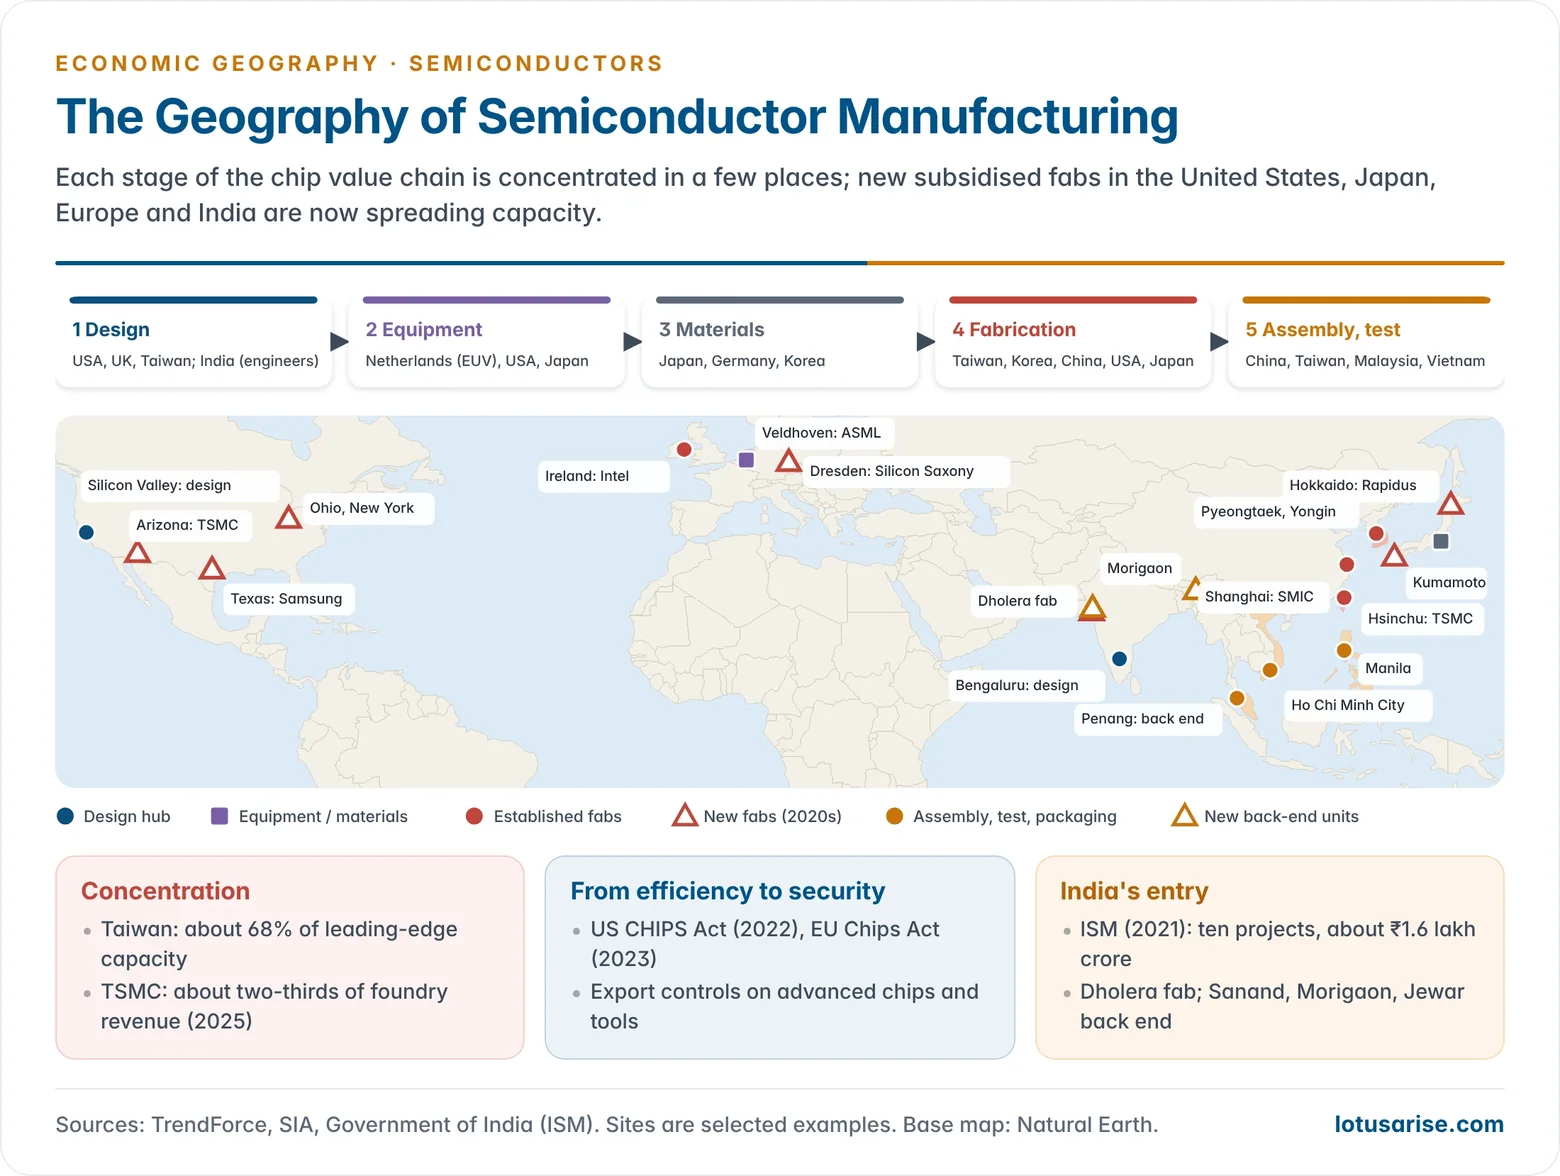
- Semiconductors are the most strategic manufacturing industry. Their chain is the clearest case of extreme functional specialisation across countries.
| Stage | Leading places | Key firms or facts |
|---|---|---|
| Chip design | USA (California), UK, Taiwan, China; India for design engineers | Nvidia, Apple, Qualcomm, AMD; Arm (UK) |
| Design software and IP | USA, UK | Synopsys, Cadence, Arm |
| Equipment | USA, Netherlands, Japan | ASML (Netherlands) is the sole supplier of EUV lithography |
| Materials (wafers, gases, chemicals) | Japan, Germany, South Korea, Taiwan | Shin-Etsu, SUMCO |
| Fabrication (front end) | Taiwan, South Korea, China, USA, Japan | TSMC holds about two-thirds of foundry revenue (2025); Taiwan about 68% of leading-edge (16 nm and below) capacity |
| Assembly, test and packaging (back end) | China, Taiwan, Malaysia, Vietnam, Philippines | Malaysia handles over a tenth of world back-end work (Penang, Kulim) |
Spatial Changes and Emerging Patterns
- 1960s–70s: US firms offshored assembly and testing to Hong Kong, South Korea, Singapore, Malaysia and the Philippines. This was an early form of the NIDL.
- 1980s–90s: Japan led memory chips, then South Korea (Samsung, SK Hynix). Taiwan created the foundry model: TSMC was founded in 1987 at Hsinchu Science Park.
- 2000s–2010s: fabrication concentrated in Taiwan and Korea. The US share of world fab capacity fell from over a third in 1990 to about a tenth.
- China expanded mature-node and back-end capacity. Its share of mature-node (28 nm and above) capacity is projected to approach two-fifths by 2027.
- 2020s, from efficiency to security:
- United States: the CHIPS and Science Act (2022) gives about $52.7 billion in support. New fabs are rising in Arizona (TSMC, Intel), Texas (Samsung) and Ohio and New York. Export controls (from 2022) curb advanced chips and tools to China.
- European Union: the European Chips Act (2023) aims to double Europe’s share to 20% by 2030. Key sites are Dresden (“Silicon Saxony”, including TSMC–ESMC) and Ireland.
- Japan: TSMC’s Kumamoto fab (opened 2024) and Rapidus, which targets 2 nm production in Hokkaido by 2027.
- South Korea: the planned Yongin mega-cluster south of Seoul.
- China: a third national chip fund (2024) to build self-reliance in tools and mature chips.
- Southeast Asia: Malaysia (Penang back end), Vietnam (Intel’s test plant at Ho Chi Minh City) and Singapore (specialty fabs).
- India:
- The India Semiconductor Mission (2021) has an outlay of ₹76,000 crore. By 2025 it had approved ten projects worth about ₹1.6 lakh crore:
- Tata–PSMC’s fab at Dholera (Gujarat), India’s first commercial fab;
- Micron’s assembly and test plant at Sanand;
- back-end units of CG Power–Renesas and Kaynes at Sanand;
- Tata’s plant at Morigaon (Assam);
- an HCL–Foxconn unit near Jewar (Uttar Pradesh);
- compound-semiconductor and packaging units in Odisha, Punjab and Andhra Pradesh.
- India already hosts a large share of global chip-design engineers in Bengaluru, Hyderabad and Noida. The first chips from Indian pilot lines came out in 2025.
- The India Semiconductor Mission (2021) has an outlay of ₹76,000 crore. By 2025 it had approved ten projects worth about ₹1.6 lakh crore:
- Emerging pattern:
- Leading-edge fabrication remains highly concentrated in Taiwan, which carries geopolitical risk.
- Subsidised regional hubs are spreading capacity to the USA, Japan, Europe and India.
- China is building a parallel ecosystem of mature-node chips.
- The back end is shifting to Malaysia, Vietnam and India.
- The industry is moving from cost-driven global efficiency to security-driven regionalisation.
Evaluation and Outlook
- Opportunities for developing countries:
- the shift offers jobs, exports, technology and FDI;
- shifting trade patterns open space for India, Vietnam, Mexico, Indonesia and Morocco as firms diversify from China;
- green manufacturing (batteries, solar, hydrogen) creates new first-mover chances.
- Environmental dimension:
- The shift moved emissions as well as jobs. Much of China’s and India’s industrial CO₂ is embodied in goods consumed in the West, a form of carbon leakage.
- The pollution-haven effect is now being countered by carbon border taxes such as the EU CBAM (definitive phase from 2026), which will reshape the location of steel, aluminium, cement and fertiliser production.
- Risks:
- lock-in to low-value assembly;
- jobless growth as automation spreads;
- subsidy races between rich states that developing countries cannot match;
- fragmentation of the world economy into rival blocs.
- India’s strategy:
- combine PLI-led assembly with component ecosystems, logistics reform (PM Gati Shakti, dedicated freight corridors), skills and ease of doing business;
- use its domestic market and design talent to move from assembly to higher stages of the smile curve.
Previous Year Questions
2024Analyse the spatial changes and emerging patterns of semiconductor manufacturing in the world.2022“Automation is rapidly changing the economies of labour and will affect trade patterns in significant ways”. Clarify.2019“A large-scale global shift in manufacturing is the outcome of deindustrialization in the developed world matched by industrialization in the developing world.” Analyse this statement.




