

- An energy crisis is a situation in which the supply of energy fails to keep pace with demand, or becomes so costly or uncertain that it disrupts economic activity, social life and international relations.
- It can be acute: a sudden shock from war, embargo, accident or extreme weather.
- It can also be chronic: a long-run imbalance from the depletion of finite fossil fuels, rising demand and slow growth of alternatives.
- The world economy still draws about 86% of its primary energy from oil, gas and coal (2025). These non-renewable stocks took millions of years to form, are unevenly spread and are traded across a few vulnerable routes. A disruption anywhere therefore travels quickly through prices everywhere.
- For economic geography, the energy crisis is a problem of spatial mismatch: energy is produced in a few regions, consumed in others, and moved between them through chokepoints, pipelines and grids.
Nature and Evolution of the Energy Crisis

Meaning and Dimensions
- Supply dimension: physical shortage of fuel or power, caused by depletion, under-investment, war or disaster.
- Price dimension: sudden or sustained price spikes that make energy unaffordable even when it is physically available.
- Access dimension: energy poverty. In 2023 about 666 million people still lacked electricity, most of them in Sub-Saharan Africa, and about 2.1 billion lacked clean cooking fuels.
- Environmental dimension: the crisis of a fossil-based system whose emissions drive climate change. Energy-sector CO₂ reached a record of about 35.8 billion tonnes in 2025.
- Geopolitical dimension: dependence on a few exporters and transit routes turns energy into a strategic weapon.
The Major Oil Shocks and Crises
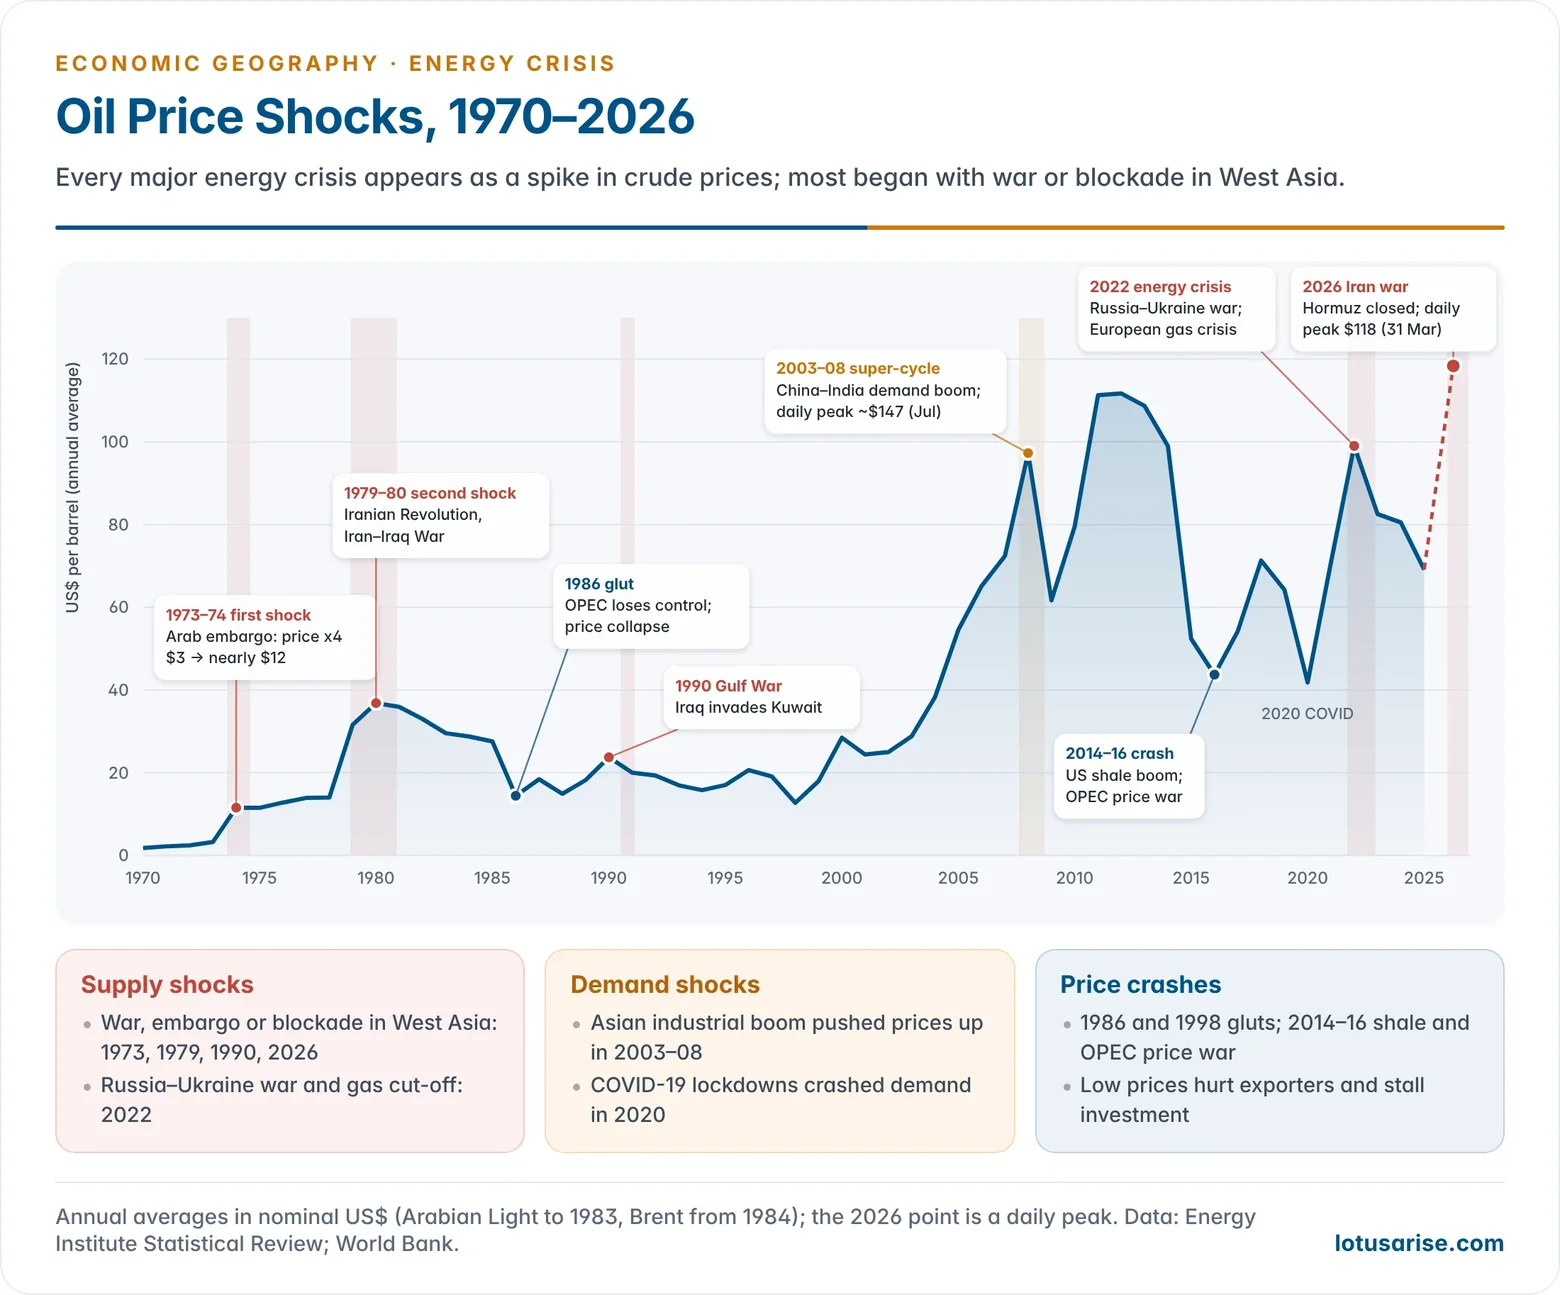
- First oil shock (1973–74): during the Arab–Israeli war of October 1973, Arab members of the Organization of the Petroleum Exporting Countries (OPEC) placed an embargo on the USA and other supporters of Israel and cut output.
- Crude prices roughly quadrupled, from about $3 to nearly $12 a barrel, by early 1974. Saudi Light had been about $1.35 in 1969 and $2.10 in 1972; older accounts give the 1973 rise as $1.5 to $7.
- Second oil shock (1979–80): the Iranian Revolution (1979) and the Iran–Iraq War (1980) cut supplies. Prices more than doubled to over $35 a barrel (annual average) by 1980.
- Saudi Light stood at about $26 in 1979 (older accounts give $24) and $34 in 1981. It fell to about $16 in 1986 and stayed mostly between $12 and $24 through the early 1990s.
- In the economic crisis that followed, wage demands and the cost of living rose in many countries.
- Oil-importing developing countries without foreign-exchange reserves were hit hardest, through inflation, balance-of-payments crises and debt.
- Gulf War spike (1990): Iraq’s invasion of Kuwait briefly doubled prices.
- Commodity super-cycle (2003–2008): demand from China and India outran stagnant supply. Brent peaked near $147 a barrel in July 2008 before the global financial crisis.
- Regional power crises (2005–2008): China faced coal, diesel and power shortages in late 2005 and early 2008, with severe damage to its power networks; South Africa’s grid failure (2008) cut gold output and pushed up the price of platinum, in a crisis then expected to last to 2012; Central Asia suffered when cold weather and low reservoirs crippled hydropower.
- Pakistan’s President announced plans in February 2008 to tackle shortages that had reached crisis level, despite the country’s own hydrocarbons.
- A British energy crisis was forecast for the years after 2009, as coal stations closed, nuclear replacements lagged and North Sea output fell. Britain’s last coal station, Ratcliffe-on-Soar, closed on 30 September 2024.
- Global energy crisis (2021–2023): post-pandemic recovery, low gas storage and the Russia–Ukraine war (2022) sent European gas prices to record highs. Brent rose to near $130 a barrel in March 2022, and Europe turned to imported LNG and rationing plans.
- Iran war fuel crisis (2026): the war that began on 28 February 2026 effectively closed the Strait of Hormuz, which normally carries about one-fifth of world oil and LNG trade.
- The IEA called it the largest supply disruption in the history of the oil market. Brent peaked at about $118 a barrel on 31 March 2026, and IEA members agreed a record 400-million-barrel emergency stock release.
- Attacks on Qatar’s Ras Laffan LNG complex cut gas supplies to Asia and Europe. A ceasefire on 8 April 2026 did not restore normal shipping, and renewed attacks pushed Brent back above $110 by October 2026.
Lessons of the Oil Shocks
- New institutions: the International Energy Agency (IEA) was founded in 1974 by oil-importing OECD countries. It coordinates emergency stocks, and members must hold oil stocks equal to 90 days of net imports.
- New supply regions: high prices made costlier fields worth developing. The North Sea, Alaska, Mexico and later deep-water Brazil and US shale reduced dependence on OPEC.
- Nuclear expansion: France’s Messmer Plan (1974) built a large nuclear fleet that now supplies about two-thirds of its electricity. Japan also expanded nuclear power.
- Efficiency and substitution: fuel-economy standards, smaller cars and the switch from oil to coal, gas and nuclear in power plants cut the oil intensity of rich economies.
- Sustained effort went into improving the internal combustion engine for better mileage.
- Debt crisis in the developing world: oil importers borrowed recycled petrodollars in the 1970s. When interest rates rose around 1980, many Latin American and African countries fell into the debt crisis of the 1980s.
- India’s response: the shocks pushed the development of Bombay High (production from 1976), coal expansion and, later, the search for alternative energy.
Causes of the Energy Crisis
Depletion and Rising Demand
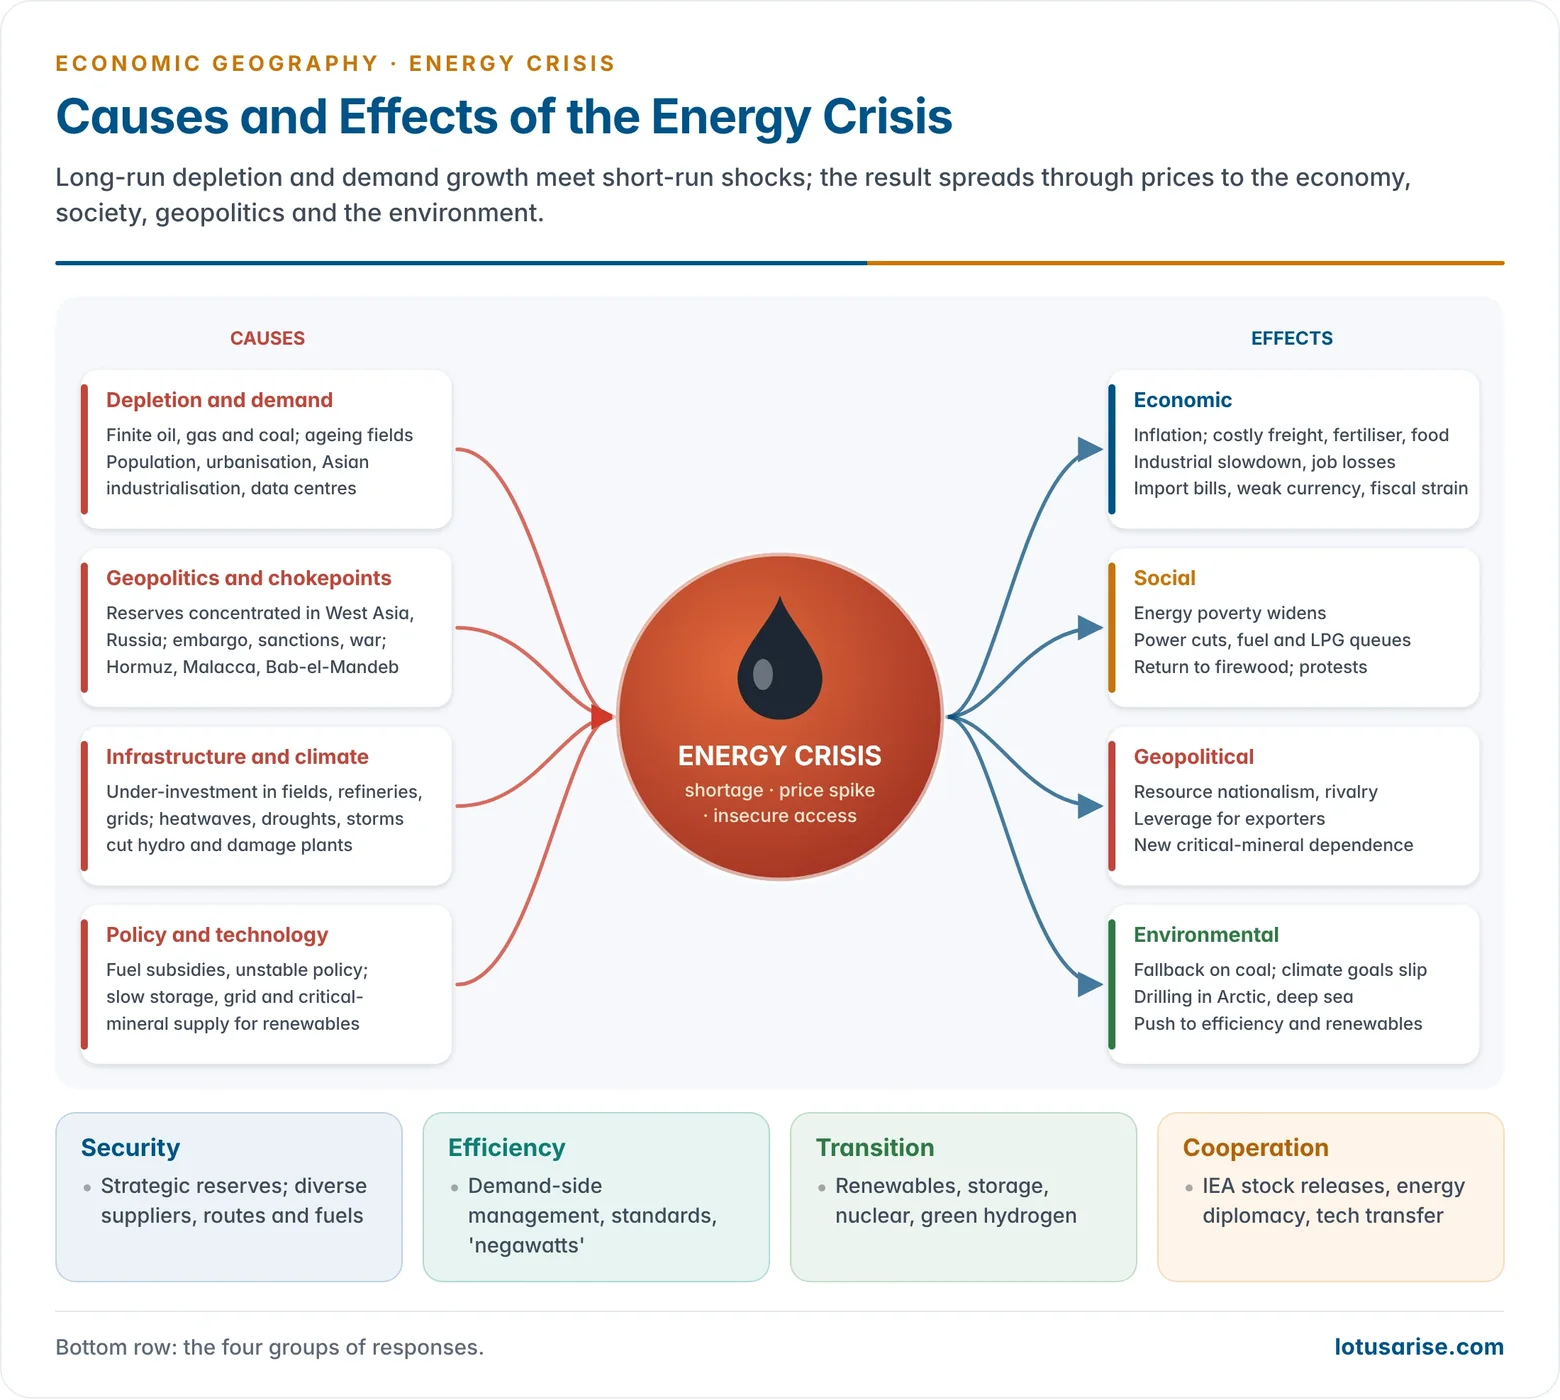
- Finite fossil fuels: oil, gas and coal are exhaustible. Older fields decline, and new reserves lie in deeper, costlier and more fragile settings such as deep sea, Arctic and oil sands. This is the basis of the “peak oil” concern.
- Population growth and urbanisation: more people and more cities mean higher demand for transport, housing, cooling and services. World population was long said to grow by about a quarter of a million people a day.
- Industrialisation of emerging economies: China and India account for most of the world’s demand growth. Their manufacturing, infrastructure and rising consumption push up energy use per head.
- Rising living standards: vehicles, air-conditioners and digital devices raise per capita consumption. data centres and AI are a new and fast-growing source of electricity demand.
- Uneven consumption: a small part of humanity uses a large part of the resources. The United States used about 20.6 million barrels of oil liquids a day in 2025 against about 17.4 million for China, with a far smaller population (Energy Institute, 2026). The older comparison set about 300 million Americans against about 1.3 billion Chinese.
Peak Oil or Peak Demand?
- Peak oil: M. King Hubbert (1956) predicted that US oil output would follow a bell-shaped curve and peak around 1970, which it did for conventional oil. The idea was extended to world output.
- Why the fear faded: new technology (horizontal drilling, hydraulic fracturing, deep-water drilling) added huge unconventional supplies. US shale turned the USA into the world’s largest producer.
- Peak demand: the debate has shifted to when demand will peak. The IEA expects world oil demand to plateau at about 105–106 million barrels a day around 2030 as electric vehicles spread and China’s demand slows. OPEC expects demand to keep rising.
- Either way, the crisis is less about the oil “running out” than about where it is, who controls it and how safely it moves.
Geopolitical and Supply Disruptions
- Concentration of reserves: most proven oil and gas reserves lie in West Asia, Russia and a few OPEC+ states. Conflict, sanctions or regime change there disrupts world supply.
- Embargoes and sanctions: the 1973 embargo, sanctions on Iran and Venezuela, and the sanctions on Russia after 2022 restrict supply to particular markets.
- Chokepoints: a large share of seaborne energy passes a few narrow straits: Hormuz, Malacca, Bab-el-Mandeb, Suez and the Turkish Straits. Houthi attacks in the Red Sea (2023–24) and the 2026 Hormuz closure showed how fragile these routes are.
- Cartel behaviour: production quotas of OPEC+ keep prices above competitive levels.
Infrastructure, Technology and Policy
- Under-investment in exploration, refining, transmission and storage creates bottlenecks. Ageing power plants and grids fail under stress.
- Extreme weather and climate change: heatwaves raise demand, droughts reduce hydropower and cooling water for thermal plants, and storms damage refineries and grids.
- Slow transition: renewables are growing fast, but storage, grid integration and critical-mineral supply lag behind. Fossil fuels therefore remain the backbone.
- Poor policies: heavy fuel subsidies discourage conservation, while frequent policy changes deter long-term investment.
- Accidents, strikes and attacks: pipeline failures, labour strikes, port and production bottlenecks, and attacks on infrastructure cause short but sharp disruptions. The drone strike on Saudi Arabia’s Abqaiq plant on 14 September 2019 suspended 5.7 million barrels a day.
- Limits of each alternative: hydroelectricity is capital-intensive and environmentally sensitive, nuclear energy is costly and potentially hazardous, and overuse of wood and animal waste degrades the land.
Impacts of the Energy Crisis
Economic Impacts
- Inflation: energy enters every production chain, so higher fuel prices raise the cost of manufacturing, freight, fertiliser and food.
- Slower growth and job losses: energy-intensive industries such as steel, aluminium, cement, chemicals and ceramics cut output or shut down.
- Trade imbalances: importers face larger bills, weaker currencies and wider current-account deficits. Wealth shifts from consumers to exporters (petrodollar flows).
- Agriculture and food security: dearer diesel, irrigation power and fertiliser raise food prices. Diversion of crops to biofuels adds pressure.
- Fiscal strain: governments spend more on subsidies and relief, as in the excise cuts on fuel in many countries during 2022 and 2026.
- Investment shifts: each crisis also spurs investment in efficiency, domestic production and renewables.
Social Impacts
- Energy poverty widens: low-income households spend a larger share of income on fuel and power.
- Disruption of daily life: load-shedding, fuel queues and cooking-gas shortages affect health, schooling and livelihoods.
- Unrest: fuel-price protests and riots have followed price hikes in many countries, from the 1970s to recent years.
Geopolitical Impacts
- Resource nationalism and competition for supplies, long-term contracts and overseas assets.
- Shifts in power: exporters gain leverage, while the US shale revolution turned the USA into a net petroleum exporter and changed trade flows.
- New dependencies: clean-energy supply chains depend on critical minerals (lithium, cobalt, nickel, rare earths) whose mining and refining are concentrated, especially in China.
Environmental Impacts
- During shortages, countries fall back on coal, as Europe did in 2022 and Asian importers did in 2026, slowing climate action.
- Pressure to secure supply pushes extraction into ecologically sensitive areas such as the Arctic, the deep sea and tropical forests.
Energy, Development and the Energy Ladder
- Energy use rises with income. A US resident uses roughly ten times as much commercial energy as an Indian, and the gap with the poorest African countries is larger still.
- Traditional or non-commercial energy means firewood, charcoal, dung, farm waste and animal power. Commercial energy means coal, oil, gas, hydroelectricity, nuclear, wind and solar power.
- Conventional sources are coal, petroleum, natural gas and electricity. Non-conventional sources are solar, wind, tidal, geothermal and biogas.
- Poor households move up an energy ladder as income rises: from firewood, dung and crop residue to kerosene and LPG, and then to electricity and piped gas.
- A crisis pushes households back down the ladder. In 2022 and 2026, high LPG prices led many poor families in South Asia to return to firewood, with harm to health from indoor smoke.
- The crisis is therefore also a development problem. Without reliable and affordable energy, industrialisation, irrigation, health services and education all stall.
- The water–energy–food nexus links the three: power is needed to pump irrigation water and make fertiliser, while thermal plants and hydropower need water. A shock in one spreads to the others.
Regional Variation in the Intensity of the Energy Crisis
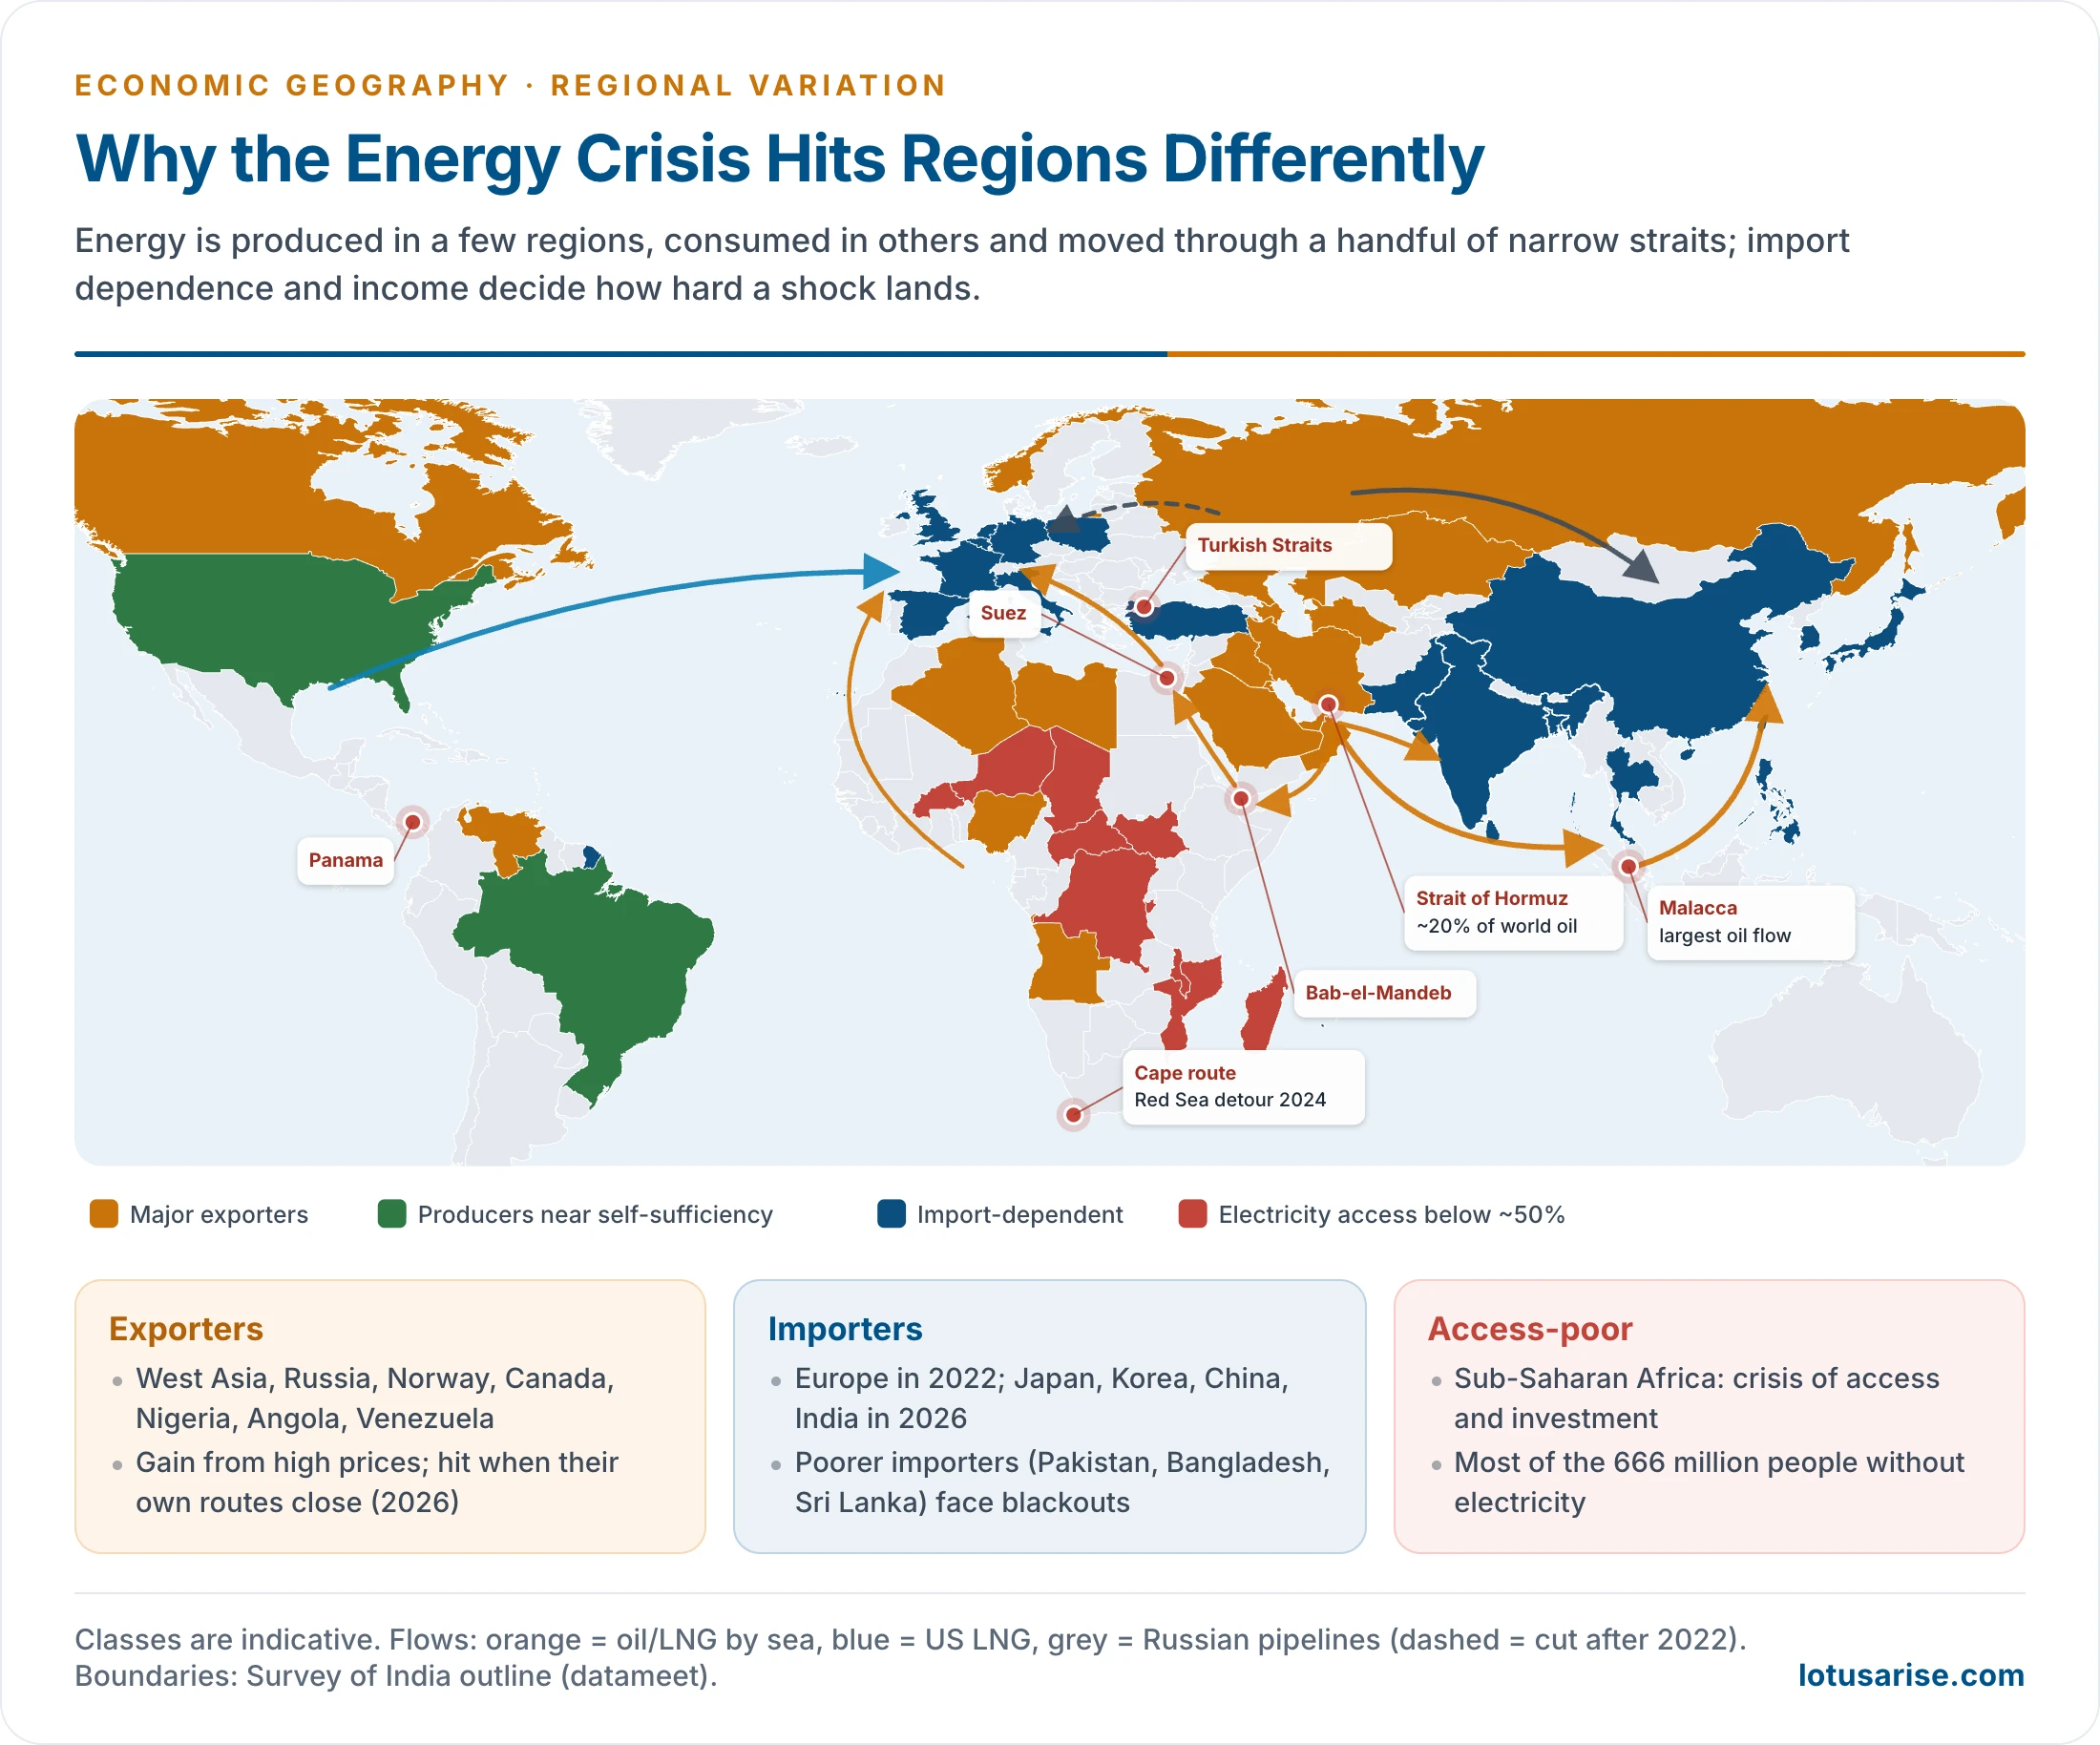
- The crisis is global in origin but regional in impact. Its intensity in a region depends on four things:
- resource endowment;
- import dependence;
- level of development and income;
- diversity of the energy mix.
| Region type | Examples | Nature of crisis | Intensity |
|---|---|---|---|
| Major exporters | Saudi Arabia, UAE, Qatar, Russia, Norway | Revenue windfall in price spikes; exposed to price crashes and transit attacks | Low for supply, high for revenue volatility |
| Self-sufficient diversified producers | USA, Canada, Brazil | Price pass-through, but domestic supply cushions shocks | Low to moderate |
| Rich importers | EU, Japan, South Korea | High import bills, gas dependence, industrial slowdown; can pay and store | Moderate to high |
| Emerging importers | China, India | Huge demand growth, oil and gas import dependence, coal reliance | High |
| Poor importers | Pakistan, Bangladesh, Sri Lanka, East African states | Cannot afford spot cargoes; load-shedding, fuel queues, debt crises | Very high |
| Energy-poor regions | Sub-Saharan Africa | Lack of access itself is the crisis | Chronic |
- West Asia: holds about half of proven oil reserves. Its conflicts set the world price, yet it gains from high prices unless its own export routes are blocked, as in 2026.
- Europe: its dependence on Russian pipeline gas before 2022 made it the epicentre of the 2022 crisis. It then diversified to LNG, renewables and efficiency.
- East and South Asia: Japan, Korea, China and India import most of their oil and much of their gas through Hormuz and Malacca, so they were the most exposed in 2026. Pakistan, Bangladesh and Sri Lanka suffered acute shortages and blackouts.
- Sub-Saharan Africa: Nigeria and Angola export oil, yet the region has the world’s lowest electricity access. Its crisis is one of access and investment, not only of supply.
- North America: shale oil and gas made the USA the largest producer of both. Its crisis is one of prices, not shortages.
India’s Energy Crisis
- India is the world’s third-largest energy consumer and third-largest oil consumer, but its per capita energy use is well below the world average.
- Import dependence:
- 88.7% of crude oil was imported in 2025-26 (245.3 million tonnes), up from older figures of 86–88%;
- 49.9% of natural gas was imported in 2025-26, as LNG;
- about 60% of LPG is imported, and about 90% of that came through Hormuz before the war.
- The oil bill’s share of total imports rose from under 9% in the 1960s to about 30% after the first oil shock.
- Coal dependence: coal supports over 70% of electricity and meets about 55% of primary energy (2026), and thermal stations as a whole gave 77.01% of generation in 2024-25. Domestic coal is high-ash and low in calorific value, so coking coal for steel is imported.
- Coal stock shortages at power plants in October 2021 and April–May 2022 caused power cuts in several states.
- Rising peak demand: the record of about 250 GW in May 2024, driven by heatwaves and cooling, was passed on 25 April 2026 at 256 GW and again on 21 May 2026 at 270.82 GW.
- Coal carried 171.7 GW at that peak, and renewable sources with hydro about 34%.
- Shortage came after sunset: 0.18 GW in solar hours against 2.57 GW in non-solar hours, with seven states short.
- 2026 shock:
- LPG was the first fuel to run short, with long queues, restaurant closures and the shutdown of Gujarat’s Morbi ceramic cluster.
- The government cut excise duty on petrol and diesel by ₹10 a litre.
- Piped natural gas from domestic sources held up better.
- About 70% of crude imports came from outside Hormuz by March 2026, on the Petroleum Ministry’s count. Refiners turned to Russia, Africa and Latin America, and Indian warships escorted tankers east of the strait under Operation Urja Suraksha.
- Strategic reserves: underground Strategic Petroleum Reserves at Visakhapatnam, Mangaluru and Padur (Udupi district, Karnataka) hold 5.33 million tonnes, about 9–10 days of net imports. With company stocks, total cover is about 74 days, against the IEA norm of 90. Phase II at Chandikhol and Padur will add 6.5 million tonnes.
- Phase II has a concession signed for Padur on 1 October 2025, and a parliamentary committee report of August 2026 records Bina and Bikaner as sites under consideration. India has been an IEA associate member since 2017, and the 90-day rule binds only full members.
- Distribution problems: losses of state power distribution companies, theft and poor finances weaken supply even where generation exists.
- Responses:
- non-fossil capacity crossed 50% of installed capacity in June 2025, five years ahead of the 2030 target, and reached 300.50 GW, over 54% of about 552 GW, on 31 July 2026. Total capacity was about 558.9 GW in September 2026;
- the pledge for 2031–35, submitted on 24 April 2026, is a 47% cut in emissions intensity and 60% non-fossil capacity by 2035;
- ethanol blending reached E20 in 2025;
- more piped gas, LNG terminals and diversified crude sources (Russia, the USA, Guyana, Brazil);
- the solar energy push and the National Green Hydrogen Mission.
The Long-Run Shortage
- The classic picture: demand has outrun supply because of population, industry, cities and transport.
- It showed in repeated outages, announced and unannounced cuts, and unstable voltage, and in plants running below capacity for want of coal and gas.
- Peak shortage ran at about 11–12.5% between 2001 and 2006.
- The Twelfth Plan projected domestic energy output of 669.6 million tonnes of oil equivalent by 2016-17 and 844 million by 2021-22, only about 71% and 69% of need.
- Consumption per head stays low: about 998 kWh in an older count, against 1,378 kWh in China, 1,934 in Brazil, 6,231 in Britain, 7,816 in Japan and 13,066 in the United States.
- It reached about 1,400 kWh in 2023-24 (Central Electricity Authority), so demand will keep climbing with living standards.
- The gap has changed shape: the Ministry of Power reports zero annual energy shortage for 2025-26, against 4.2% in 2013-14. The International Energy Agency reports that short-term shortages more than doubled in January–May 2026 over the same months of 2025.
- The two claims measure different things. Annual energy is now met, while evening peaks remain short, because solar output falls just as demand holds up.
Where the Crisis Falls Within India
- Resources and demand lie apart. Coal is concentrated in Jharkhand, Odisha, Chhattisgarh and West Bengal; hydroelectric power on Himalayan rivers and Western Ghats streams; and wind and solar in the west and south.
- Demand peaks elsewhere: on 21 May 2026 Maharashtra (31.5 GW), Uttar Pradesh (29 GW) and Gujarat (25.9 GW) drew the most.
- Oil and gas enter by the coast. Imported petroleum moves inland through lines such as Salaya-Mathura and Mundra-Panipat from Gujarat and Paradip-Haldia-Barauni in the east, and natural gas through coastal LNG terminals. A Hormuz closure therefore struck quickly at Gujarat’s Morbi ceramics.
- Households feel it unequally. Rural and poor households depend most on firewood, dung and subsidised LPG, and they fall back fastest when prices rise.
Can Efficiency Alone Resolve It?
- What efficiency can do: the conservation drive, led by the Petroleum Conservation Research Association and the Bureau of Energy Efficiency, cuts bills, frees supply, reduces import needs and lowers emissions.
- What it cannot do alone:
- It does not replace imported crude for transport or imported LPG for kitchens, the two fuels that failed first in 2026.
- Demand per head is low and will rise, so savings are soon overtaken.
- It does not store solar power for the evening peak.
- The balance: the country needs more domestic production as well as conservation, along with storage, transmission, reserves and diversified suppliers.
Measures to Overcome the Energy Crisis
Energy Security Measures
- Strategic reserves: stockpiles of crude and products buffer short shocks, for example the US Strategic Petroleum Reserve, Japan’s large reserves and India’s SPRs. Their weakness is high cost and locked-up capital.
- Energy security means continuous energy for the economy at prices comparable with those other countries pay.
- Storage needs huge facilities and blocks capital for long periods. If companies hold the stocks they pass the cost on to consumers, and if the state does, it must tax or borrow more.
- China writes specific energy targets into its five-year plans.
- Diversification:
- of fuels: gas, nuclear, renewables, biofuels;
- of suppliers and routes: new pipelines, LNG terminals, bypass routes;
- of transport modes: LNG shipping instead of fixed pipelines.
- Disruption cannot hit every fuel and every supplier at once, which is the logic behind diversifying. Sweden’s commission of 2005–06, under Göran Persson, set 2020 targets to cut oil use sharply, without ending it.
- Long-term contracts and energy diplomacy: equity oil abroad (ONGC Videsh), partnerships with producers, and bodies such as the IEA, the International Solar Alliance and the Global Biofuels Alliance.
Demand-Side Management and Efficiency
- Energy efficiency is the “first fuel”. Japan’s efficiency drive after the 1970s shocks cut the oil intensity of its economy sharply.
- Dearer energy itself played a large part in Japan’s gains.
- “Negawatts”: power saved through efficiency is treated as a resource that frees supply.
- Tools: appliance standards (India’s BEE star labelling, PAT scheme for industry, UJALA LED programme), smart meters, time-of-day tariffs, public transport and efficient buildings.
Diversification of Energy Sources
- Renewables: solar, wind, hydro, geothermal and biomass reduce import dependence. Their growth needs storage, grids and stable policy.
- Nuclear power: provides stable, low-carbon base load, despite concerns over safety, waste and cost. Small modular reactors are the new frontier.
- Green hydrogen and biofuels: serve hard-to-electrify sectors such as steel, fertiliser, shipping and aviation.
- Cleaner use of coal: supercritical plants, coal gasification and CCUS, which remain costly and limited.
- Other older steps: discourage oil-intensive activities, replace oil with alcohol fuels from sugarcane and other crops, liquefy coal for cheaper long-distance transport, and develop safer and cheaper nuclear, wave, tidal and geothermal technology.
- The long-run path out of recurrent crises is the energy transition to a diversified, low-carbon mix.
Technology, Infrastructure and Policy
- Storage (batteries, pumped hydro), smart grids and inter-regional transmission let more renewables be absorbed.
- Carbon pricing, removal of fossil subsidies and long-term planning give investors stable signals.
- Safety and maintenance of mines, pipelines and grids, including steps against fires and roof collapses in coal mines, reduce accident-driven shortages.
- Better design of urban infrastructure in developing countries lowers long-run demand.
- Funding and technology transfer from developed to developing countries help close the access gap.
Sustainable Consumption
- Each crisis has strengthened green energy and sustainable living movements.
- Ecologist David Pimentel of Cornell University argued that cheap oil allowed human numbers to overshoot the Earth’s carrying capacity. Such views echo the Limits to Growth debate on population, resources and development.
- The balanced view is that efficiency, diversification and lower-carbon lifestyles, not population control alone, can make energy supply secure and sustainable.
Previous Year Questions
2026Efficient use of energy resources can resolve the energy crisis in India. Comment.2020Identify the causes and effects of energy crisis, and suggest suitable measures to solve the problem.2018Keeping the recent developments in view, how can the energy crisis of India be circumvented by harnessing non-conventional energy resources?2017“The intensity of energy crisis varies regionally.” Explain.2008Suggest appropriate energy policy for minimising energy crisis in India.1991Write short note: World energy crisis.1988Discuss the various sources of energy and their uses. Suggest the measures to overcome the present-day energy crisis.





Worth reading it
Thank you sir🙏🗽🏍️🏎️🚜