

- Population growth is the change in the number of people in an area over time. At the world scale it is the outcome of births and deaths alone; at any smaller scale migration also counts.
- World population grew slowly for most of human history, exploded after 1950, and is now slowing towards a peak of about 10.3 billion in the mid-2080s (UN World Population Prospects 2024).
- Growth has always been uneven in space: the regions that grow fastest today (tropical Africa) are not those that led growth in the 19th century (Europe). Growth therefore keeps reshaping the distribution of world population.
Measuring Growth

Components of Growth
- Growth = (births − deaths) + (in-migrants − out-migrants).
- Natural increase is births minus deaths. As rates, it is the crude birth rate (CBR) minus the crude death rate (CDR), per 1000 people.
- Net migration is in-migrants minus out-migrants. It is zero for the world as a whole but decisive for many countries.
- International migrants numbered 304 million in 2024, 3.7% of the world’s people, nearly double the 154 million of 1990 (UN DESA).
- Growth rate (%) = (natural increase + net migration) ÷ population at the start of the period × 100.
- World rates in 2023 (World Bank): CBR 16.3 and CDR 7.6 per 1000, a natural increase of about 0.9% a year.
- Sub-Saharan Africa: CBR 33, CDR 8, so natural increase is about 2.5%.
- Japan: CBR 6, CDR 13. This is natural decrease: deaths outnumber births.
- Negative growth occurs when deaths and emigration exceed births and immigration, as in Japan, Italy and much of Eastern Europe today.
- Each biological component has its own measures: fertility through the CBR and total fertility rate, mortality through the CDR, infant mortality and life expectancy.
Exponential Growth and Doubling Time
- A population growing at a fixed rate grows exponentially: Pt = P0 (1 + r)^t. Each year’s increase is added to the base for the next year.
- Doubling time is the number of years a population takes to double at its present rate.
- A quick approximation is the rule of 70: doubling time ≈ 70 ÷ growth rate (%).
- At 2% a year a population doubles in about 35 years; at the world’s 0.85% (2024), in about 80 years; at Niger’s 3.3%, in about 21 years.
- The world’s own doublings show the acceleration and the recent slowdown:
- 1 → 2 billion took 123 years (1804–1927).
- 2 → 4 billion took 47 years (1927–1974).
- 4 → 8 billion took 48 years (1974–2022).
- A further doubling to 16 billion is not projected at all.
Population Momentum
- Population momentum is the tendency of a population to keep growing after fertility falls to replacement level (about 2.1 children per woman).
- A youthful age structure means that large cohorts are still entering the reproductive ages, so births stay high even when each woman has fewer children.
- It is the main engine of growth today. UN WPP 2024 projects that momentum will supply 79% of world population increase to 2054, about 1.4 billion people.
- The number of women aged 15–49 will keep rising, from about 2.0 billion in 2024 to a peak of about 2.2 billion in the late 2050s.
- It works in reverse too. In 18 countries with long sub-replacement fertility, an old age structure will keep populations falling even if fertility recovers.
Growth of World Population Through History
- The record is usually traced from about 10,000 years ago, when farming and settled life began. Before that, hunter-gatherer numbers changed very slowly.
- Growth since then has come in phases, each opened by a technological revolution: agricultural (about 8000 BCE), industrial (18th century) and medical (20th century).
Phase I: Slow Growth (to about 1650)
- At the start of farming the world held perhaps 5–7 million people.
- Hunting and gathering supported few people.
- Groups were mobile and settlements temporary.
- High birth rates were cancelled by high death rates from hunger, disease, climate and conflict.
- Numbers tended to stay within the carrying capacity of the territory.
- The Agricultural Revolution (domestication of plants and animals) changed the demographic regime.
- A surer food supply lowered mortality a little.
- Settled life removed the need to carry small children from camp to camp. Birth spacing shortened and fertility rose.
- Children became economic assets: farm labour and support in old age. Agriculture and high natality became linked.
- Most people lived in a few river-valley and plain civilisations: Mesopotamia, the Nile, the Indus–Ganga, the Huang He. The Han census of 2 CE counted about 58 million people in China alone.
- Growth was slow and broken by famine, war and plague.
- The population was about 0.23 billion at the start of the Common Era and about 0.5 billion by 1650.
- The Black Death of the 14th century and other epidemics caused absolute declines.
- This is Stage 1 (high stationary) of the demographic transition: high birth and death rates in rough balance.
Phase II: Early Expansion (1650–1950)
- Death rates began to fall while birth rates stayed high, first in north-western Europe.
- Medieval and early modern change prepared the way.
- Trade and towns grew, and demand for goods rose.
- Landowners turned farming into a commercial activity: enclosure, crop rotation and new crops (maize, potato) raised output.
- The Industrial Revolution (18th–19th centuries) added:
- Machine production using fossil fuels, and rising output per head.
- Railways and steamships that moved food to deficit areas, so local famines killed fewer people.
- Medical and sanitary advances: smallpox vaccination (Edward Jenner, 1796), and piped water and sewerage from the late 19th century.
- Early industrial cities were deadly, though.
- Rural–urban migration produced overcrowded slums and cholera and typhoid epidemics.
- Urban mortality fell only once sanitation caught up.
- Population rose from about 0.5 billion (1650) to 1 billion around 1804 and 2.5 billion by 1950.
- Europe’s surplus also spilled into the Americas, Australia and Siberia through mass emigration.
- This corresponds to Stage 2 (early expanding) of the transition in Europe. By the early 20th century Europe had moved into Stage 3, as birth rates followed death rates down.
Phase III: The Population Explosion (1950–present)
- After 1950 growth became the fastest in human history. Population rose from 2.5 billion in 1950 to 8.2 billion in 2024.
- The cause was a sudden fall in death rates in Asia, Africa and Latin America, while birth rates stayed high for another generation:
- Medical revolution: antibiotics, vaccines, DDT against malaria; smallpox was eradicated in 1980.
- Public health: safe water, sanitation, oral rehydration, maternal and child health care.
- Green Revolution: high-yielding seeds, irrigation and fertilisers raised food output. India and Mexico escaped the famines that had been predicted.
- Transport and trade moved food and medicine across the world.
- Europe’s mortality decline took over a century; the developing world’s took a few decades. The gap between births and deaths was therefore wider than Europe ever experienced.
- The world growth rate peaked at about 2.2% a year in 1963. The yearly addition peaked at about 93 million around 1989.
- India (1950–1980) shows the pattern clearly: deaths fell steeply with health programmes while births fell only slowly.
- Why births stayed high for a generation after deaths fell:
- Cultural norms favouring large families and sons.
- The economic value of children in farming economies.
- Low female literacy and autonomy, early marriage.
- Limited access to contraception until family-planning programmes spread.
- Growth is therefore social as much as biological.
- The explosion was spatially uneven. The developed world had its rapid growth in the 18th–19th centuries and then stabilised; the developing world’s came after 1950, on a far larger base, and brought land pressure, urban congestion and unemployment.
- From the 1970s fertility began to fall too, through urbanisation, female education, family planning and state policy (China’s one-child rule from 1980). The world entered the slowing phase of the S-curve.
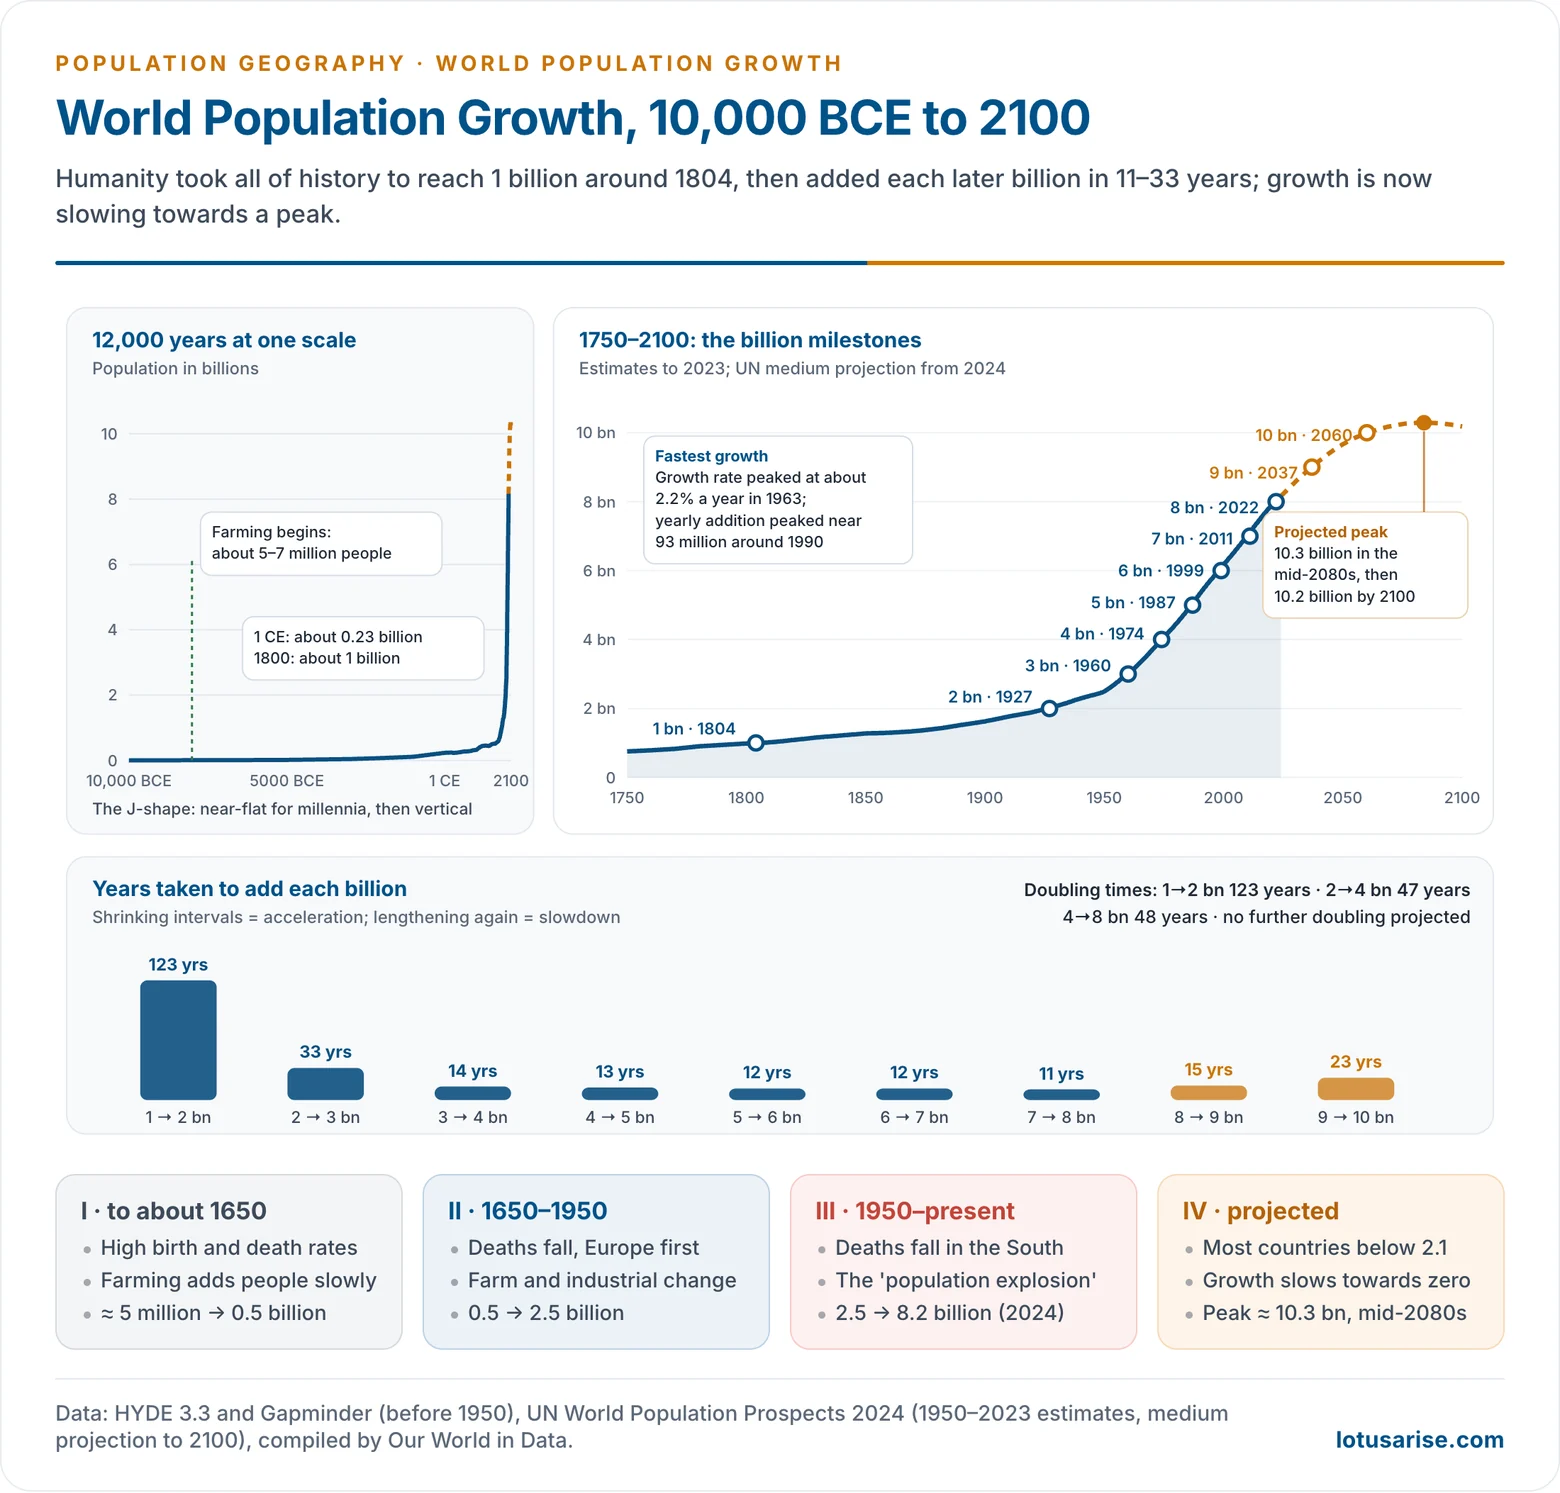
| Milestone | Year | Years taken |
|---|---|---|
| 1 billion | about 1804 | all of history |
| 2 billion | 1927 | 123 |
| 3 billion | 1960 | 33 |
| 4 billion | 1974 | 14 |
| 5 billion | 1987 | 13 |
| 6 billion | 1999 | 12 |
| 7 billion | 2011 | 12 |
| 8 billion | 15 Nov 2022 | 11 |
| 9 billion (projected) | about 2037 | 15 |
| 10 billion (projected) | about 2060 | 23 |
J-Curve and S-Curve Models
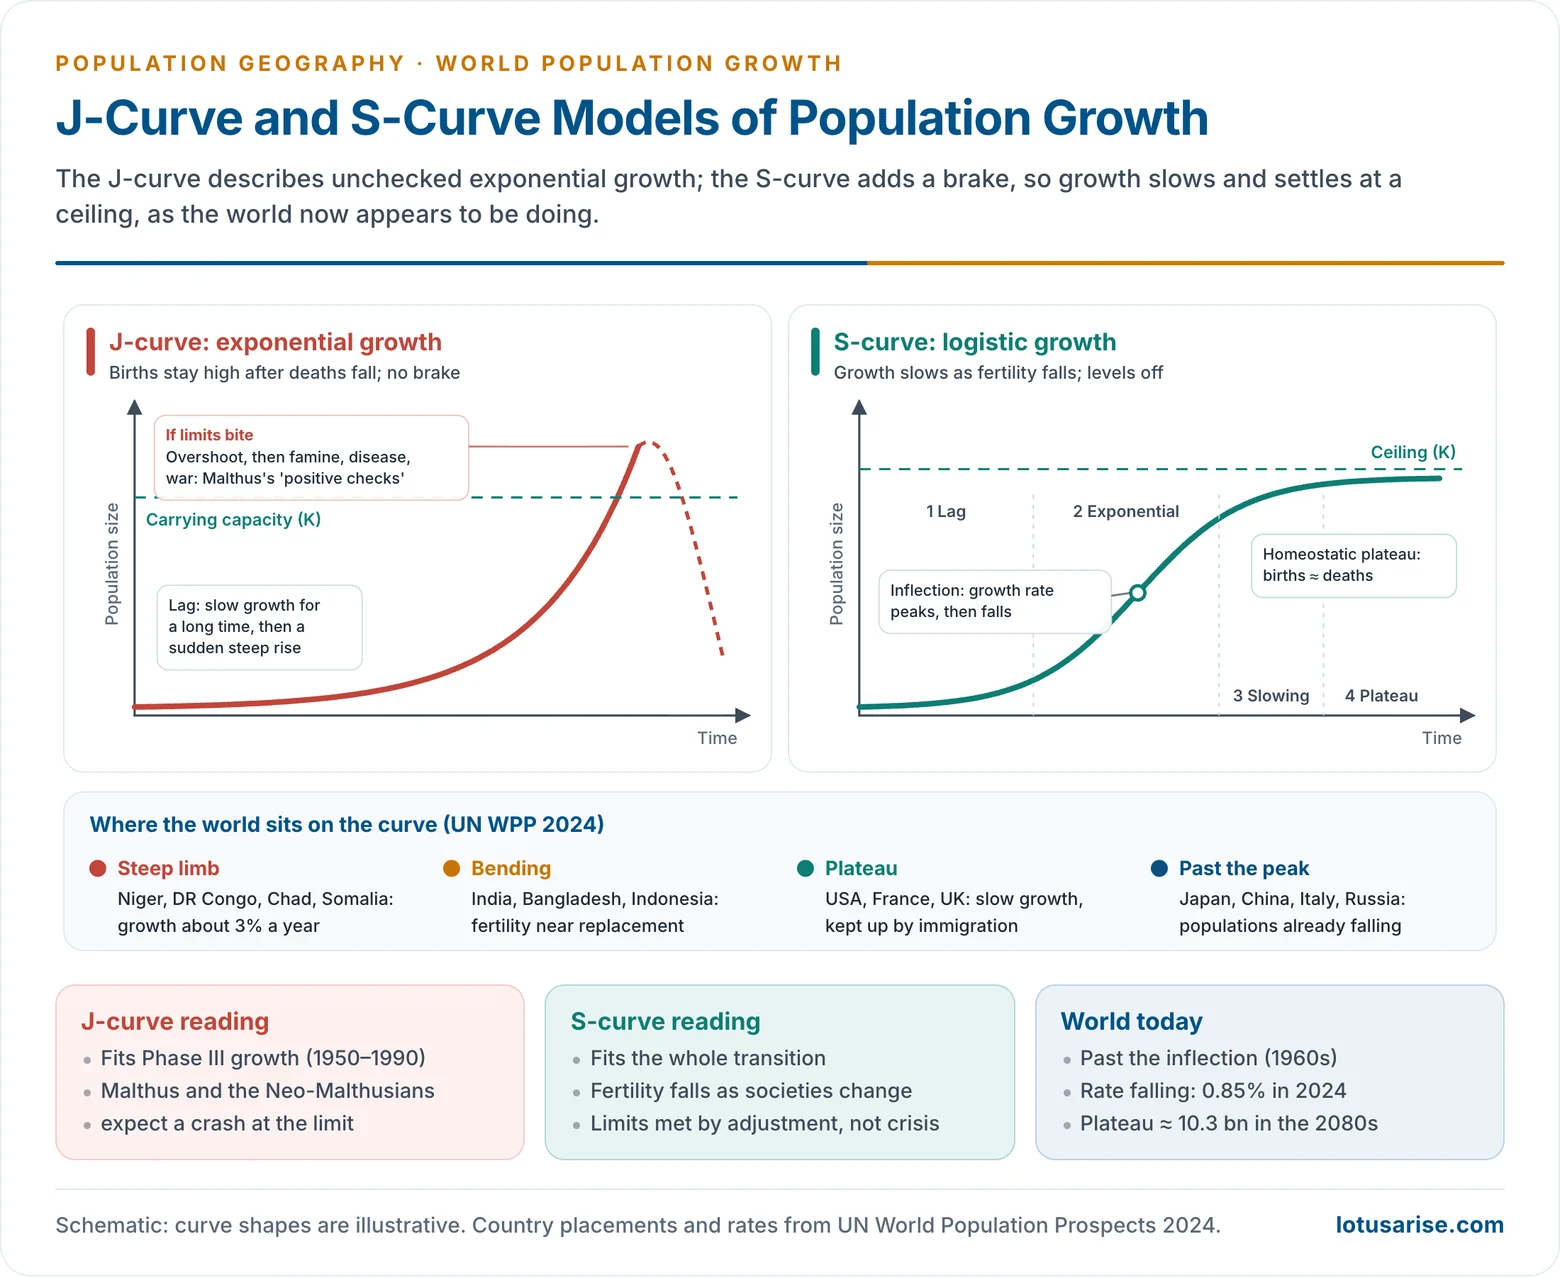
- J-curve (exponential growth):
- Growth is slow for a long time, then rises steeply once deaths fall and births do not.
- It fits Phase III, and today’s high-fertility countries in Sub-Saharan Africa.
- It has no built-in brake. If growth hits the carrying capacity, the population overshoots and crashes through famine, disease and war: the “positive checks” of Malthus.
- S-curve (logistic growth) adds a brake. It has four parts:
- Lag: slow growth under limited technology.
- Exponential rise: growth after mortality falls.
- Slowing: fertility falls as societies urbanise, educate women and stop relying on children for security.
- Plateau (homeostatic equilibrium): births ≈ deaths at a ceiling.
- The two curves imply different futures.
- The J-curve reading underlies the Neo-Malthusian warnings of the 1960s–70s, including Limits to Growth.
- The S-curve treats limits as being met by adjustment (lower fertility, new technology) rather than by catastrophe.
- Technology and population feed each other.
- Growth stimulates innovation, and innovation supports further growth.
- The post-1950 rise can be read as a series of mini S-curves:
- Green Revolution (1950s–70s): more food, especially in Asia.
- Medical revolution (1960s–90s): falling mortality in Latin America and South-East Asia.
- Knowledge and ICT revolution (1990s on): schooling, family planning and small-family norms. South Korea and Thailand fell below replacement fertility within a generation.
- The world now follows the S-curve.
- It passed its inflection in the 1960s, when the growth rate peaked.
- Western Europe and Japan are already on the plateau or past it.
Present Trends and Regional Patterns
The Global Picture (UN WPP 2024)
- World population was 8.2 billion in 2024. It passed 8 billion on 15 November 2022.
- The growth rate has halved since the 1960s, to 0.85% a year. The world still adds about 70 million people a year because the base is so large.
- Mortality: world life expectancy reached 73.3 years in 2024, back above its pre-COVID level and 8.4 years higher than in 1995.
- Fertility: the world total fertility rate fell from 3.3 in 1990 to about 2.3 in 2024. More than half of all countries are now below the replacement level of 2.1.
- Projection: the world population will peak at about 10.3 billion in the mid-2080s and then ease to 10.2 billion by 2100.
- The UN puts the probability that the world population peaks within this century at 80%.
- The 2100 total is now about 700 million lower than the UN projected a decade ago, mainly because fertility fell faster than expected in China and other large countries.
- Three groups of countries (UN WPP 2024):
- 63 countries holding 28% of the world’s people have already peaked, among them China, Germany, Japan and Russia.
- 48 countries (10% of people) will peak between 2025 and 2054: Brazil, Iran, Türkiye, Viet Nam.
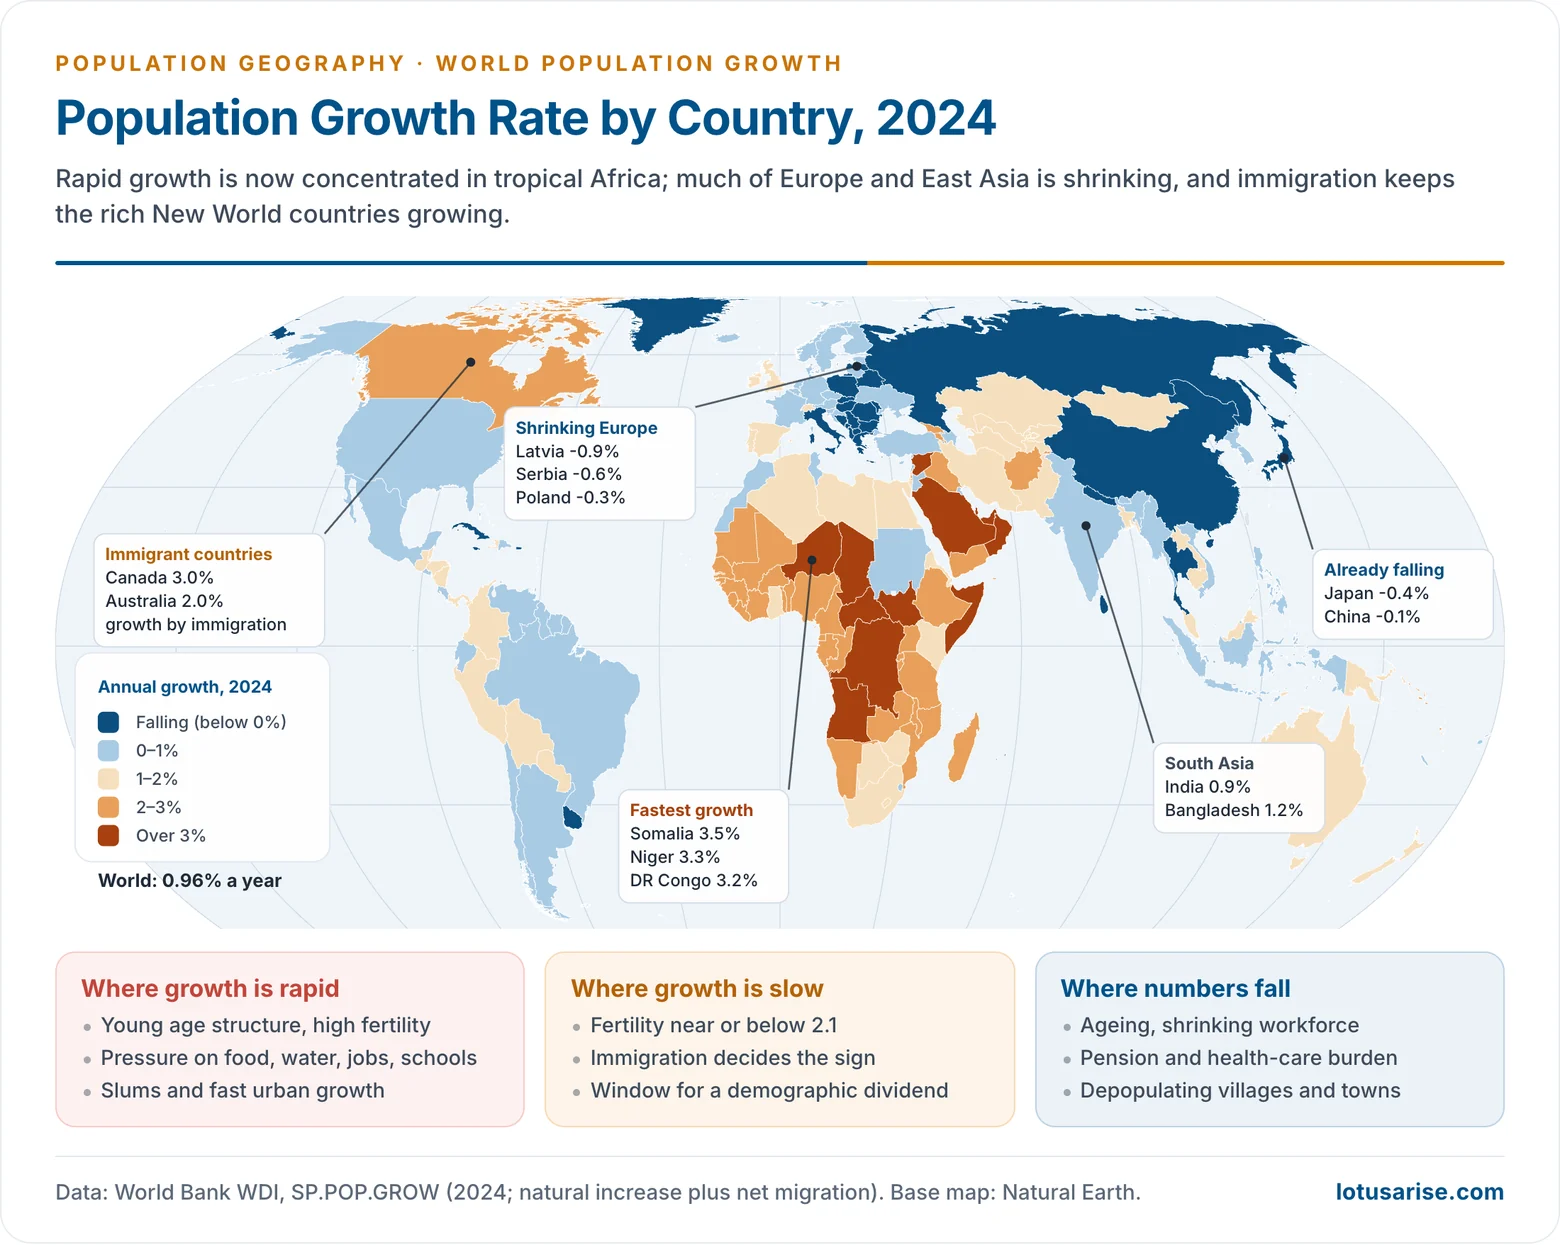
- 126 countries will keep growing past 2054: India, Indonesia, Nigeria, Pakistan and the USA among them.
- In nine of these, including Angola, DR Congo, Niger and Somalia, the population is projected to double between 2024 and 2054.
- India overtook China as the most populous country in April 2023.
- India had about 1.45 billion people in 2024. Population growth in India is projected to continue to a peak of about 1.7 billion in the early 2060s.
- China’s population has been falling since 2022.
- The world has moved from population explosion to divergence: rapid growth in some places, stagnation and ageing in others.
- New concerns have replaced the fear of runaway growth: population ageing, international migration pressures and urban concentration (more than half of humanity is urban).
- Growth has also redistributed humanity:
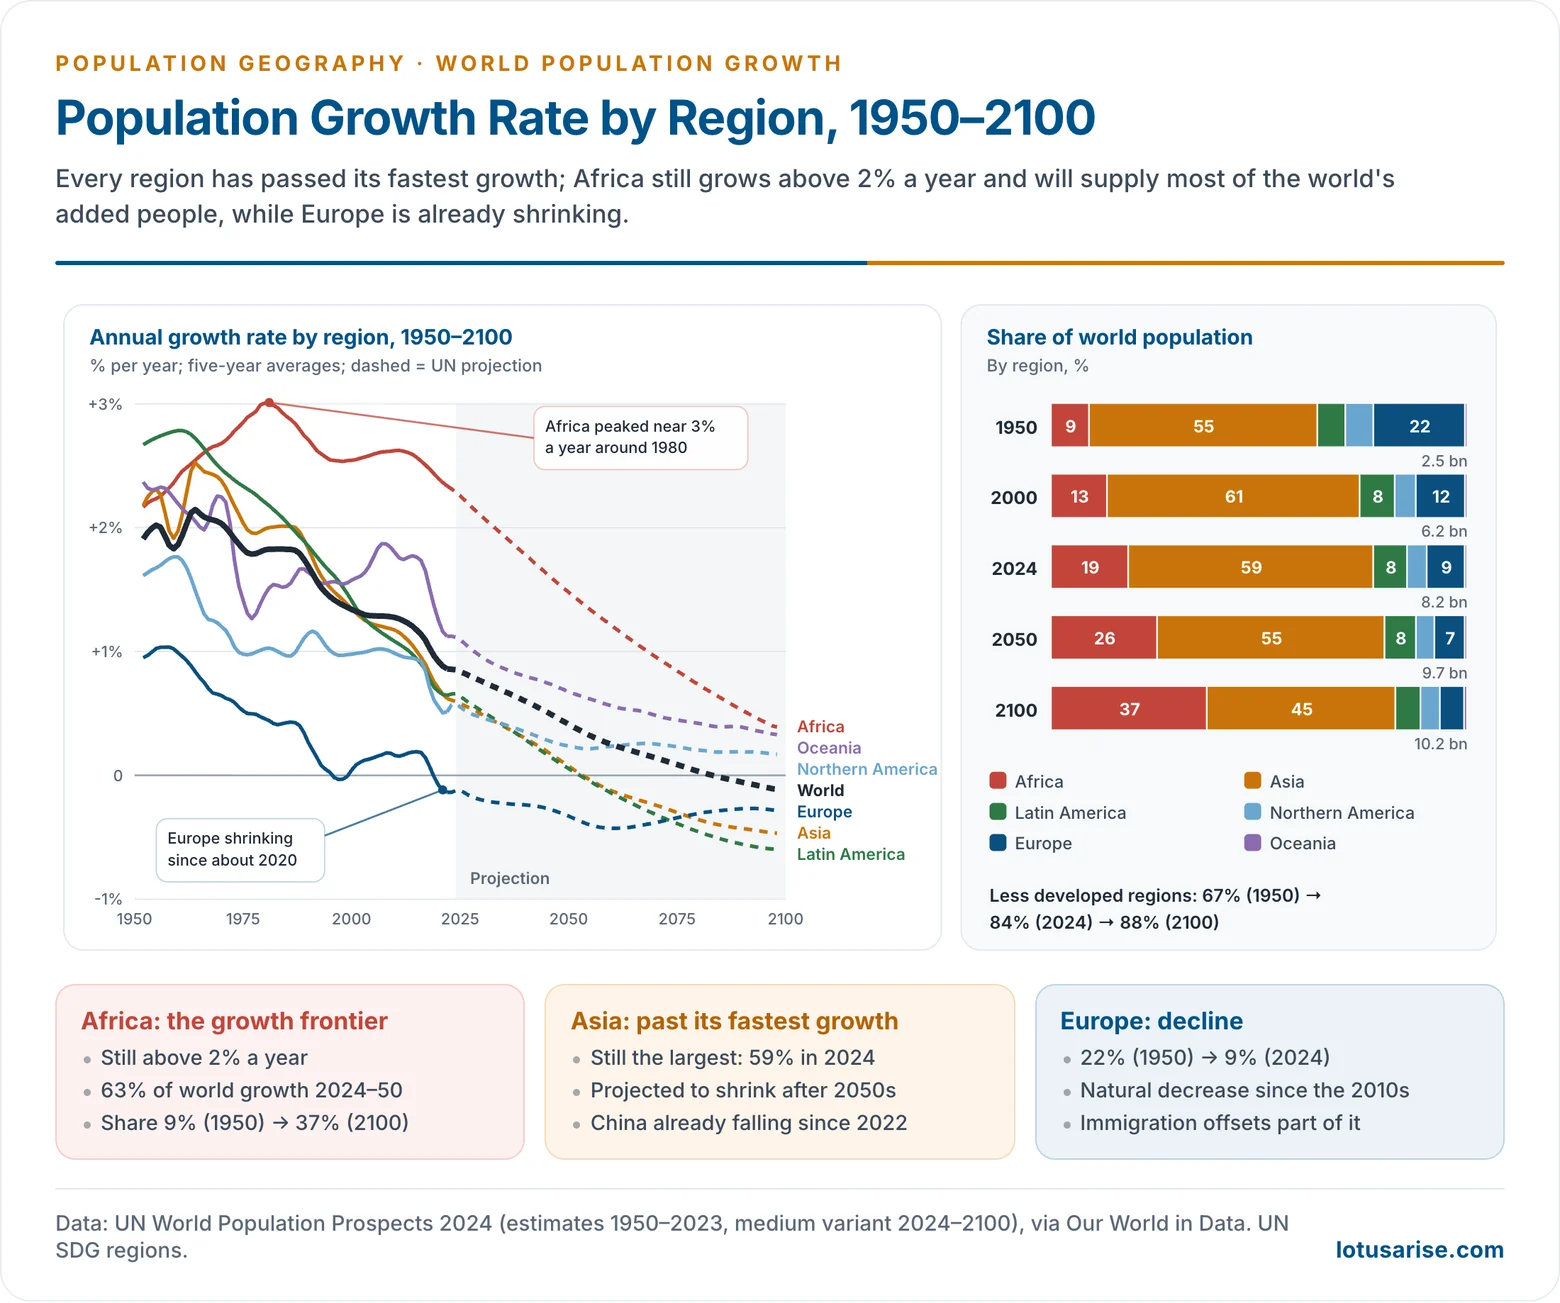
- Asia still holds about 59% of the world’s people, Africa 19%, Europe 9%, Latin America 8%, Northern America 5% and Oceania under 1% (2024).
- The centre of gravity is moving south, towards Africa and South Asia.
Projections and Their Uncertainty
- UN projections are built by the cohort-component method: each age group is carried forward with assumed fertility, mortality and migration.
- They come in variants. The medium variant assumes that high fertility keeps falling and very low fertility recovers slightly; the low and high variants differ by about half a child per woman.
- Small differences in fertility make large differences by 2100, so the end-century total is far less certain than the 2050 total.
- Projections are revised every two years, and recent revisions have lowered the peak and brought it forward.
- Momentum makes the next 25 years fairly certain: most people who will be parents by 2050 are already born.
- Ranking will change. By 2100 the most populous countries are projected to be India (about 1.5 billion), China (about 0.63 billion, less than half today’s), Pakistan, Nigeria and DR Congo, with the USA sixth.
- Age structure will change. By the late 2070s people aged 65 and over are projected to outnumber children under 18.
Regional Differences
- Every region has passed its fastest growth, but at very different times.
- Europe peaked first and has been shrinking since about 2020.
- Asia and Latin America grew fastest in the 1960s–70s and are projected to start shrinking after the 2050s.
- Africa’s growth peaked near 3% a year around 1980 and is still above 2%.
- Africa is the new demographic frontier.
- It will supply about 63% of world population growth between 2024 and 2050.
- Its share of humanity is projected to rise from 9% in 1950 to 19% in 2024 and 37% by 2100.
- The less developed regions held 84% of the world’s people in 2024, up from 67% in 1950. By 2100 they will hold 88%. Europe’s share fell from 22% in 1950 to 9% in 2024.
| Region (World Bank, 2023) | Growth % | Births per woman | Under 15 % | 65+ % |
|---|---|---|---|---|
| Sub-Saharan Africa | 2.5 | 4.3 | 41 | 3 |
| Middle East and North Africa | 2.0 | 3.0 | 33 | 5 |
| South Asia | 0.9 | 2.0 | 25 | 7 |
| Latin America and Caribbean | 0.7 | 1.8 | 23 | 10 |
| North America | 1.0 | 1.6 | 17 | 18 |
| East Asia and Pacific | 0.2 | 1.3 | 19 | 13 |
| Europe and Central Asia | 0.1 | 1.6 | 18 | 18 |
| World | 0.9 | 2.2 | 25 | 10 |
- Sub-Saharan Africa: high fertility, falling child mortality, early marriage and low female schooling. Rapid growth will continue for decades through momentum.
- Middle East and North Africa: moderate fertility, plus very fast immigration-led growth in the Gulf states (Qatar, UAE, Saudi Arabia).
- South Asia: fertility has fallen to or below replacement in India and Bangladesh but is still high in Pakistan and Afghanistan.
- East Asia: some of the lowest fertility on earth (China, Japan, South Korea); populations are already falling.
- Latin America: fertility fell from about 6 in the 1960s to below replacement. Growth is slowing fast.
- North America and Oceania: low fertility, with growth sustained by immigration.
Developed Countries: Slow Growth and Decline
- Developed countries are in Stages 4–5 of the demographic transition.
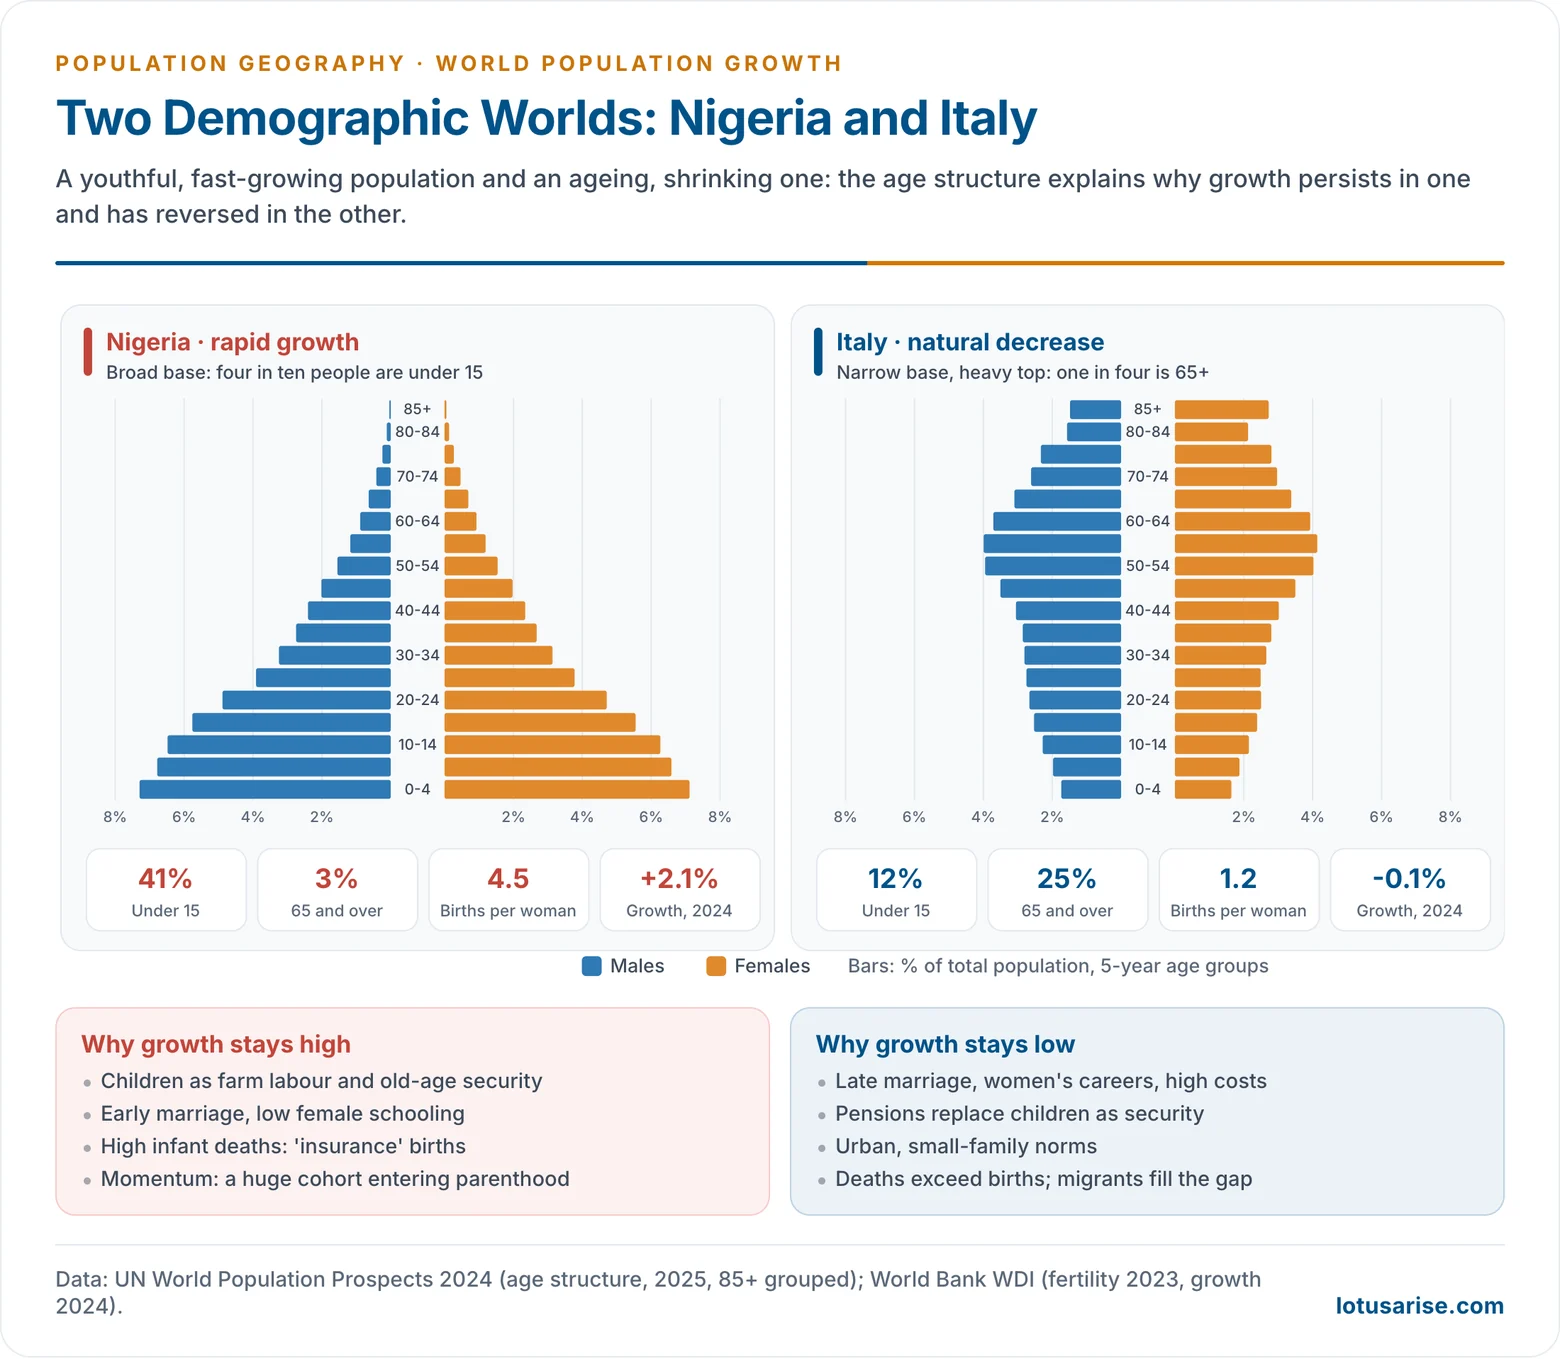
- Fertility has been below replacement for decades: about 1.2 in Italy and Japan, and 0.72 in South Korea (2023), the lowest in the world.
- Deaths exceed births in much of Europe and East Asia. Japan’s population peaked in 2008 at about 128 million.
- Migration is now the main source of any growth.
- They show three patterns:
| Pattern | Examples | Main driver |
|---|---|---|
| Growth kept up by immigration | USA, Canada, Australia, UK, Spain | Fertility near or below 2.1; large net immigration |
| Near-stationary | France, Germany | Low fertility partly offset by family policy and migrants |
| Declining | Japan, Italy, Poland, Hungary, Latvia, Serbia | Very low fertility, ageing, emigration |
- Why fertility is low:
- Family change: nuclear and single-person households, marriage after 30 in much of Western Europe, more divorce and cohabitation.
- Women’s education and careers: childbearing is postponed and fewer children are born.
- Urban costs: housing and schooling make children an economic cost, not an asset.
- Social security: pensions replace children as support in old age.
- A secular, individualist outlook and near-universal contraception.
- Consequences:
- Ageing: nearly 30% of Japan’s people are 65 or over. The pyramid becomes inverted.
- Shrinking workforces, labour shortages in care and manufacturing, and rising dependence on migrant workers.
- Fiscal strain from pensions and health care. School closures and depopulating villages follow.
- Negative momentum: small young cohorts make decline hard to reverse.
- Immigration builds multicultural societies, but also integration problems and anti-immigrant politics, as in France, Germany and the UK.
- Characteristics of these societies: near-universal schooling, high female work participation, service economies, high urbanisation, low poverty and a secular outlook. Together they keep fertility low.
- Responses are mostly pro-natalist:
- Cash and tax incentives: child allowances, tax rebates, birth grants, housing subsidies. Hungary, for example, exempts mothers of four or more children from income tax.
- Work–family balance: paid maternity and paternity leave, job protection, flexible hours.
- Childcare infrastructure: state-funded crèches and pre-schools, as in France and the Nordic countries.
- Legal and social change: equal rights for children born outside marriage, acceptance of cohabitation and single parenthood, support for assisted reproduction (IVF) and adoption.
- Selective immigration to fill labour gaps. Australia ended its “White Australia” restrictions in the 1970s, and Canada runs points-based skilled migration.
- Results of such pro-natalist population policies have been modest, because the causes of low fertility lie deep in social change, and population ageing continues.
Developing Countries: Continued Growth
- Developing countries hold 84% of the world’s people and account for almost all of its future growth.
- Most are in Stages 2–3 of the transition.
- Death rates have fallen with the spread of medicine.
- Birth rates fall more slowly, held up by social and economic factors.
- Features:
- A broad-based pyramid: in Nigeria about 41% of people are under 15, against 12% in Italy.
- A large and growing reproductive-age population, which carries momentum.
- A working-age bulge: a demographic dividend if jobs are created, unemployment and unrest if not.
- Growth rate and absolute growth differ. Even where rates fall, absolute additions stay large because of the size of the base.
- India grows at under 1% a year but will add about 230 million people by 2050, more than any other country.
- Nigeria, Pakistan and DR Congo will each add over 100 million.
- Four growth patterns (UN WPP 2024 rates):
| Pattern | Growth rate | Examples | Features |
|---|---|---|---|
| Explosive | Over 3% | Niger, DR Congo, Chad, Somalia, Angola | Fertility above 5; doubling in about 20–25 years |
| Rapid | 2–3% | Nigeria, Ethiopia, Uganda | Mortality falling faster than fertility |
| Moderate | 1–2% | Pakistan, Egypt, Bangladesh | Fertility falling but above replacement |
| Slow or negative | Under 1% | India, Indonesia, Brazil, Mexico; China and Thailand falling | Fertility at or below replacement; momentum only |
- The epicentre of growth has shifted: Europe grew fastest during its Industrial Revolution; since 1950 the developing world has led, and now Africa and South Asia supply most of the increase.
- Case studies:
- India: TFR 1.9 in 2024 (Sample Registration System; NFHS-6, 2023–24, records 2.0), below replacement, yet growth continues through momentum.
- China: the one-child policy (1980–2015) cut fertility early. Ageing and a shrinking workforce followed, and the policy was relaxed to two (2016) and three children (2021).
- Iran: fertility fell from over 6 in the early 1980s to about 2 by 2000, through female schooling and family planning.
Explaining Growth: Theories in Brief
- Thomas Robert Malthus (1798): population grows geometrically, food arithmetically. In Malthusian theory, “positive checks” (famine, disease, war) and “preventive checks” (late marriage, restraint) keep the two in balance.
- Karl Marx: there is no universal law of population. In the Marxian theory of population growth, “surplus population” is a product of capitalism, not of nature.
- Demographic transition theory: growth is a temporary stage between two equilibria (high birth and death rates, then low ones). It is the framework most used to explain the world pattern.
- Optimum population: growth is good up to the size that maximises output per head and harmful beyond it.
Factors Behind Present Growth
- Economic factors:
- Poverty: there is an inverse relationship between income and fertility.
- Adam Smith (1776) observed that poverty does not prevent large families, though it makes rearing children hard.
- High child deaths among the poor lead to “insurance” births.
- Subsistence, labour-intensive farming: wet-rice and plantation agriculture need many hands, and children add labour at little cost.
- No social security: children are the old-age pension.
- Poverty: there is an inverse relationship between income and fertility.
- Social factors:
- Religion can promote or restrain fertility, depending on how it is mobilised.
- Doctrines that oppose contraception, or value large families, slow the fertility decline.
- Thailand, by contrast, enlisted Buddhist monks to bless contraceptives in its family-planning drive.
- Iran shows that religious authority can endorse family planning.
- Traditional values: early and child marriage, son preference, the joint family, low female literacy and few jobs for women all raise fertility.
- Religion can promote or restrain fertility, depending on how it is mobilised.
- Demographic factors:
- High infant mortality in parts of Africa leads couples to have more children.
- A large fertile-age population, as in India and China, keeps numbers growing.
- Environmental factors:
- Tropical disease burdens (malaria, diarrhoeal disease) raise child mortality and so keep fertility high.
- Disasters set back development and the social changes that lower fertility.
- Political and administrative factors:
- Strong programmes lowered fertility in China, Thailand, Indonesia, Bangladesh and Iran.
- Pro-natalist policies attempt the reverse in Europe and East Asia.
- Wars, partition and refugee flows redistribute growth: Partition of 1947, Syria after 2011, Ukraine after 2022.
- HIV/AIDS in the 1990s–2000s sharply raised mortality and cut growth in countries such as Botswana.
Population Growth and Its Problems
Growth and Food
- Food output has outpaced population since 1960, through the Green Revolution, irrigation and trade. The Malthusian famine forecasts of the 1960s did not come true at world scale.
- Ester Boserup (1965) argued that population pressure itself drives agricultural intensification.
- Hunger persists through poverty, conflict and unequal access, not absolute shortage.
- About 8.2% of the world’s people (roughly 673 million) faced hunger in 2024 (FAO, State of Food Security and Nutrition in the World 2025).
- Hunger is concentrated in Sub-Saharan Africa and conflict zones. “Hidden hunger” (micronutrient deficiency) is wider still.
- Future pressure falls where growth is fastest: Africa’s population is projected to grow by over 60% between 2024 and 2050, under a changing climate.
Problems of Rapid Growth
- Pressure on resources: food, water, land and energy.
- High dependency: a large child population absorbs income in schooling, health and housing.
- Unemployment and poverty: a fast-growing labour force outruns job creation. Informal work and social unrest follow.
- Rapid urbanisation and slums, with strain on housing, transport and sanitation.
- Environmental degradation: deforestation, soil erosion and over-use of groundwater.
- Social stress: poor health and education, child labour and trafficking, crime, and political instability where young, jobless populations grow fastest.
- Whether such pressures amount to over-population depends on resources and technology as much as on numbers.
- Rapid growth in the poorest countries and ageing in the richest are the two faces of today’s population problems.
Previous Year Questions
1991Trace and account for the various trends of population growth in the world during the present century.1996Write short note: Growth of population and food resources of the world.2020Provide an account of world population transition in the context of fertility decline and socio-economic development.2025“The global demographic landscape is evolving with rapid population growth in some places and rapid ageing in others.” Elucidate with examples.





 History Optional PYQ Master Pack: Topic-wise Model Answers (1985–2025) by LotusArise IAS
 History Optional Mains Master Kit 2027 Complete Self-Study System — Notes, Mapping & Premium Articles by LotusArise IAS
thank you so much for this wonderful notes . no other coaching institutes have given this kind of comprehensive notes . definitely a game changer
thanku very much again from bottom of my heart
Very helpful for mains preparation. I’m indebted to you.
Thanks team.
I have bought pdf notes but they are not opening
Please contact here: @LotusArise.com">support@LotusArise.com
Very helpful n well organized thnku very much!
Sir in J-curve and S-curve I can’t be able to understand the difference between the two because both are same curve
The J curve is the present situation(2000s). The population growth graph looks like a ” j ” curve.
The S curve is the population graph which includes future prediction(2100) ie flat lining and stabilizing of the population growth which makes the graph looks like a ” S ”
Adoption of babies in encouraged. E.g. Thailand is the biggest child market for developed countries. Norway and Sweden adapt maximum babies.
The info about Thailand part seems very questionable. please fact check this