

- Demographic transition theory explains how a population moves from high birth and death rates to low birth and death rates as a society changes from rural, agrarian and illiterate to urban, industrial and literate.
- Its central claim is one of sequence: the death rate falls first and the birth rate follows later. The gap between them produces a surge of population that ends when the two rates meet again at a low level.
- The sequence is also called the demographic cycle. The theory was developed between 1929 and 1947 by Warren S. Thompson, Adolphe Landry, Frank W. Notestein, Kingsley Davis and C. P. Blacker.
- Unlike the Malthusian and Marxian theories, it is less a theory of crisis or exploitation than a historical generalisation about development and population. India is now in late Stage III, moving into Stage IV.
The Theory

Meaning
- Demographic transition is the shift from a regime of high fertility and mortality to one of low fertility and mortality.
- It holds that population growth is not constant. It changes with public health, literacy, urbanisation, industrialisation and the status of women.
- It studies birth and death rates, natural increase, fertility decline, mortality decline, age structure and the social change behind them.
- Three hypotheses sit at its core:
- The decline in mortality comes before the decline in fertility.
- Fertility eventually falls to match mortality.
- Socio-economic transformation proceeds together with demographic transformation.
Origin and Development
| Scholar | Year | Contribution |
|---|---|---|
| Warren S. Thompson | 1929 | Sorted countries of 1908–27 into three groups by their birth and death rates |
| Adolphe Landry | 1934 | La Révolution démographique: primitive, intermediate and contemporary regimes; foresaw below-replacement fertility |
| Frank W. Notestein | 1945 | Linked the decline to modernisation; high growth potential, transitional growth, incipient decline |
| Kingsley Davis | 1945 | “The World Demographic Transition” gave the term its wide currency |
| C. P. Blacker | 1947 | Five stages: high stationary, early expanding, late expanding, low stationary, declining |
- The theory rested on the experience of Europe, North America and Australia, where mortality and fertility declined gradually alongside industrialisation.
- Why countries differ at any one time: Glenn Thomas Trewartha (1969) pointed to the dual nature of humans. Biologically people are the same everywhere, but culturally they differ, and this gives varying fertility patterns.
- It is an empirical generalisation, not a universal law, and later work has tried to supply the explanation it lacks.
- It also shaped policy. By the late 1940s Notestein and Davis were urging family planning for countries that had not yet begun the decline (Simon Szreter, 1993). The debate peaked at the Bucharest World Population Conference (1974), where India’s Karan Singh declared that “development is the best contraceptive”.
Assumptions
- Economic development changes demographic behaviour.
- Mortality decline generally precedes fertility decline.
- Better medicine, sanitation and nutrition reduce death rates.
- Industrialisation, urbanisation and literacy reduce birth rates.
- Fertility eventually falls to match low mortality.
- Countries may stand at different stages at the same time.
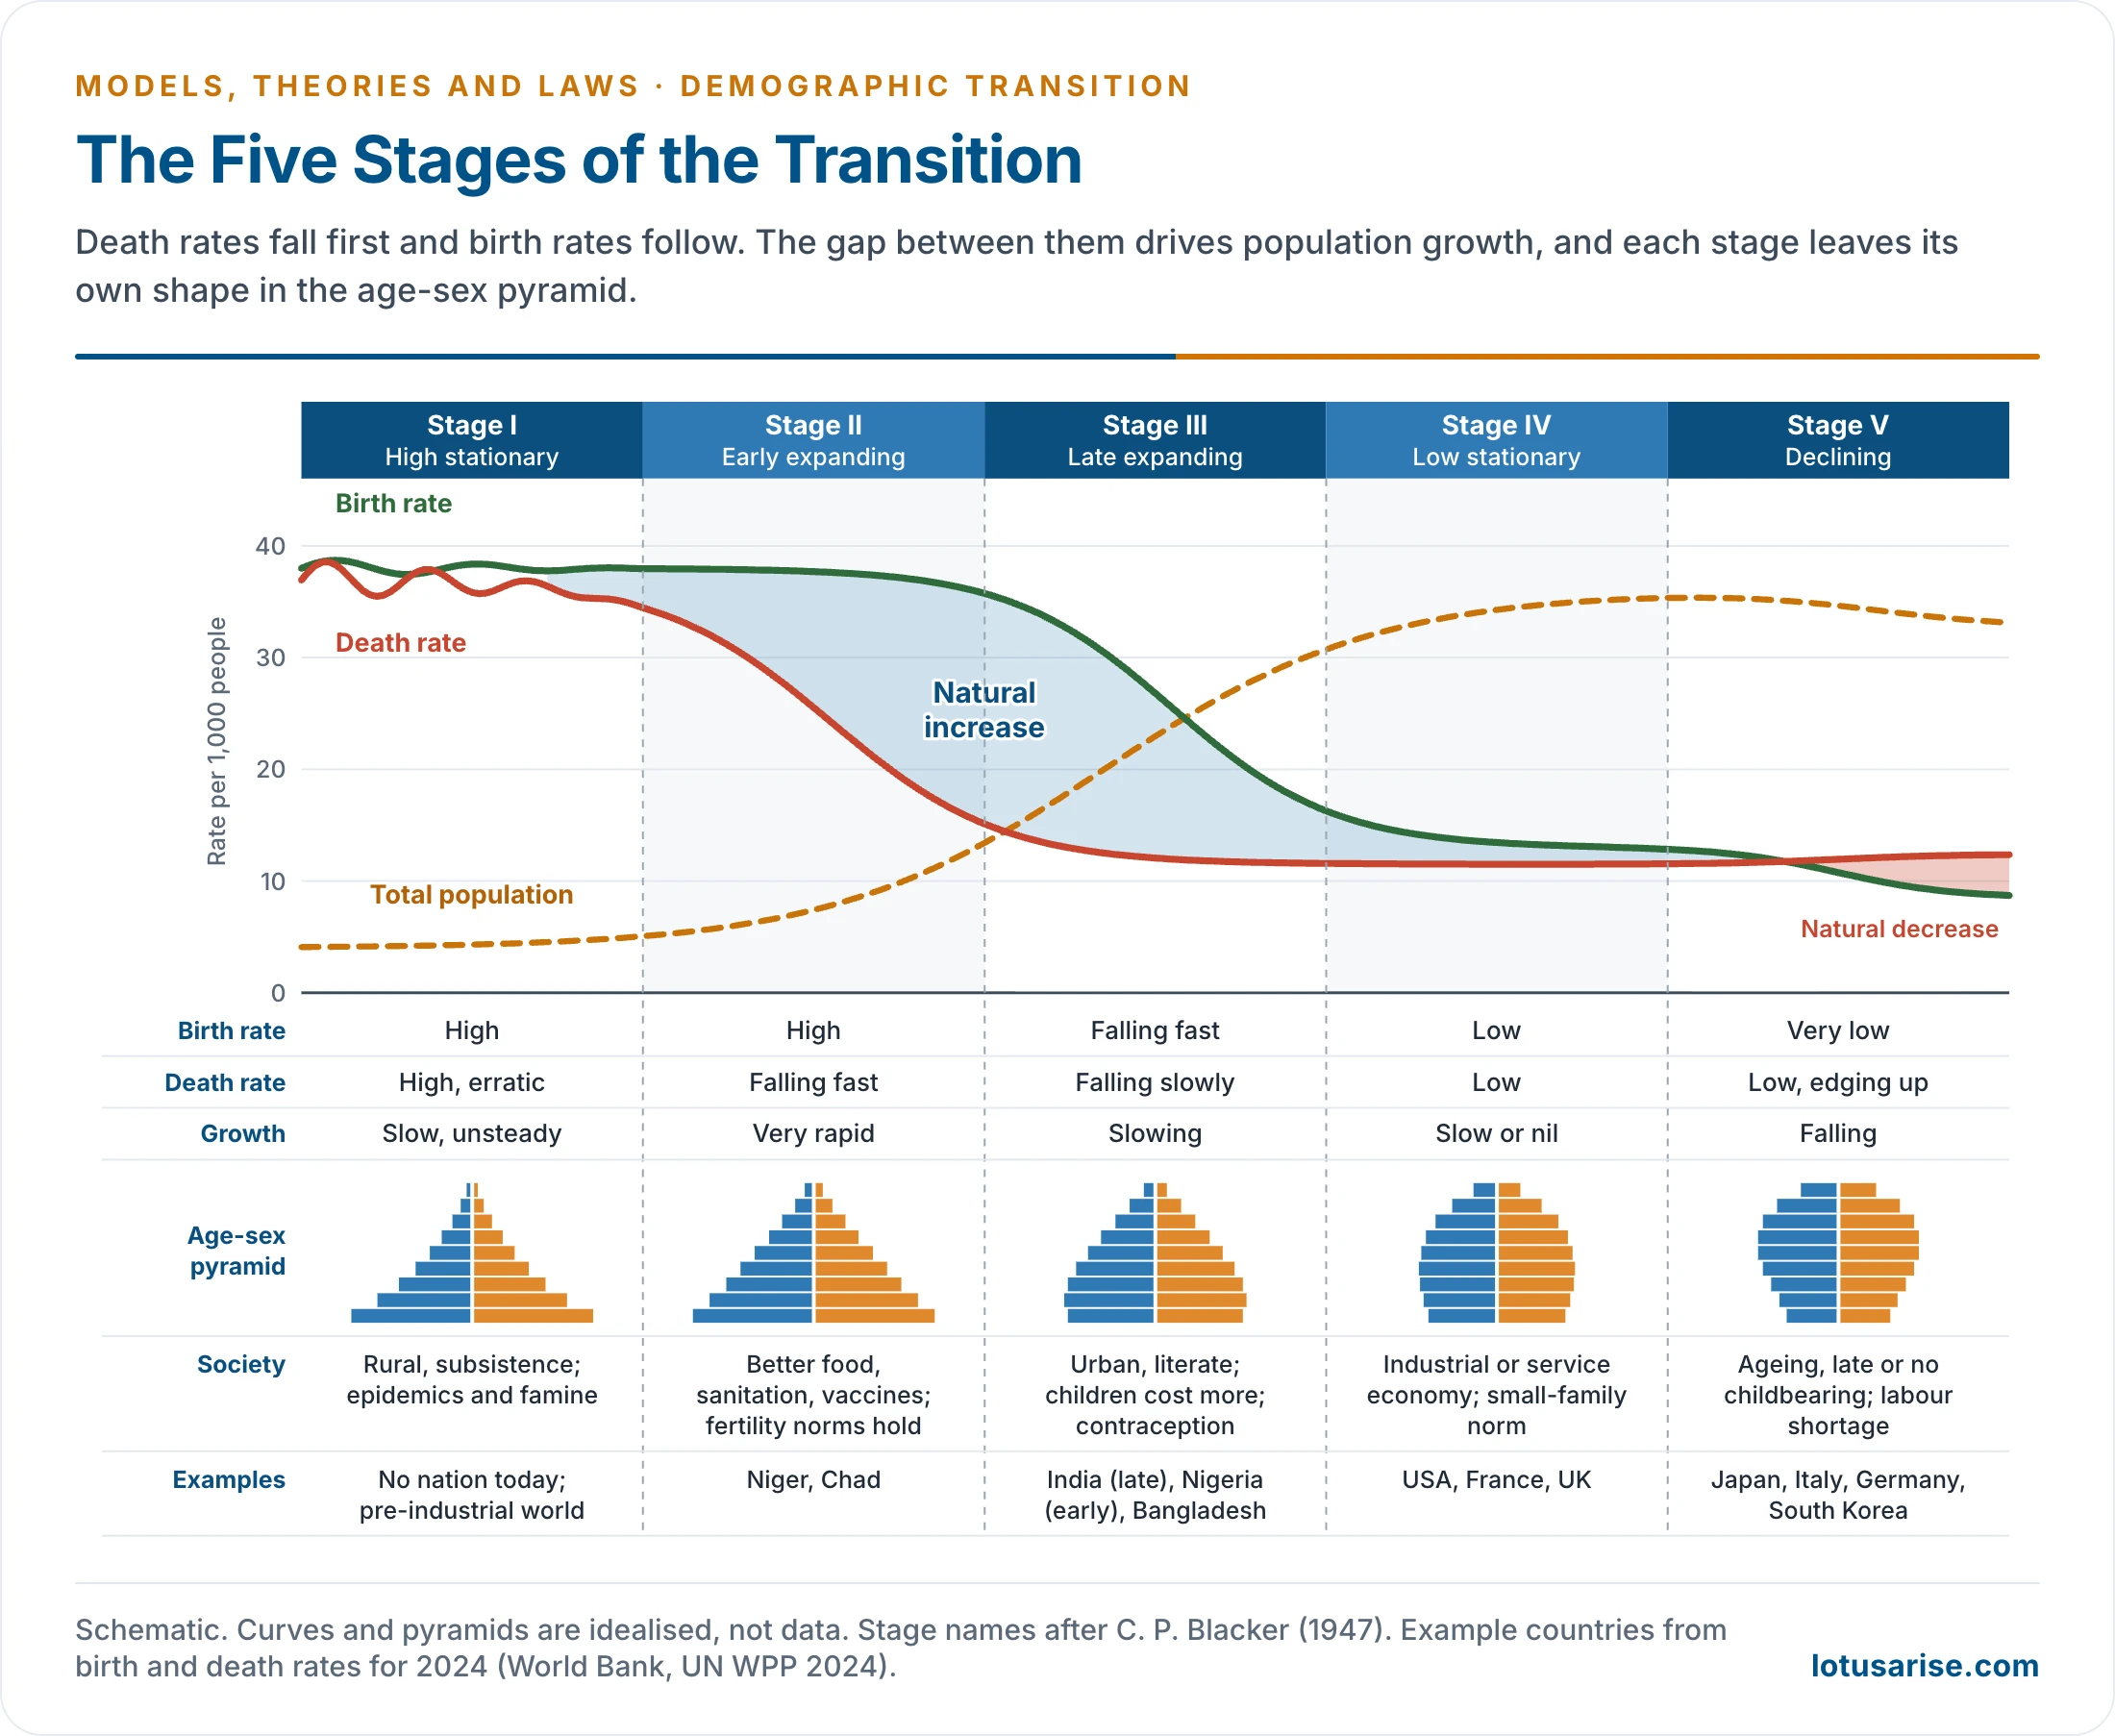
The Five Stages
| Stage | Birth rate | Death rate | Natural increase | Economy | India |
|---|---|---|---|---|---|
| I High stationary | Above 35 | Above 35, erratic | Near zero | Subsistence farming | To 1921 |
| II Early expanding | Above 30 | Falling to about 15 | Highest | Farming, early modern health | 1921–81 |
| III Late expanding | Falling sharply | Low, falling slowly | Narrowing | Urban-industrial shift | 1981–2011 |
| IV Low stationary | Low, near deaths | Low | Very small | Industrial and service | Since about 2011, in part |
| V Declining | Below deaths | Low, edging up with age | Negative | Post-industrial, ageing | Not yet |
Stage I: High Stationary
- Rates: birth and death rates are both high, generally above 35 per 1,000. Deaths fluctuate with epidemics and harvests, so population grows slowly and unevenly, and sometimes falls.
- Society: rural and agrarian, with subsistence farming, poor medicine and sanitation, weak transport, low food security and low literacy.
- Demographic features: high infant mortality, low life expectancy, a large number of children and very few elderly people. A broad-based pyramid narrows quickly with age.
- Why births are high: children are farm labour and old-age security, and many die young. Religion, early marriage, illiteracy and the absence of contraception also favour large families.
- Why growth is low: not because people restrict fertility but because mortality is very high. Human control over death is weak.
- Examples: almost the whole world two centuries ago, and India up to 1921. No nation is in this stage today, since modern medicine has reached everywhere and reliable data for the most remote groups are lacking.
Stage II: Early Expanding
- Rates: the birth rate stays high, generally above 30, and the death rate falls fast towards 15. This is the first major change in the transition and is often called the stage of population explosion.
- Why deaths fall: vaccination, control of epidemics, clean water, sanitation, better nutrition, food transport and fewer famine deaths. Infant and child mortality fall most.
- Why births stay high: social attitudes change slowly. Tradition, son preference, need for farm labour, low female education and little access to family planning persist, and families take time to respond to better child survival.
- Outcome: maximum natural increase, with a very young population, rising life expectancy, high child dependency and a rapidly widening pyramid.
- Pressure on land, water, schooling and jobs is greatest here, and out-migration begins to rise.
- A key distinction: late in this stage, fertility begins to fall slowly while mortality is still falling sharply.
- Examples:
- Niger and Chad today, with birth rates above 40 and death rates near 10.
- India from 1921 to about 1981, and much of Asia and Latin America in the twentieth century.
- The lesson: explosion is not caused by high births alone. It comes from high births combined with falling deaths.
Stage III: Late Expanding
- Rates: the death rate is already low and the birth rate falls significantly. Population still grows, but more slowly, as the gap narrows.
- Why births fall:
- In the city, children become costly in education, health and housing, and are less useful as workers.
- Female education, later marriage and access to contraception spread a small-family norm.
- Lower infant mortality means parents need fewer births.
- Parents shift from the quantity of children to the quality of each child.
- Outcome: life expectancy keeps rising, the working-age share grows and child dependency falls, which opens the possibility of a demographic dividend. The chain runs from falling fertility to fewer children, a larger working-age share and economic potential.
- Examples: India (late), Bangladesh, and Nigeria at the early end.
- Why it matters for India: it explains how fertility can be below replacement while population still grows.
Stage IV: Low Stationary
- Rates: both rates are low, and growth is slow, nil or sustained by migration. Fertility is near or below replacement.
- Society: urban, literate, with advanced health care, high women’s employment, a high cost of living and strong preference for small families.
- Concerns shift from too many people to ageing, social security and labour supply. Development thus changes the meaning of the population problem: dependency, pension burden and regional imbalance replace the fear of numbers.
- Differences remain within this stage. Immigration and policy keep some countries growing, while others are on the edge of decline.
- Examples: the United States, France and the United Kingdom have birth rates of about 10 and death rates of 9–10. Kerala and Tamil Nadu come close among Indian States.
Stage V: Declining
- Rates: the birth rate falls below the death rate, so natural decrease sets in. Blacker named this stage in 1947, although the classic four-stage model has no such stage.
- Causes: late or no marriage, postponed childbearing, housing and child costs, career pressure, individualism and unequal gender roles.
- Features: a shrinking working-age population, labour shortage and pressure on pension and health systems.
- Examples: Japan (birth rate 5.7, death rate 13.3 in 2024), Italy, Germany, South Korea and China.
- Policy responses: childcare, paid parental leave, tax benefits, immigration, later retirement, automation, and pension and elder-care reform.
- The lesson: transition may not end in a stable balance. It may end in ageing and decline, and Landry had foreseen this. The question moves from fertility control to labour scarcity and social security.
Real Curves
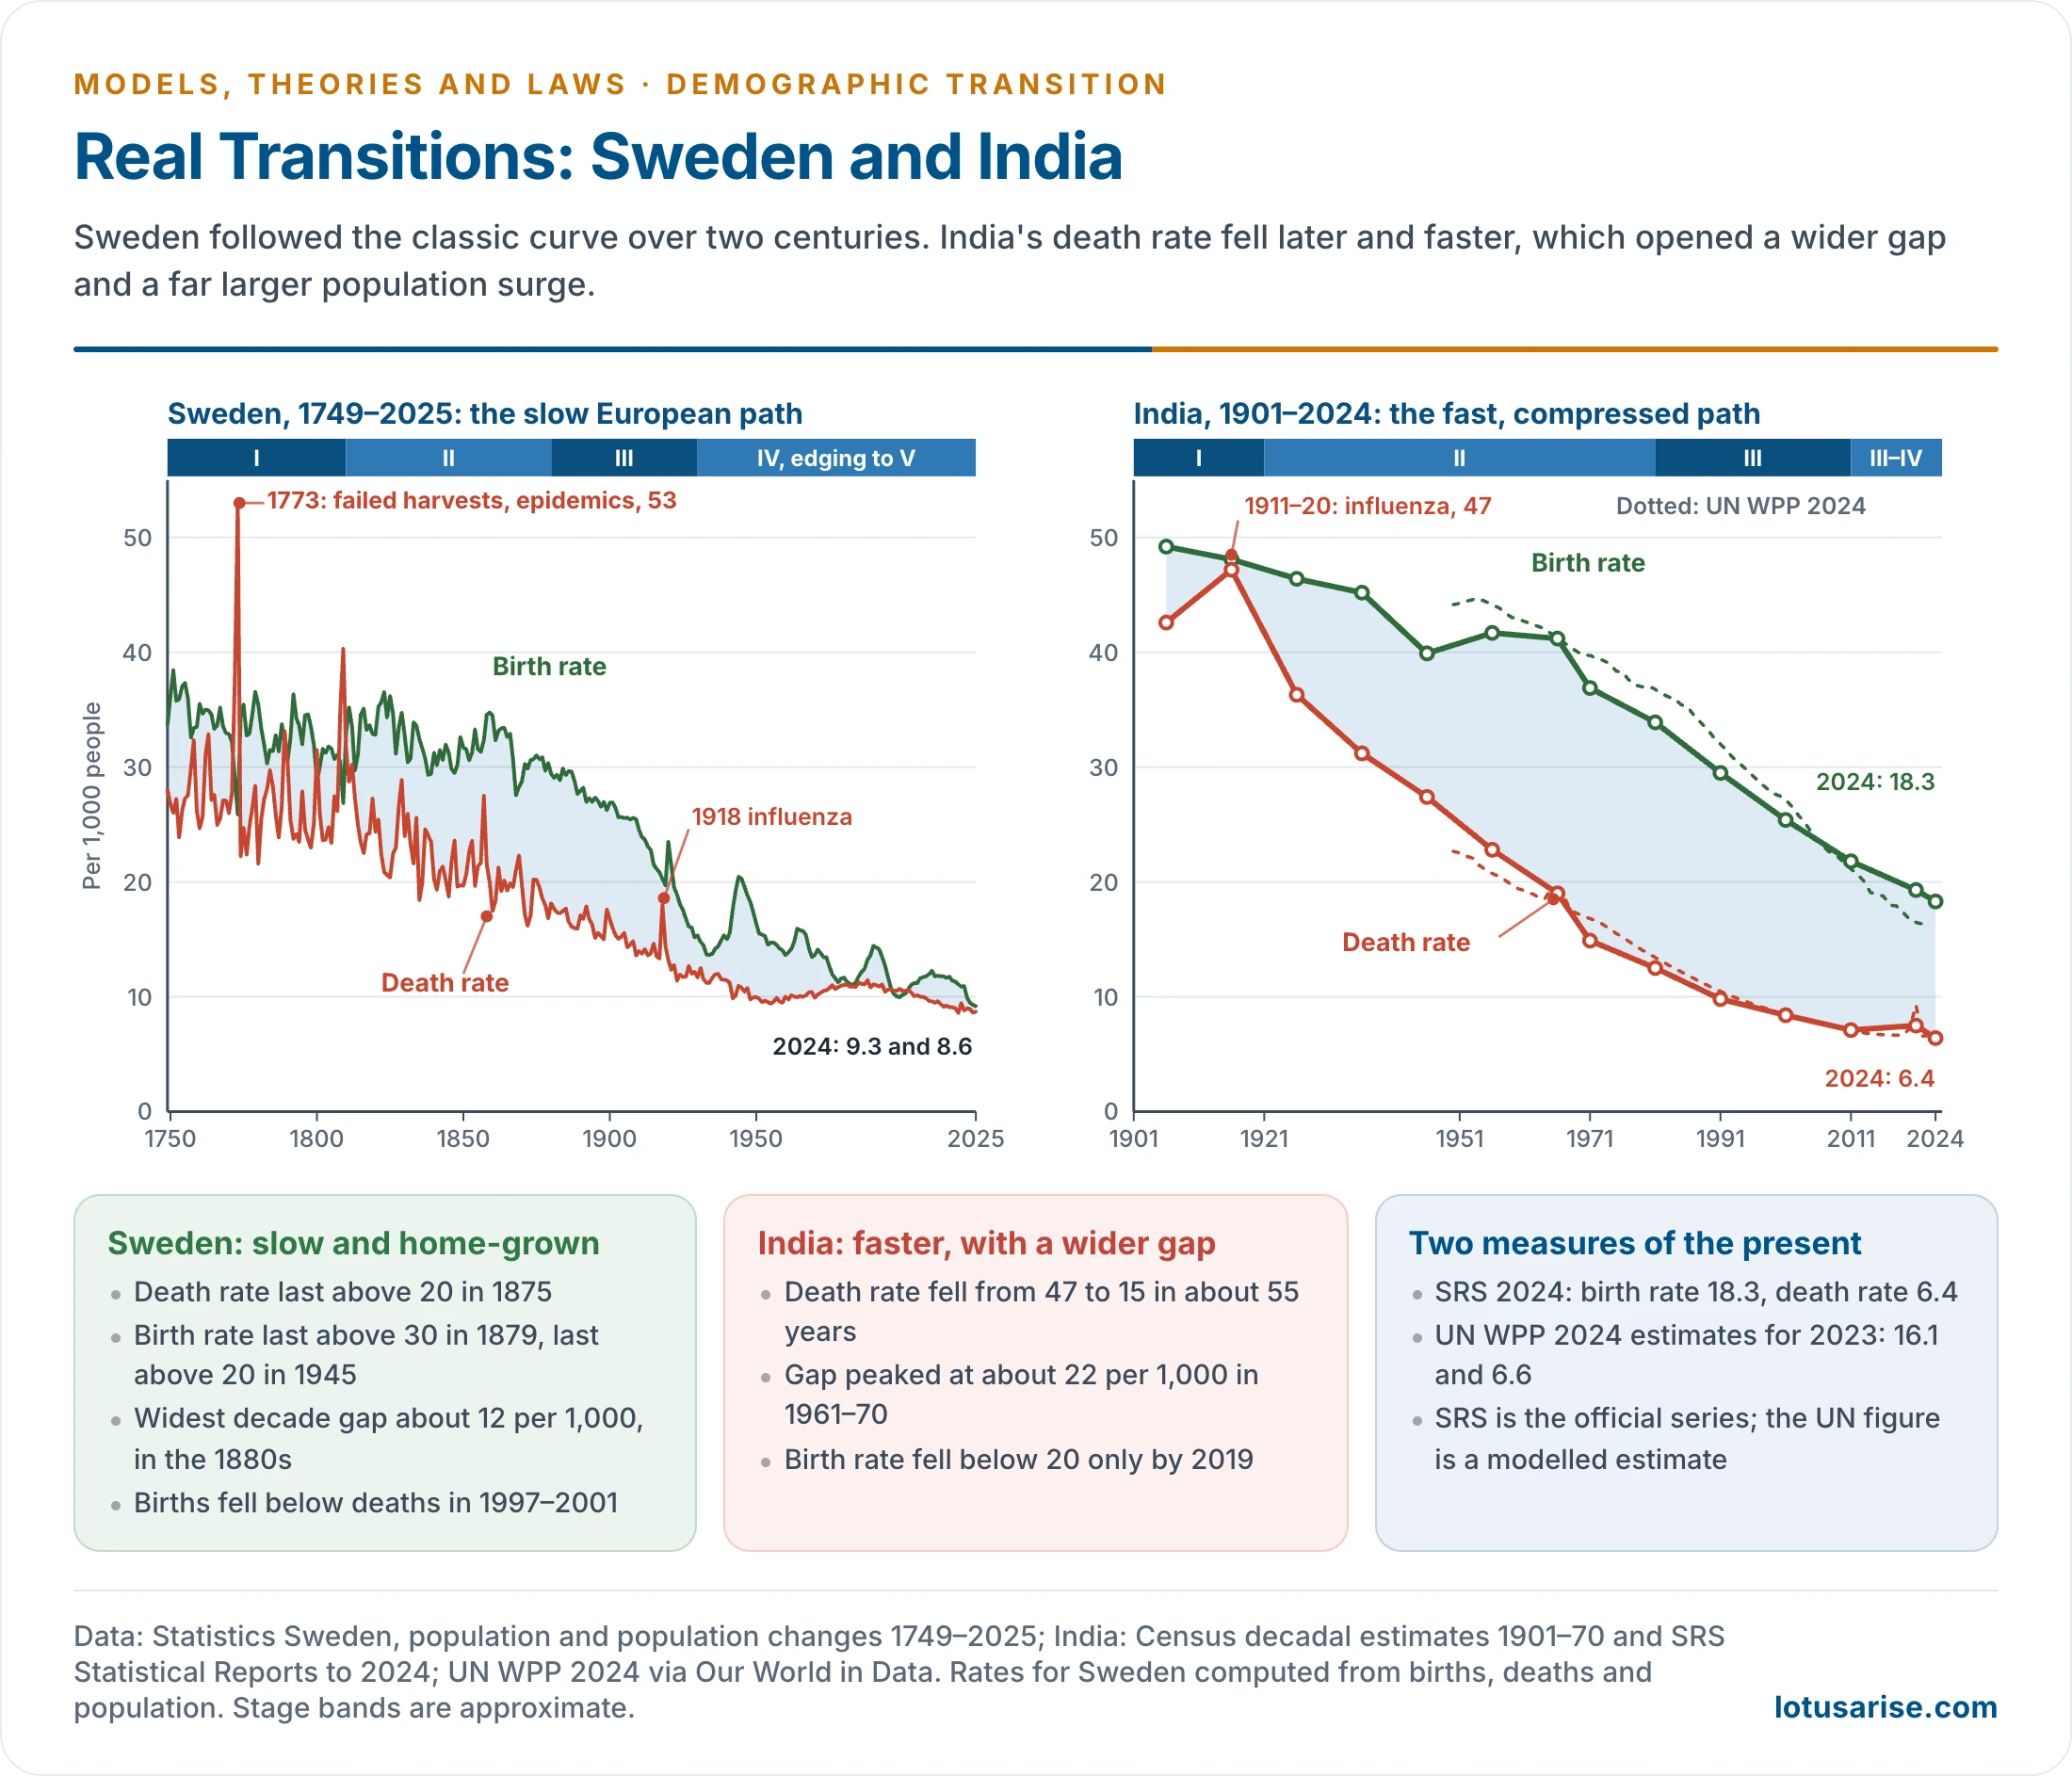
- Sweden has official records from 1749 and shows the slow European path.
- Its death rate was last above 20 in 1875, and its birth rate last above 20 in 1945. The widest gap, in the 1880s, averaged only about 12 per 1,000.
- India shows the compressed path of a late starter.
- The death rate fell from about 47 (1911–20) to 15 (1971), driven by public health more than by income. The gap peaked at about 22 per 1,000 in 1961–70, nearly twice Sweden’s.
| Aspect | Classic Western path (Sweden) | Late-starter path (India) |
|---|---|---|
| Death rate decline | Gradual, over more than a century | Rapid, after 1921 |
| Main driver of mortality fall | Food, sanitation, rising income | Imported medicine, public health, state programmes |
| Widest gap | About 12 per 1,000 | About 22 per 1,000 |
| Fertility decline | Before mass contraception; later marriage first | State family planning; sterilisation; schooling |
| Income at onset | Industrialising | Largely agrarian and poor |
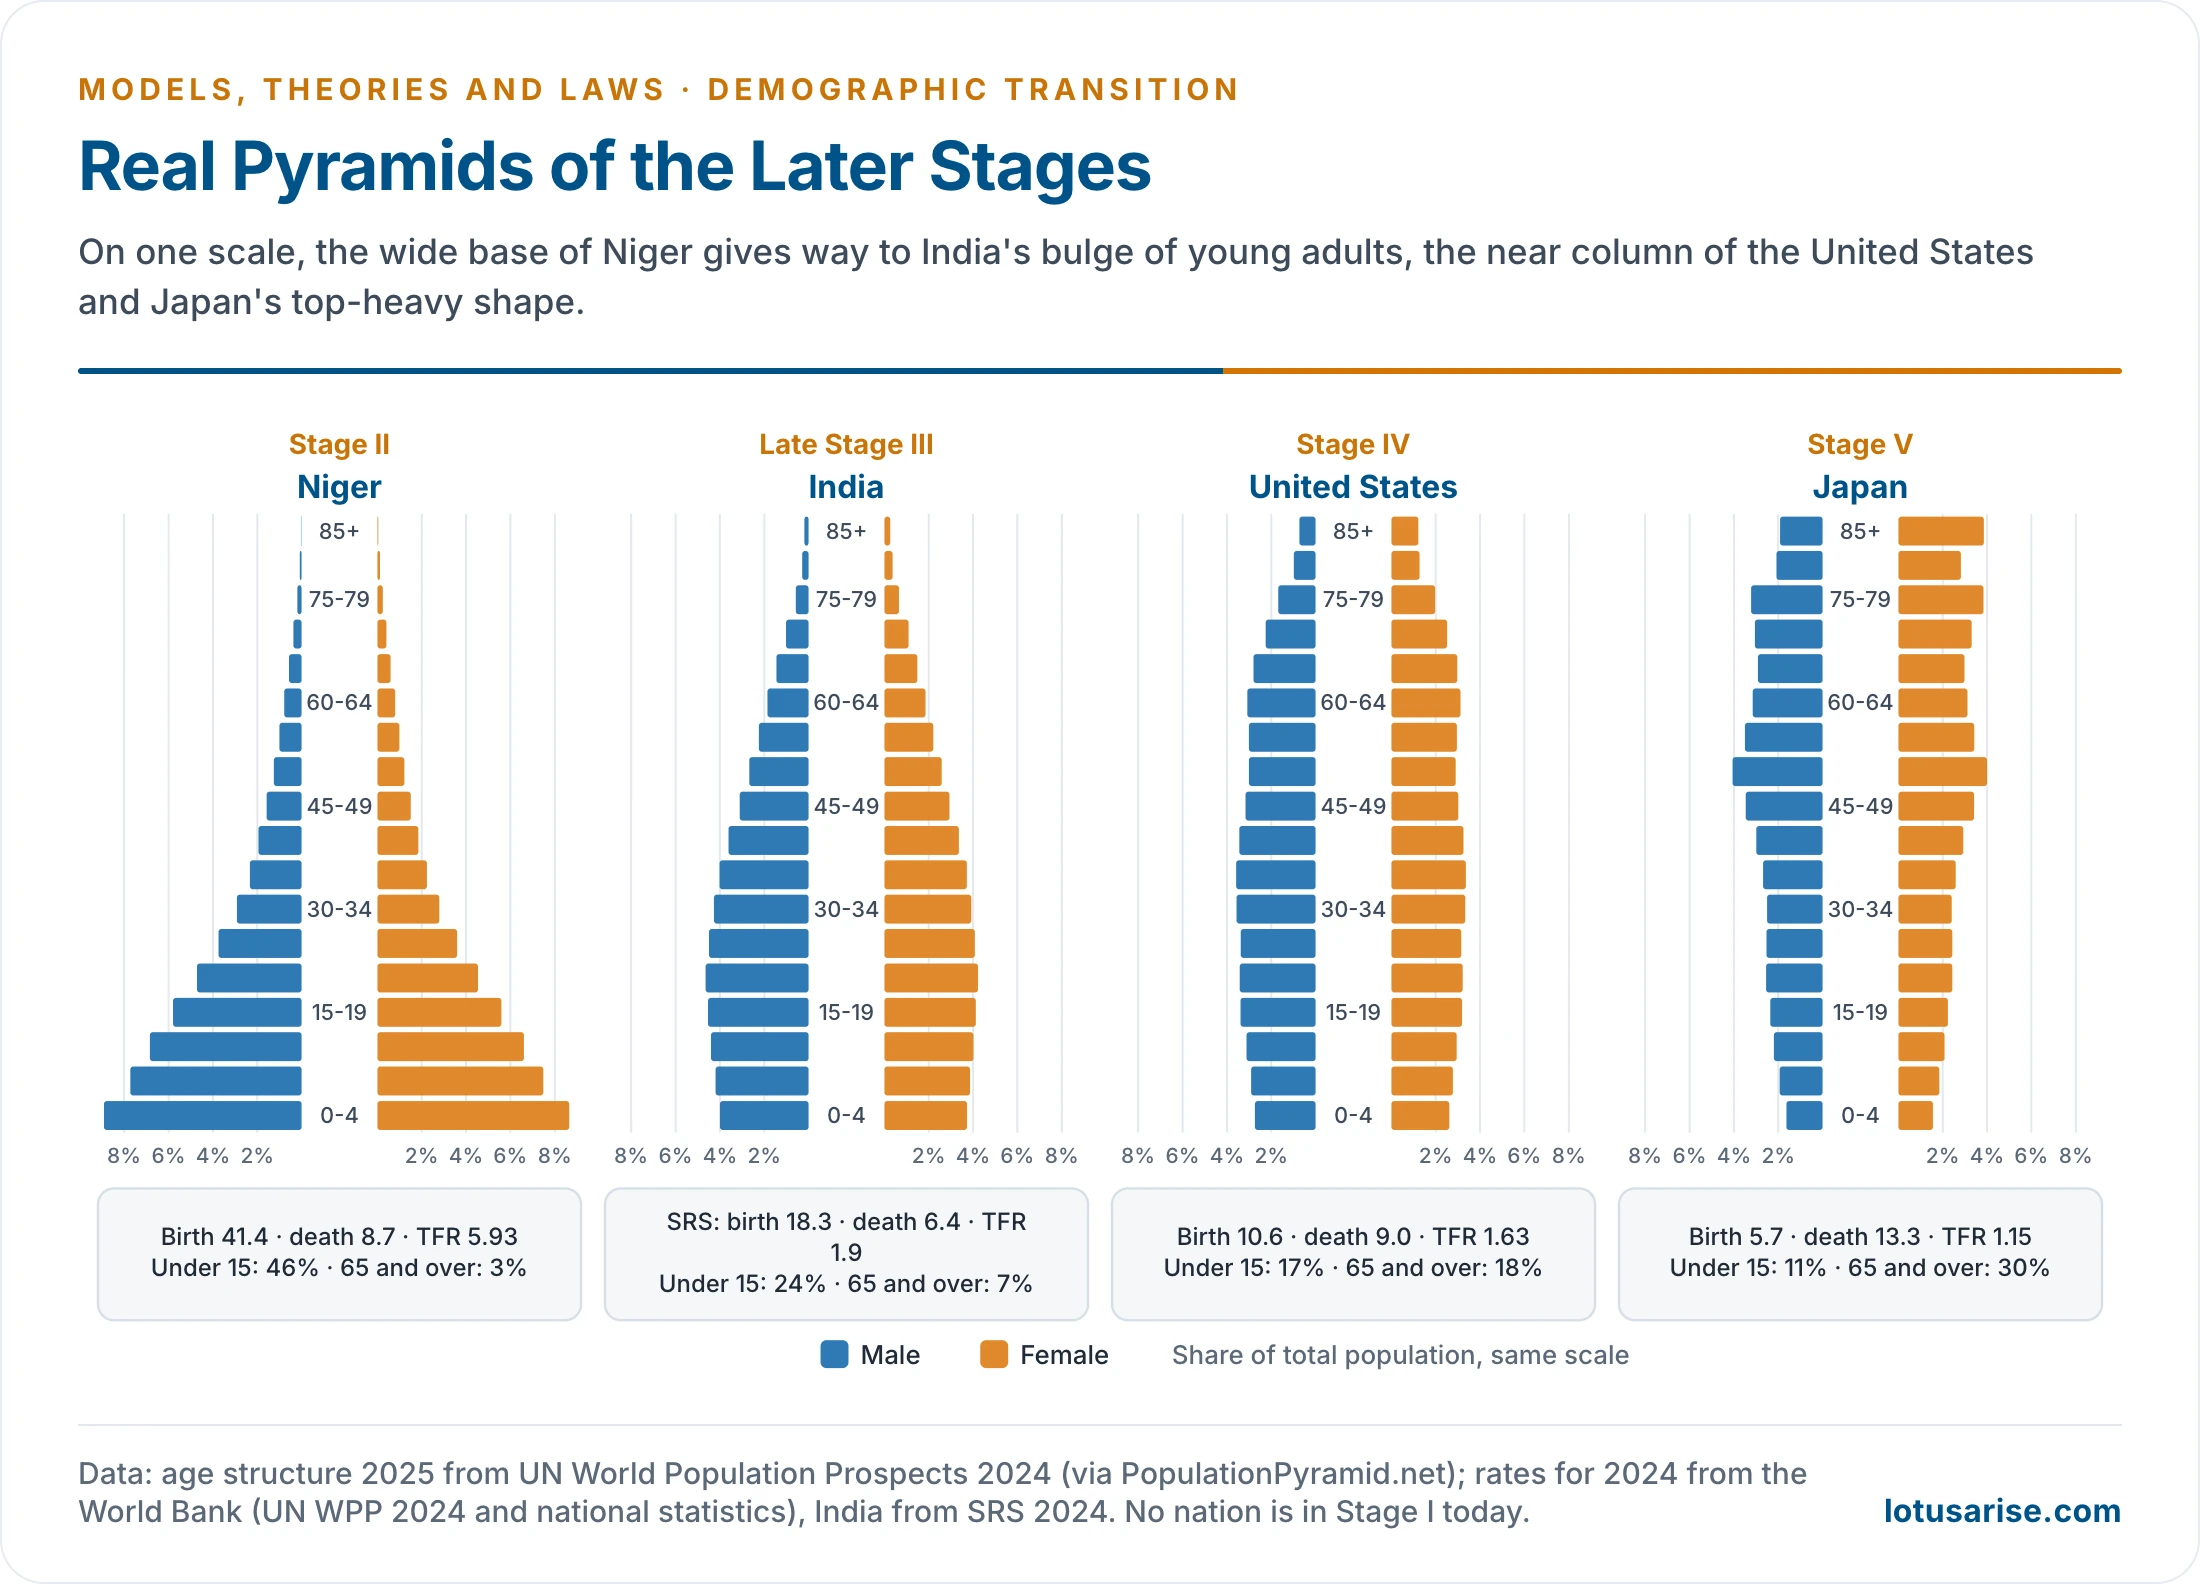
Population Pyramids
- The age-sex pyramid is a compact summary of a population’s stage. Its shape records past fertility and mortality.
| Stage | Shape | Meaning |
|---|---|---|
| I | Broad base, narrow concave top | Many births, few survivors to old age |
| II | Very broad base, widening | More children survive; high child dependency |
| III | Base begins to narrow, middle swells | Falling births; working-age bulge |
| IV | Nearly a column | Low births and long life; ageing begins |
| V | Narrow base, wide middle and top | Very low fertility; rising old-age dependency |
- On real numbers, 46% of Niger’s people are under 15 and 3% are 65 or over; the figures for Japan are 11% and 30%. India stands between, with 24% and 7%. The detail of these shapes belongs to age composition.
Why Fertility Falls
- The original theory described the decline better than it explained it. Later work filled the gap:
- Gary Becker (1960): as income rises, parents trade the quantity of children for their quality.
- Ansley Coale (1973): three preconditions, often called ready, willing and able. Fertility must be a matter of conscious choice, smaller families must seem advantageous, and effective means must be known and available.
- John Caldwell (1976): fertility falls when wealth flows within the family reverse, from children to parents becoming parents to children.
- The Princeton European Fertility Project (Coale and Susan Cotts Watkins, 1986): fertility decline in Europe did not track any simple level of development. Language and culture often mattered, which pointed to the diffusion of ideas.
- Kingsley Davis (1963): households respond to falling mortality and rising aspirations in several ways at once, through later marriage, birth control and migration. Economic change is thus only one route.
- Why deaths fall first: survival is wanted everywhere and can be delivered from outside by health systems, whereas lower fertility requires people to change their own norms. That is why a lag opens, and why it can be long.
- Mortality decline has its own framework in the epidemiological transition of Abdel Omran (1971).
India’s Transition
Where India Stands
| Indicator | 1971 (SRS) | 2024 (SRS) | NFHS-6 (2023–24) | UN WPP 2024 |
|---|---|---|---|---|
| Crude birth rate | 36.9 | 18.3 | – | 16.1 (2023) |
| Crude death rate | 14.9 | 6.4 | – | 6.6 (2023) |
| Total fertility rate | 5.2 | 1.9 | 2.0 | 2.0 (2024) |
| Infant mortality rate | 129 | 24 | – | – |
- The data: the SRS Statistical Report 2024, published in May 2026, is the latest official series, and it is the source for the State figures here. NFHS-6 and the UN give close but not identical values.
- Fertility: it reached replacement in 2019 and has been below 2.1 since 2020. Rural TFR is 2.1 and urban 1.5.
- Mortality: the death rate has stopped falling, because an ageing population offsets better survival. It rose to 7.5 in 2021 during the pandemic.
- Natural growth is 11.9 per 1,000, so India is in late Stage III, moving to Stage IV.
- Census 2027 will give the first full count since 2011. Houselisting ran from April to September 2026, snow-bound areas were enumerated in September 2026, and the rest of India follows in February 2027, with reference date 1 March 2027.
- The growth of India’s numbers through these stages is traced in population growth in India.
- Causes of the decline:
- Mortality fell through medicine, vaccination, food security, public health and sanitation.
- Fertility fell through education, urbanisation, contraception, later marriage and new aspirations. Female sterilisation after the desired family size has been the main method.
Parameters of India’s Transition
| Parameter | What it shows | India, latest |
|---|---|---|
| Birth and death rates | Position on the curve | 18.3 and 6.4 (SRS 2024) |
| Natural growth rate | Size of the gap | 11.9 per 1,000 (SRS 2024) |
| Total fertility rate | Fertility free of age structure | 1.9 (SRS 2024) |
| Infant and under-five mortality | Child survival | 24 and 28 (SRS 2024) |
| Life expectancy | Overall mortality | About 72 years (UN WPP 2024) |
| Age structure | Stage reached | Median age about 28; 60+ share 9.7% (SRS 2024) |
| Contraceptive use | Means of fertility control | 69.1% of married women (NFHS-6) |
| Marriage before 18 | Exposure to childbearing | 20.1% of women aged 20–24 (NFHS-6) |
| Sex ratio at birth | Son preference | 918 girls per 1,000 boys (SRS 2022–24) |
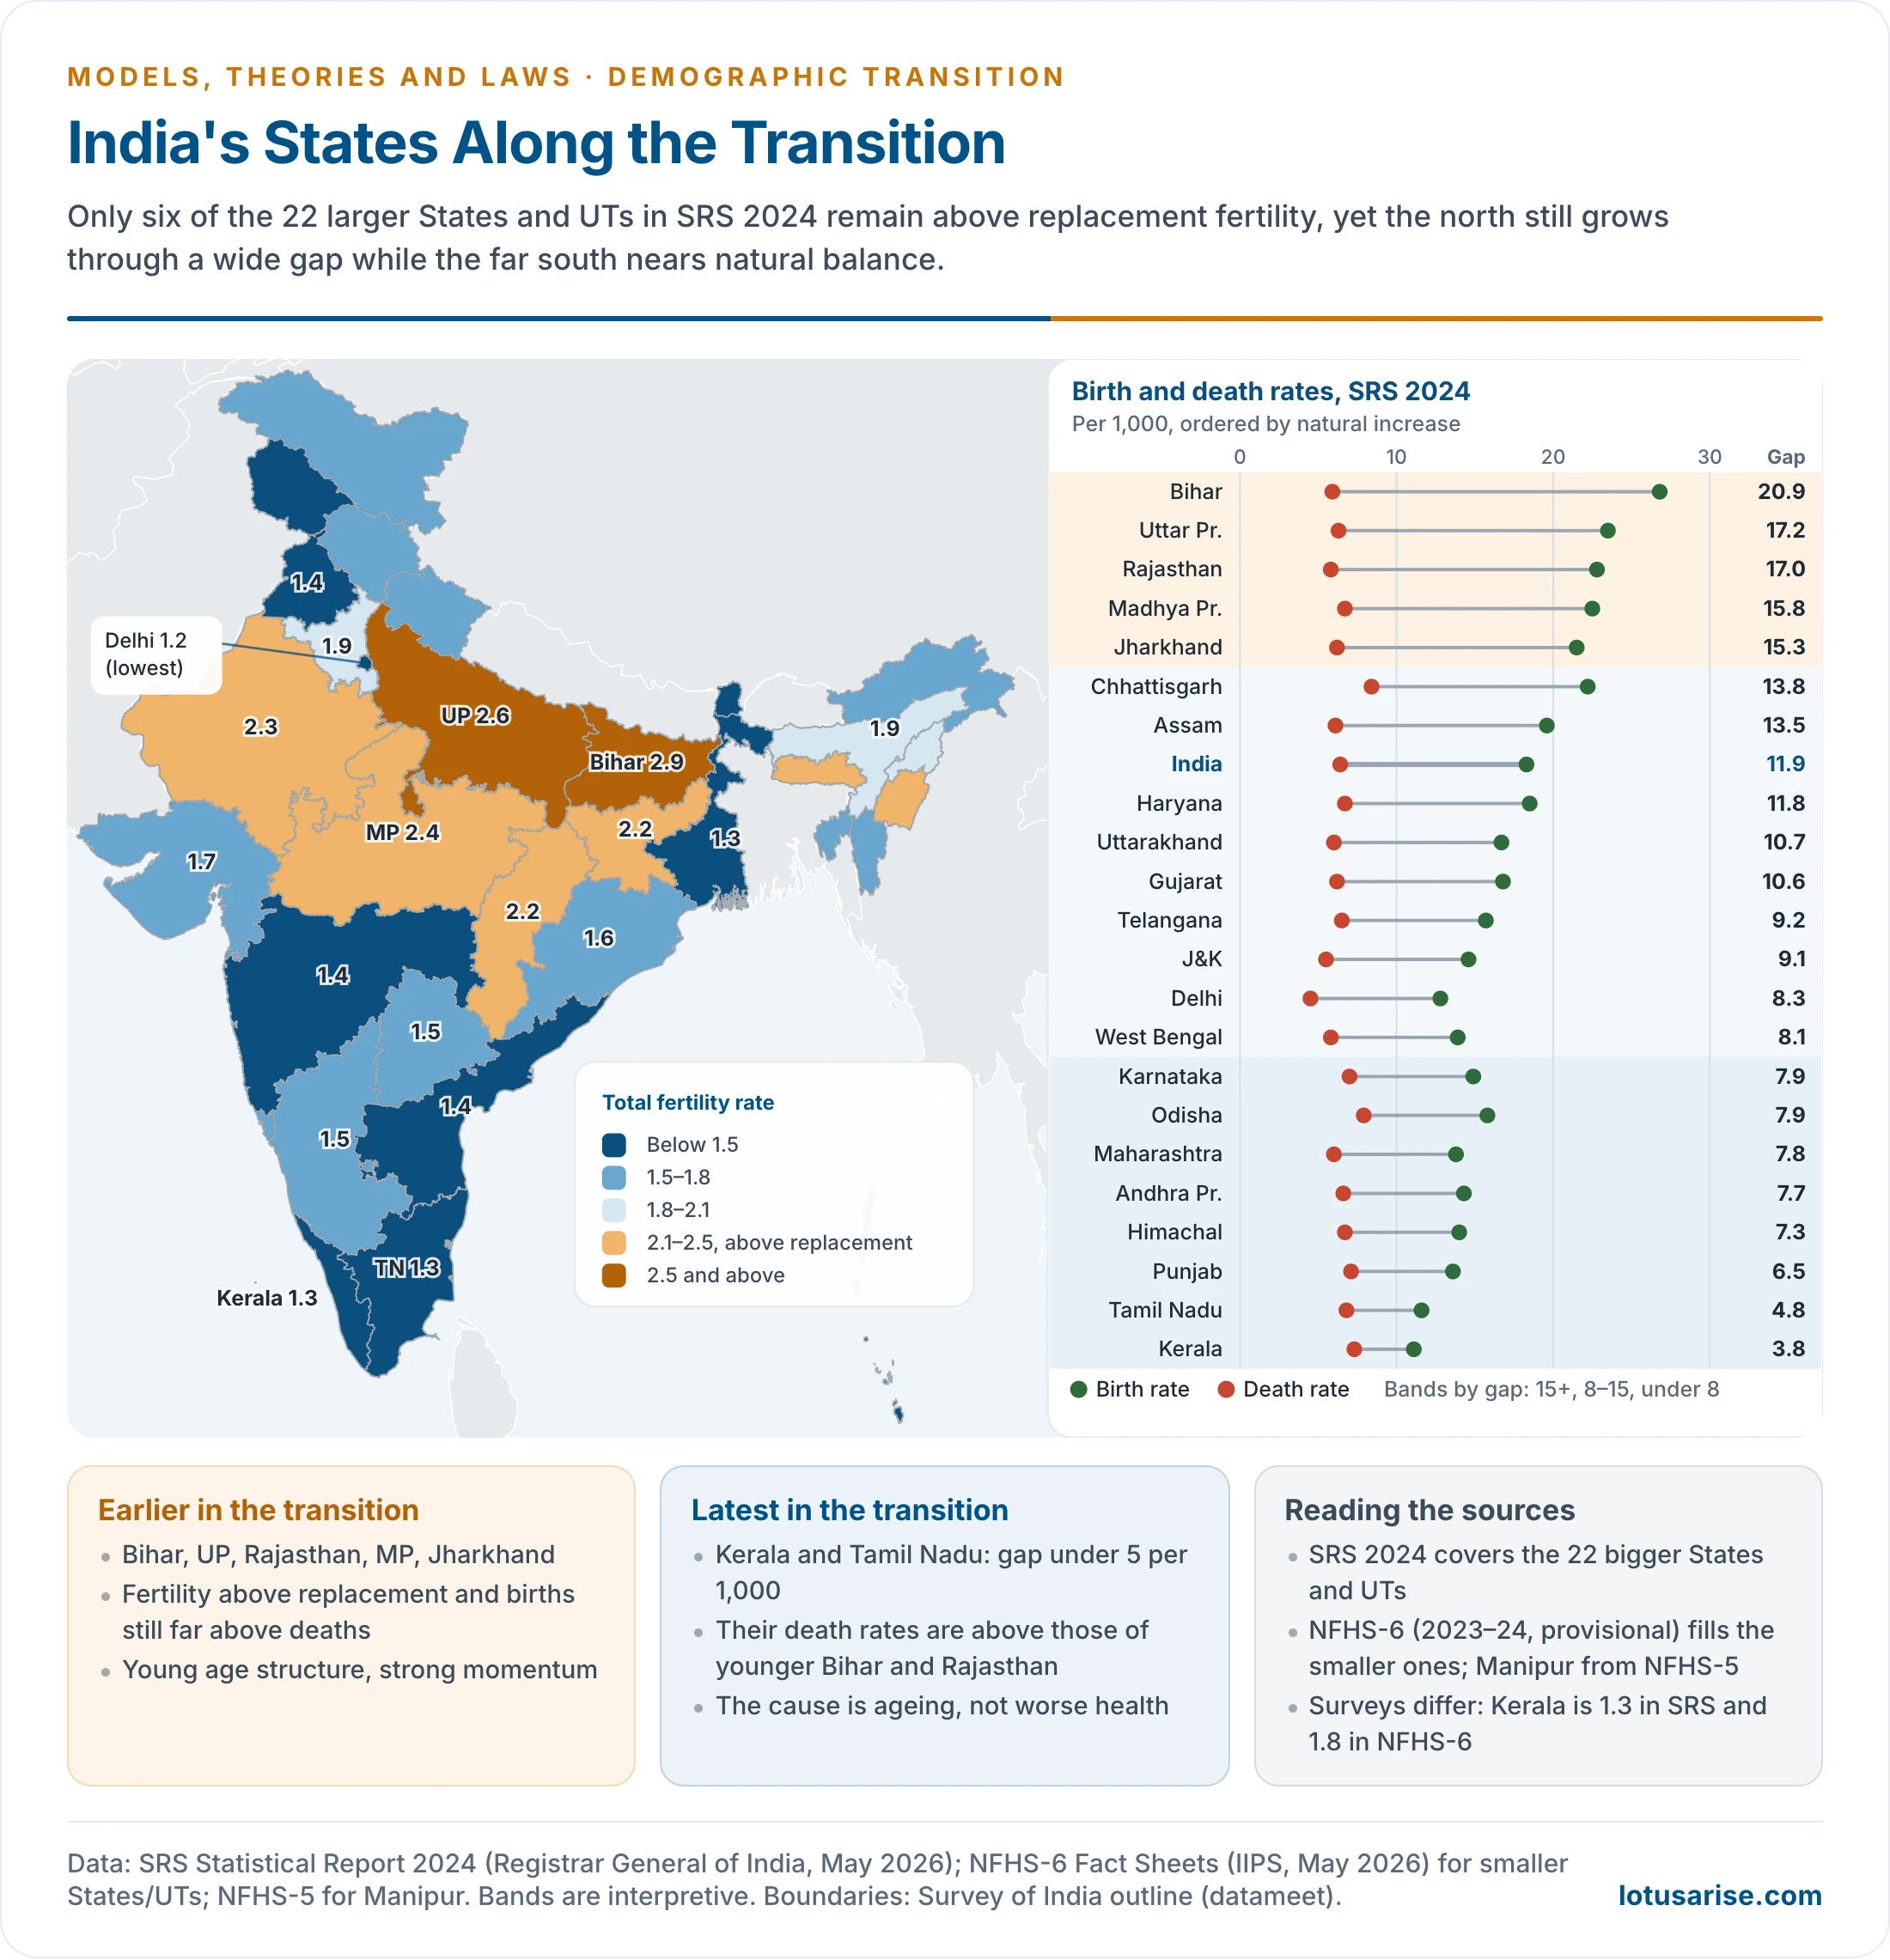
A Transition That Is Not Uniform
| Group | States/UTs (TFR, SRS 2024) | Birth rate minus death rate | Position |
|---|---|---|---|
| High fertility | Bihar 2.9, Uttar Pradesh 2.6, Madhya Pradesh 2.4, Rajasthan 2.3, Jharkhand and Chhattisgarh 2.2 | 14–21 | Earlier in Stage III |
| Near replacement | Assam and Haryana 1.9, Gujarat and Uttarakhand 1.7 | 11–14 | Late Stage III |
| Well below replacement | Odisha 1.6; Karnataka, Telangana, Himachal Pradesh 1.5; Maharashtra, Andhra Pradesh, Punjab, J&K 1.4 | 7–9 | Entering Stage IV |
| Lowest | Delhi 1.2; Kerala, Tamil Nadu, West Bengal 1.3 | 4–8 | Stage IV |
- Kerala shows that transition need not wait for industry.
- Female literacy, health care, land reform and social movements brought replacement fertility by the 1990s, at modest income.
- Its birth rate is now 11.1 and death rate 7.3. About 15.1% of its people are aged 60 or over (SRS 2024), the highest of any large State, and Kerala’s infant mortality of 8 is India’s lowest.
- Tamil Nadu moved early through strong family planning, social reform and rising female education, with a birth rate of 11.6.
- Bihar lags: its birth rate is 26.8, its TFR fell only from 3.2 (2012–14) to 2.9 (2022–24), the slowest decline among large States, and about 35% of women aged 20–24 were married before 18 (NFHS-6).
- Uttar Pradesh alone has a natural increase of 17 per 1,000, and these high-fertility States will supply most of India’s remaining growth.
- West Bengal is an exception: TFR 1.3 despite widespread early marriage, since early sterilisation after two children offsets it.
- Why the gap exists: differences in female literacy (illiterate mothers have a TFR of 3.2 against 1.8 for literate mothers), age at marriage, health services, urbanisation and son preference. The rural-urban gap runs across every region.
- The stage varies within States too. Natural-division data show infant mortality from 4 in southern Kerala to 51 in parts of Uttar Pradesh and Chhattisgarh (SRS 2024).
- Survival is unequal: under-five mortality is 41 in Uttar Pradesh and Madhya Pradesh against 9 in Kerala, so the north lags on deaths as well as births.
Momentum, Divide and Dividend
- Population momentum: past high fertility left a large young population, and today’s many parents produce more births than there are deaths even at low fertility. The UN projects a peak of about 1.70 billion in the early 2060s (WPP 2024).
- Demographic divide: the transition has split India into a young, growing north and an ageing, stabilising south. The India Ageing Report 2023 projected 7.7% of Bihar’s people to be aged 60 or more in 2021, against 16.5% in Kerala. The consequences include north-to-south migration, regional policy needs and debate on delimitation of seats.
- Demographic dividend: falling fertility shrinks child dependency and enlarges the working-age share, now about 68%. It is not automatic. It requires education, skills, health, jobs, higher female participation, industrial growth and good governance, and its window closes earlier in the south. It is treated fully in the note on India’s population.
- Population ageing follows, with pension, health and care burdens arriving first in Kerala, Tamil Nadu and Himachal Pradesh.
- Other concerns include urbanisation pressure, gender imbalance and the need for different policy in different regions: fertility and child health in the north, ageing and migrant integration in the south.
The World in Transition
Stages Reflect Uneven Development
| Stage | Country (birth, death rate, 2024) | Typical setting |
|---|---|---|
| II | Niger (41, 9); Chad (43, 11) | Very low income; low female schooling; farm economy |
| Late II to early III | Nigeria (32, 12) | Falling mortality, high fertility, oil and urban growth without broad gains |
| Late III | India (18, 6); Bangladesh (20, 5) | Lower-middle income; family planning; rising schooling |
| IV | USA (11, 9); France (10, 9); UK (10, 10) | High income; migration sustains growth |
| V | Japan (6, 13); Italy (6, 11); Germany (8, 12); South Korea (5, 7) | High income; very low fertility; ageing |
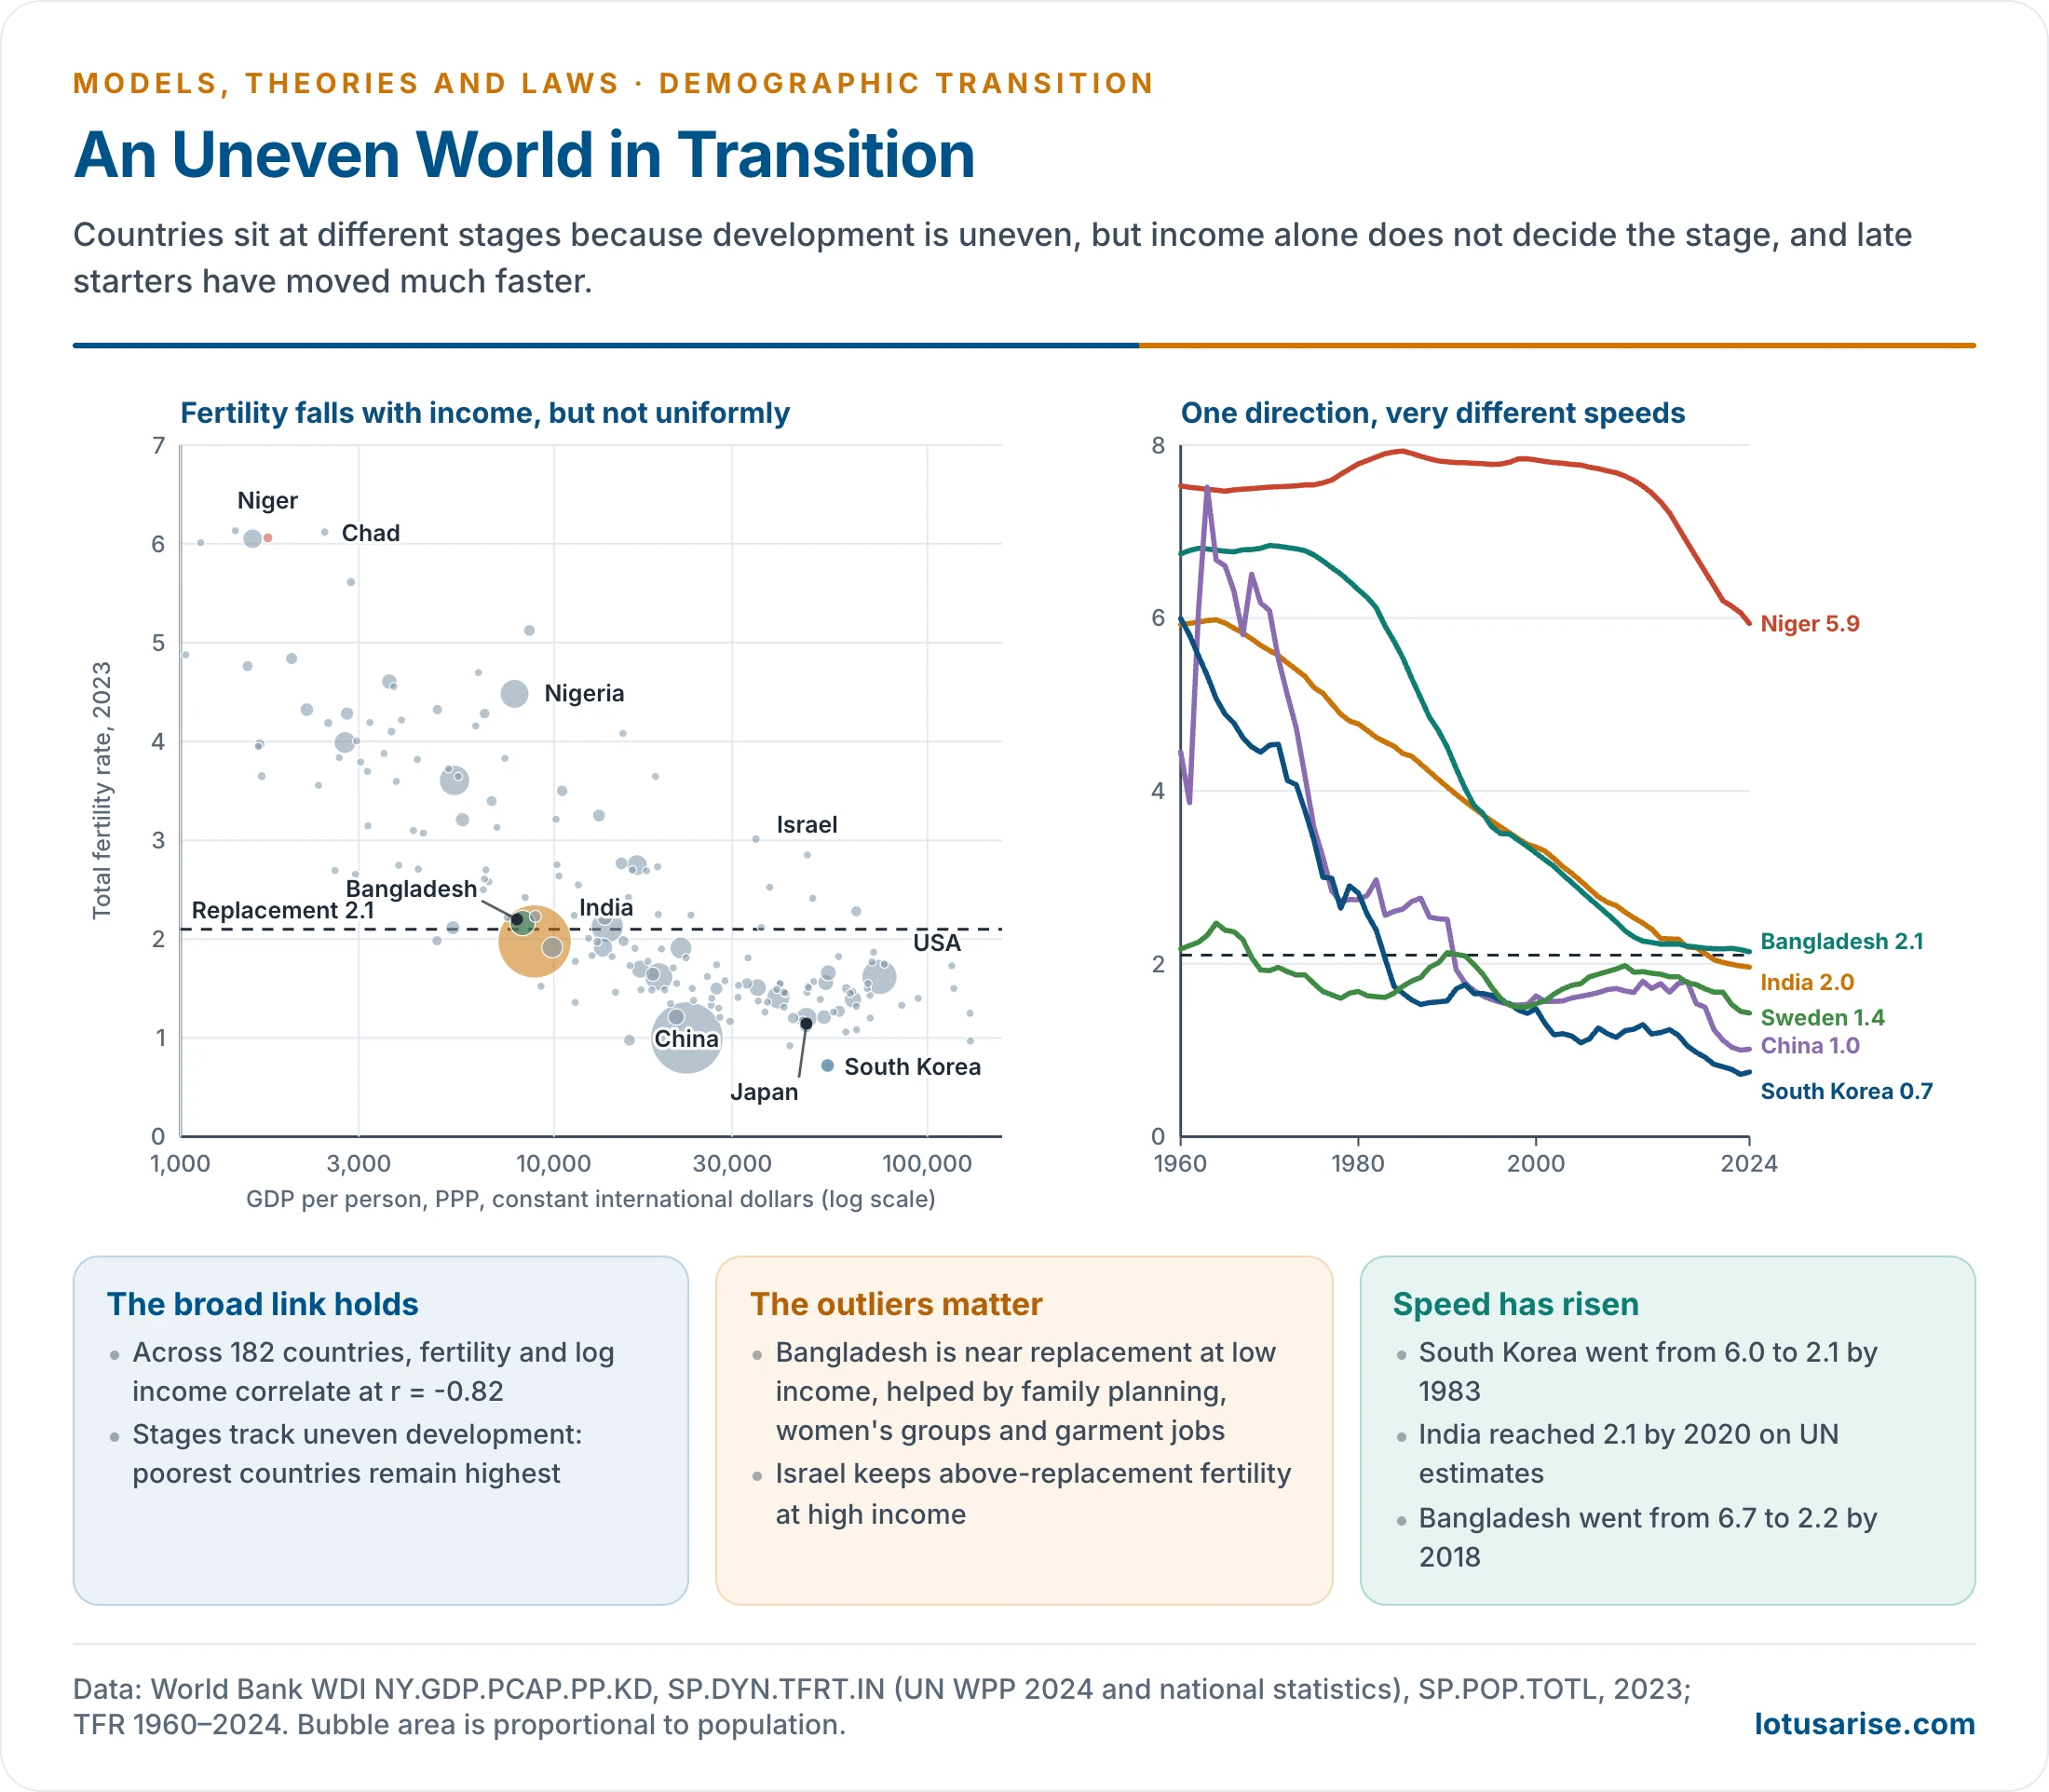
- The broad link is strong. Across 182 countries in 2023, total fertility correlates with log income at r = −0.82. The stages therefore map the uneven spread of income, health and schooling across the globe.
- Mortality converged first. Medicine and public health spread quickly and cheaply, so even poor countries have low crude death rates. Fertility stays more varied, because it depends on women’s status, culture, policy and the value of children. World TFR fell from about 4.7 (1960) to 2.2 (2024).
- Crude rates can mislead. Young age structures can give poor countries lower crude death rates than rich ones: Niger’s 8.7 is below Germany’s 12.1. Age-standardised rates and life expectancy tell the true story.
- The link is not complete:
- Bangladesh is near replacement (TFR 2.1) at low income, helped by family planning, women’s groups and garment jobs.
- Israel stays at about 2.9 at high income.
- Gulf states reached low death rates through oil wealth rather than a long industrial stage.
- Sub-Saharan Africa kept high fertility even as death rates fell, so its transition is slower than Asia’s and started from a lower income.
- Late starters move faster. South Korea’s TFR fell from 6.0 (1960) to 2.1 by 1983, whereas Sweden’s birth rate took more than half a century to halve from 30. Falling costs of contraception, mass schooling, media and state programmes have all shortened the path.
- Growth is now concentrated. In nine countries, including Angola, the DR Congo, Niger and Somalia, population is expected to double between 2024 and 2054 (UN WPP 2024). The world’s remaining transition is largely African.
- The UN now frames the world through this model: 63 countries had already passed their peak by 2024 and 126 are still growing to 2054, while world population should peak at about 10.3 billion in the mid-2080s. The wider story is in growth of world population.
Beyond the Classic Model
- Second demographic transition (Ron Lesthaeghe and Dirk van de Kaa, 1986): in Europe from the 1960s, values shifted towards individual choice.
- Later marriage, cohabitation, divorce, childbearing outside marriage and voluntary childlessness weakened the family as an institution.
- Fertility falls well below replacement, and migration tends to fill the gap.
| Aspect | First transition | Second transition |
|---|---|---|
| Period | From the late 18th century in Europe | From the 1960s |
| Driver | Falling mortality; concern for children | Autonomy and self-fulfilment |
| Family | Strong, marriage-centred | Weaker; varied living arrangements |
| End state | Balance near replacement | Fertility below replacement |
- Ultra-low fertility in East Asia: South Korea’s TFR fell to a world low of 0.72 in 2023, then rose to 0.80 in 2025, with deaths still above births. China’s births fell to 7.92 million in 2025, and its population has fallen for four years.
- Third demographic transition (David Coleman, 2006): in low-fertility Western countries, sustained immigration is changing the ethnic composition of the population.
- Fertility rebound: at very high development levels, fertility may rise again (Mikko Myrskylä and others, 2009), but only where work and family can be combined. Sweden’s fall from 1.98 (2010) to 1.43 (2024) makes this doubtful.
Geographical Significance
- Distribution: regions at different stages differ in density, growth and age structure.
- Migration: Stage II and III societies generate rural pressure and outflow, which links to the mobility transition of Wilbur Zelinsky (1971).
- Urbanisation is both a cause and a consequence, since city life changes family-size preferences and raises the cost of children.
- Regional planning: early-transition areas need maternal and child health and schooling; late-transition areas need jobs, elder care and social security.
- Population policy: policy can be matched to the stage instead of being uniform everywhere.
- Resources: rapid growth in Stage II presses on land, water, food, housing and employment.
Evaluation
Criticism
- Eurocentric base: it rests on the Western experience, where decline ran gradually alongside industry and with slow growth. Asia, Africa and Latin America had rapid mortality decline through imported medicine and public health, even before full industrialisation, which brought unprecedented growth. The later transitions were compressed and externally driven, so the Western sequence cannot be applied mechanically.
- Not a universal law, nor a predictive one: the stages are neither inevitable nor always sequential. David Loschky and William Wilcox (1974) argued that the theory lacks principles strong enough to support population projections.
- No fixed timetable: some European countries took more than a century, while East Asia took a few decades. It gives direction and not dates.
- Weak on causes: “modernisation” bundles income, education, urbanisation, female employment, contraception, media, child survival and family values. Different countries reached low fertility for different reasons, so the theory describes the pattern better than it explains it.
- Culture and religion are underplayed: patriarchy, son preference, caste and family norms can speed up or delay decline. Regions of similar income can differ widely, as Kerala and many richer Indian States did.
- Gender is neglected: female literacy, property rights and decision-making are central, and fertility often falls only when women gain control over marriage and contraception.
- State policy is left out: China’s one-child policy pushed it into low fertility by force, and India’s family planning programme and European pro-natalism also shaped outcomes. Fertility decline need not follow development.
- Migration is left out: it receives little attention, yet it shapes the Gulf, North America and Western Europe, and supplies growth where natural increase has ended. Emigration can also strip a region of its young workers, as in the Uttarakhand hills.
- Stage reversal occurs: Russian male life expectancy fell from about 64 (1990) to 58 (1994) after the Soviet collapse, with welfare and health systems in crisis. Wars, pandemics and state failure can undo progress, so the path is neither linear nor irreversible.
- It did not foresee the end state: it expected a stable balance at low levels, not ultra-low fertility, ageing and decline.
- The national scale misleads: large countries contain several stages at once, as India shows, so it should be applied regionally.
- Environment is underplayed: climate vulnerability, water scarcity, food security and ecological limits get little attention, although population change cannot be studied apart from them.
- Who gains is ignored: it may describe trends without asking who benefits. A country can reach low fertility with informal work and deep inequality.
Relevance
- Macro framework: it remains the standard account of long-term demographic change from traditional to modern society, and the UN’s World Population Prospects 2024 still uses it as its analytical frame.
- Classification: countries and regions can be compared by fertility, mortality and age structure.
- Projection and planning: it indicates the broad direction of change and the priorities of each stage, though not the timing.
- Link to development: it connects vital rates with health, education, income and urbanisation.
- Later stages: it explains the demographic dividend in Stage III, and ageing and decline in Stages IV and V.
- Verdict: as a description of the world’s demographic history at the macro level, it is strong. As a law of what every country must do and when, it fails. It should be read in each country’s context, since today’s conditions differ greatly from nineteenth-century Europe.
Comparison With Malthusian and Marxian Theories
| Basis | Thomas Robert Malthus | Karl Marx | Demographic transition |
|---|---|---|---|
| Question asked | Can numbers outrun food and resources? | Who controls resources, and why does poverty exist? | How do birth and death rates change with development? |
| Main focus | Population against food | Population under capitalism | Vital rates and development |
| Nature | Pessimistic; natural law | Class-based; historical law | Empirical; evolutionary |
| Cause of the problem | Overpopulation | Exploitation, unequal distribution | Gap between falling deaths and falling births |
| Role of development | Limited | Depends on mode of production | Central |
| Role of technology | Underrated | Displaces labour under capitalism | Lowers mortality, then fertility |
| Fertility | Rises with prosperity | Falls with higher wages; a result of class position | Falls with modernisation |
| Remedy | Moral restraint | Social transformation | Development, education, health, family planning |
| Geographical value | Carrying capacity | Inequality, migration, slums | Stages, regions, planning, projections |
| Main weakness | Ratios; ignored technology | Neglects demography and culture | Eurocentric; weak on causes |
- Not mutually exclusive: they answer different questions.
- Transition theory and Malthus:
- It partly answers him, since growth does not continue for ever and fertility falls with urban life, education and women’s status.
- His concern is still real in Stage II, when deaths have fallen and births have not.
- Transition theory and Marx:
- It says little about class. A country may enter Stage III and still have informal labour, regional inequality and urban poverty, which Marx explains better.
- Marx in turn has little to say on why fertility falls, and transition theory fills that gap.
- Together, the three explain resource pressure, distribution and demographic change, which is why geographers read them side by side.
Summary
| Category | Details |
|---|---|
| Proponents | Warren S. Thompson (1929), Adolphe Landry (1934), Frank W. Notestein and Kingsley Davis (1945), C. P. Blacker (1947) |
| Core claim | Deaths fall first, births later; growth surges in the gap |
| Stages | High stationary, early expanding, late expanding, low stationary, declining |
| India | Late Stage III moving to IV: TFR 1.9, birth rate 18.3, death rate 6.4 (SRS 2024) |
| Unevenness | Bihar 2.9 to Delhi 1.2; a demographic divide of north and south |
| Extensions | Second transition (1986), third transition (2006), ultra-low fertility |
| Main critique | Eurocentric, not predictive, weak on causes, gender, migration and policy |
| Value today | Framework for comparison, projection and planning |
Previous Year Questions
2025Analyze the role of demographic transition theory in explaining variations in fertility and mortality rates globally.2023“The stages of demographic transition are a reflection of uneven economic development across the globe.” Explain with suitable examples.2020The process of demographic transition is not uniform in India. Examine this statement in the context of demographic transition theory.2008Discuss the social and economic theories of population growth.2007Write a note on the parameters used to describe the demographic transitions in the developing countries like India.1986Write short note on Demographic transition.





 History Optional PYQ Master Pack: Topic-wise Model Answers (1985–2025) by LotusArise IAS
 History Optional Mains Master Kit 2027 Complete Self-Study System — Notes, Mapping & Premium Articles by LotusArise IAS
Best resource for Models and Theories! Thank you.
better than any other reference book.
thanks
thankyou sir
The relevance of the demographic transition theory in explaining population process in developing countries
jThe relevance can be shown by explaining the assumption of theory may be stages of demographic transition theory relate with population process in developing countries..
Very well explaination
Thanx
Very helpful for preparing notes