

- The primate city and the rank-size rule are two ways of describing the size distribution of cities in a country or region. Both sit at the top of the hierarchy of urban settlements.
- The primate city model describes one dominant city that dwarfs all others. The rank-size rule describes a smooth, balanced gradation in which each city is a fixed fraction of the largest.
- The first concerns the relation between the first and second cities; the second concerns all the cities of a system. Real urban systems lie between the two, and the deviation of an actual system from the ideal is itself a measure of its integration and level of development.
Primate City

Jefferson’s Law of the Primate City
- The concept was put forward by the American geographer Mark Jefferson (1939) in his paper The Law of the Primate City.
- It is an empirical, inductive model: a generalisation from observed city sizes, not a deduction from theory.
- Jefferson used it as a yardstick of a country’s socio-economic condition and stage of development. The nature of a country’s urbanisation, he argued, reflects its national life.
- Definition: a primate city is the largest city of a country that has grown disproportionately large compared with the other cities.
- It is at least twice the size of the second city and far more than twice as important.
- It grows centripetally: through economic opportunity, the concentration of political power, industrial growth, the concentration of the factors of production and agglomeration economies.
- Jefferson’s evidence: he compared the largest and second cities of 51 countries.
- In 28 the largest city was more than twice the second.
- In 18 it was more than three times the second.
- The typical ratio of the first three cities was about 100 : 30 : 20.
- Metropolitan London was then more than seven times Liverpool, Copenhagen nine times the next Danish town, and Mexico City five times Guadalajara.
- Older accounts of the study also say 41 of the 51 countries had primate cities, and name London, Paris and Berlin, with London at least 5 times Birmingham. The sample was world-wide, not European alone.
- The usual summary is that the largest city is more than twice the second and often five times the third.
- From this regularity he concluded that a primate city is one with more than twice the population of the second-ranking city. The definition rests on the ratio of R1 to R2.
- Jefferson saw the primate city as the largest economic magnet of a country:
- it attracts migrants, capital and talent from the whole territory;
- it is the expression of national sentiment and of people’s socio-economic aspirations;
- it reflects centripetal forces and, often, a fairly uniform ethno-linguistic character of the nation.
- Primacy is not universal. Many countries have two or more comparable cities: India’s four metros, Sydney and Melbourne in Australia, Toronto and Montreal in Canada, Karachi and Lahore in Pakistan.
- Unlike the gradual hierarchy of the rank-size rule, primacy produces a steep, uneven hierarchy:
- the first city dwarfs all others;
- lower-ranked cities are much smaller and less developed;
- functional complexity is concentrated in a single centre.
Characteristics of a Primate City
- A primate city is distinguished by multi-dimensional dominance, not population alone:
- Economic dominance: the main concentration of industry, trade, finance and services; the principal economic hub.
- Political centrality: usually the national capital, the seat of government institutions and decision-making.
- Cultural supremacy: the centre of higher education, media, arts and intellectual life; it shapes national identity.
- Transport and communication advantage: the main port, airport and the hub of road and rail networks.
- Demographic magnetism: large-scale migration from villages and small towns, and so rapid growth.
- The city becomes functionally complex and self-reinforcing, continuously drawing more people, resources and investment.
- Classic examples: London, Paris, Athens, Vienna, Budapest, Dublin and Copenhagen in Europe; Bangkok, Manila, Dhaka, Seoul, Jakarta, Tehran and Baghdad in Asia; Cairo, Nairobi, Addis Ababa and Luanda in Africa; Mexico City, Lima, Buenos Aires, Santiago and Montevideo in Latin America.
- Split (dual) primacy: where the political capital and the commercial capital are different cities, dominance is shared.
- Examples: Washington and New York, Canberra and Sydney, Brasília and São Paulo, Ankara and Istanbul, Islamabad and Karachi, Abuja and Lagos.
- India shows the same split at the national level: Delhi leads in administration, Mumbai in finance and business.
- Regional primacy: a city may be primate within a region or province without being so nationally, as with the capitals of most Indian States.
Measuring Primacy
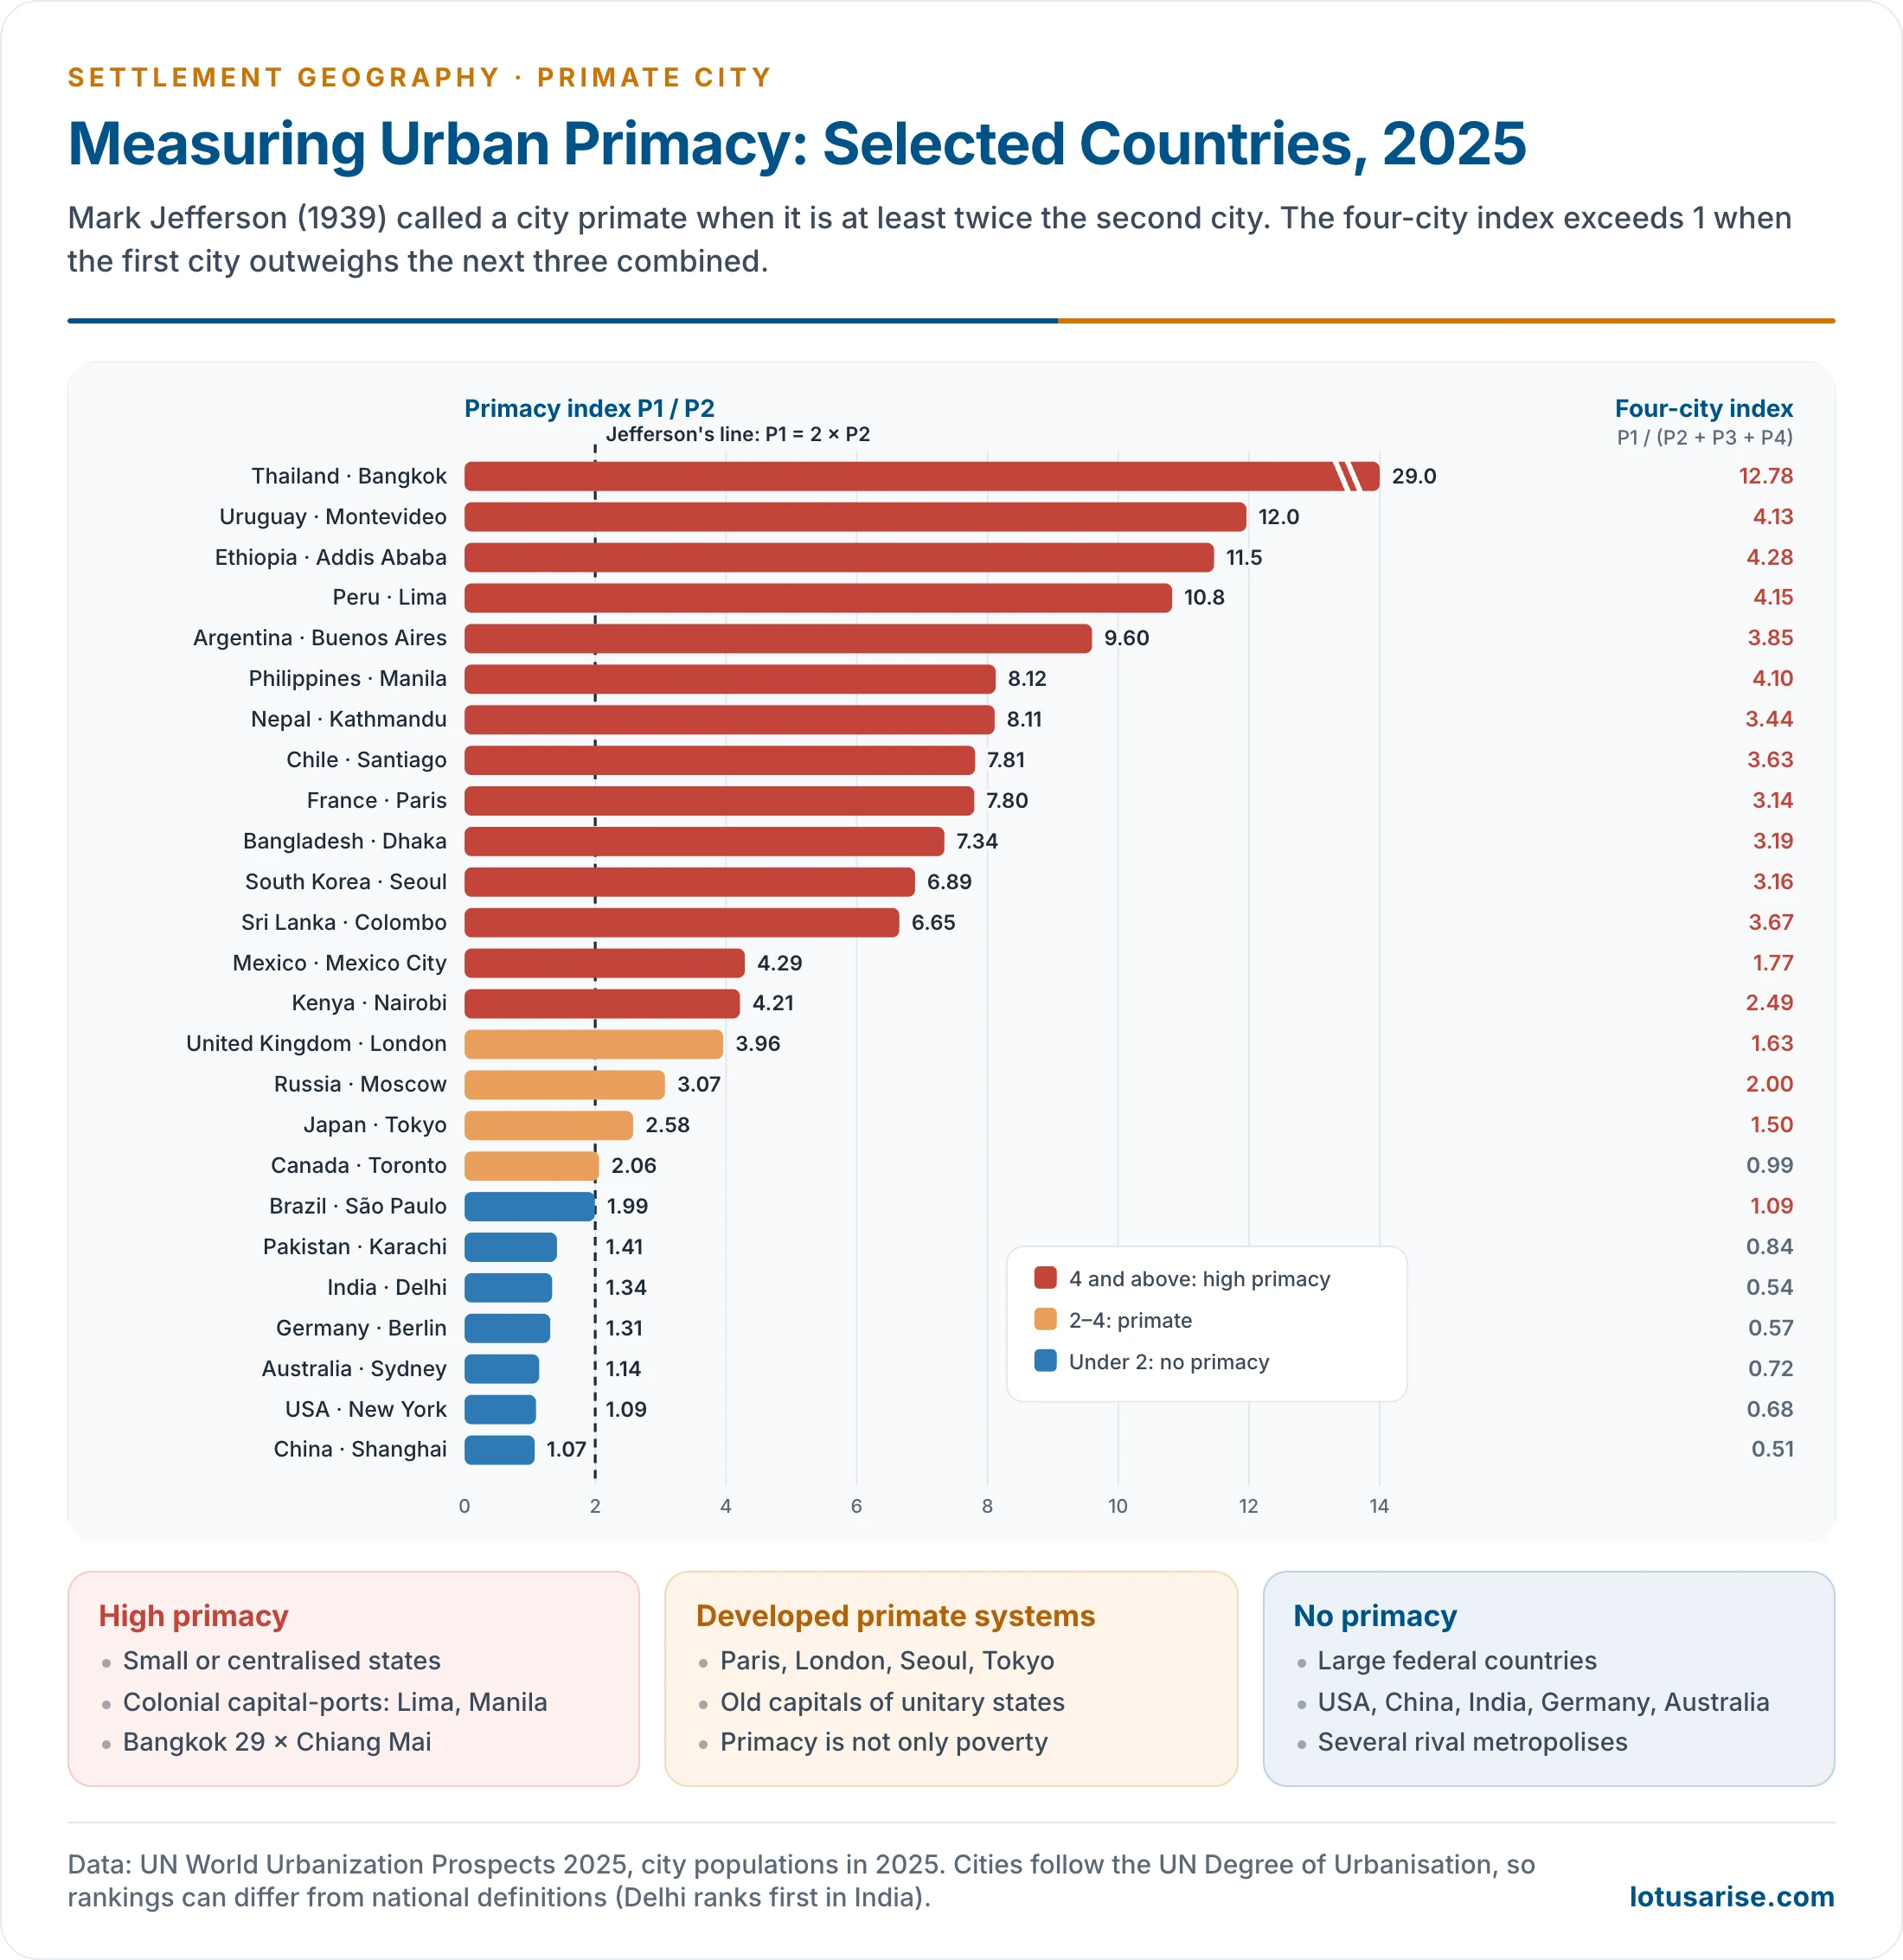
- Primacy index (two-city index): PI = P1 / P2, where P1 and P2 are the populations of the largest and second-largest cities.
- A value above 2 marks a primate city in Jefferson’s sense.
- Four-city index: PI = P1 / (P2 + P3 + P4).
- It is less sensitive to an unusually large or small second city. A value above 1 means the first city outweighs the next three combined.
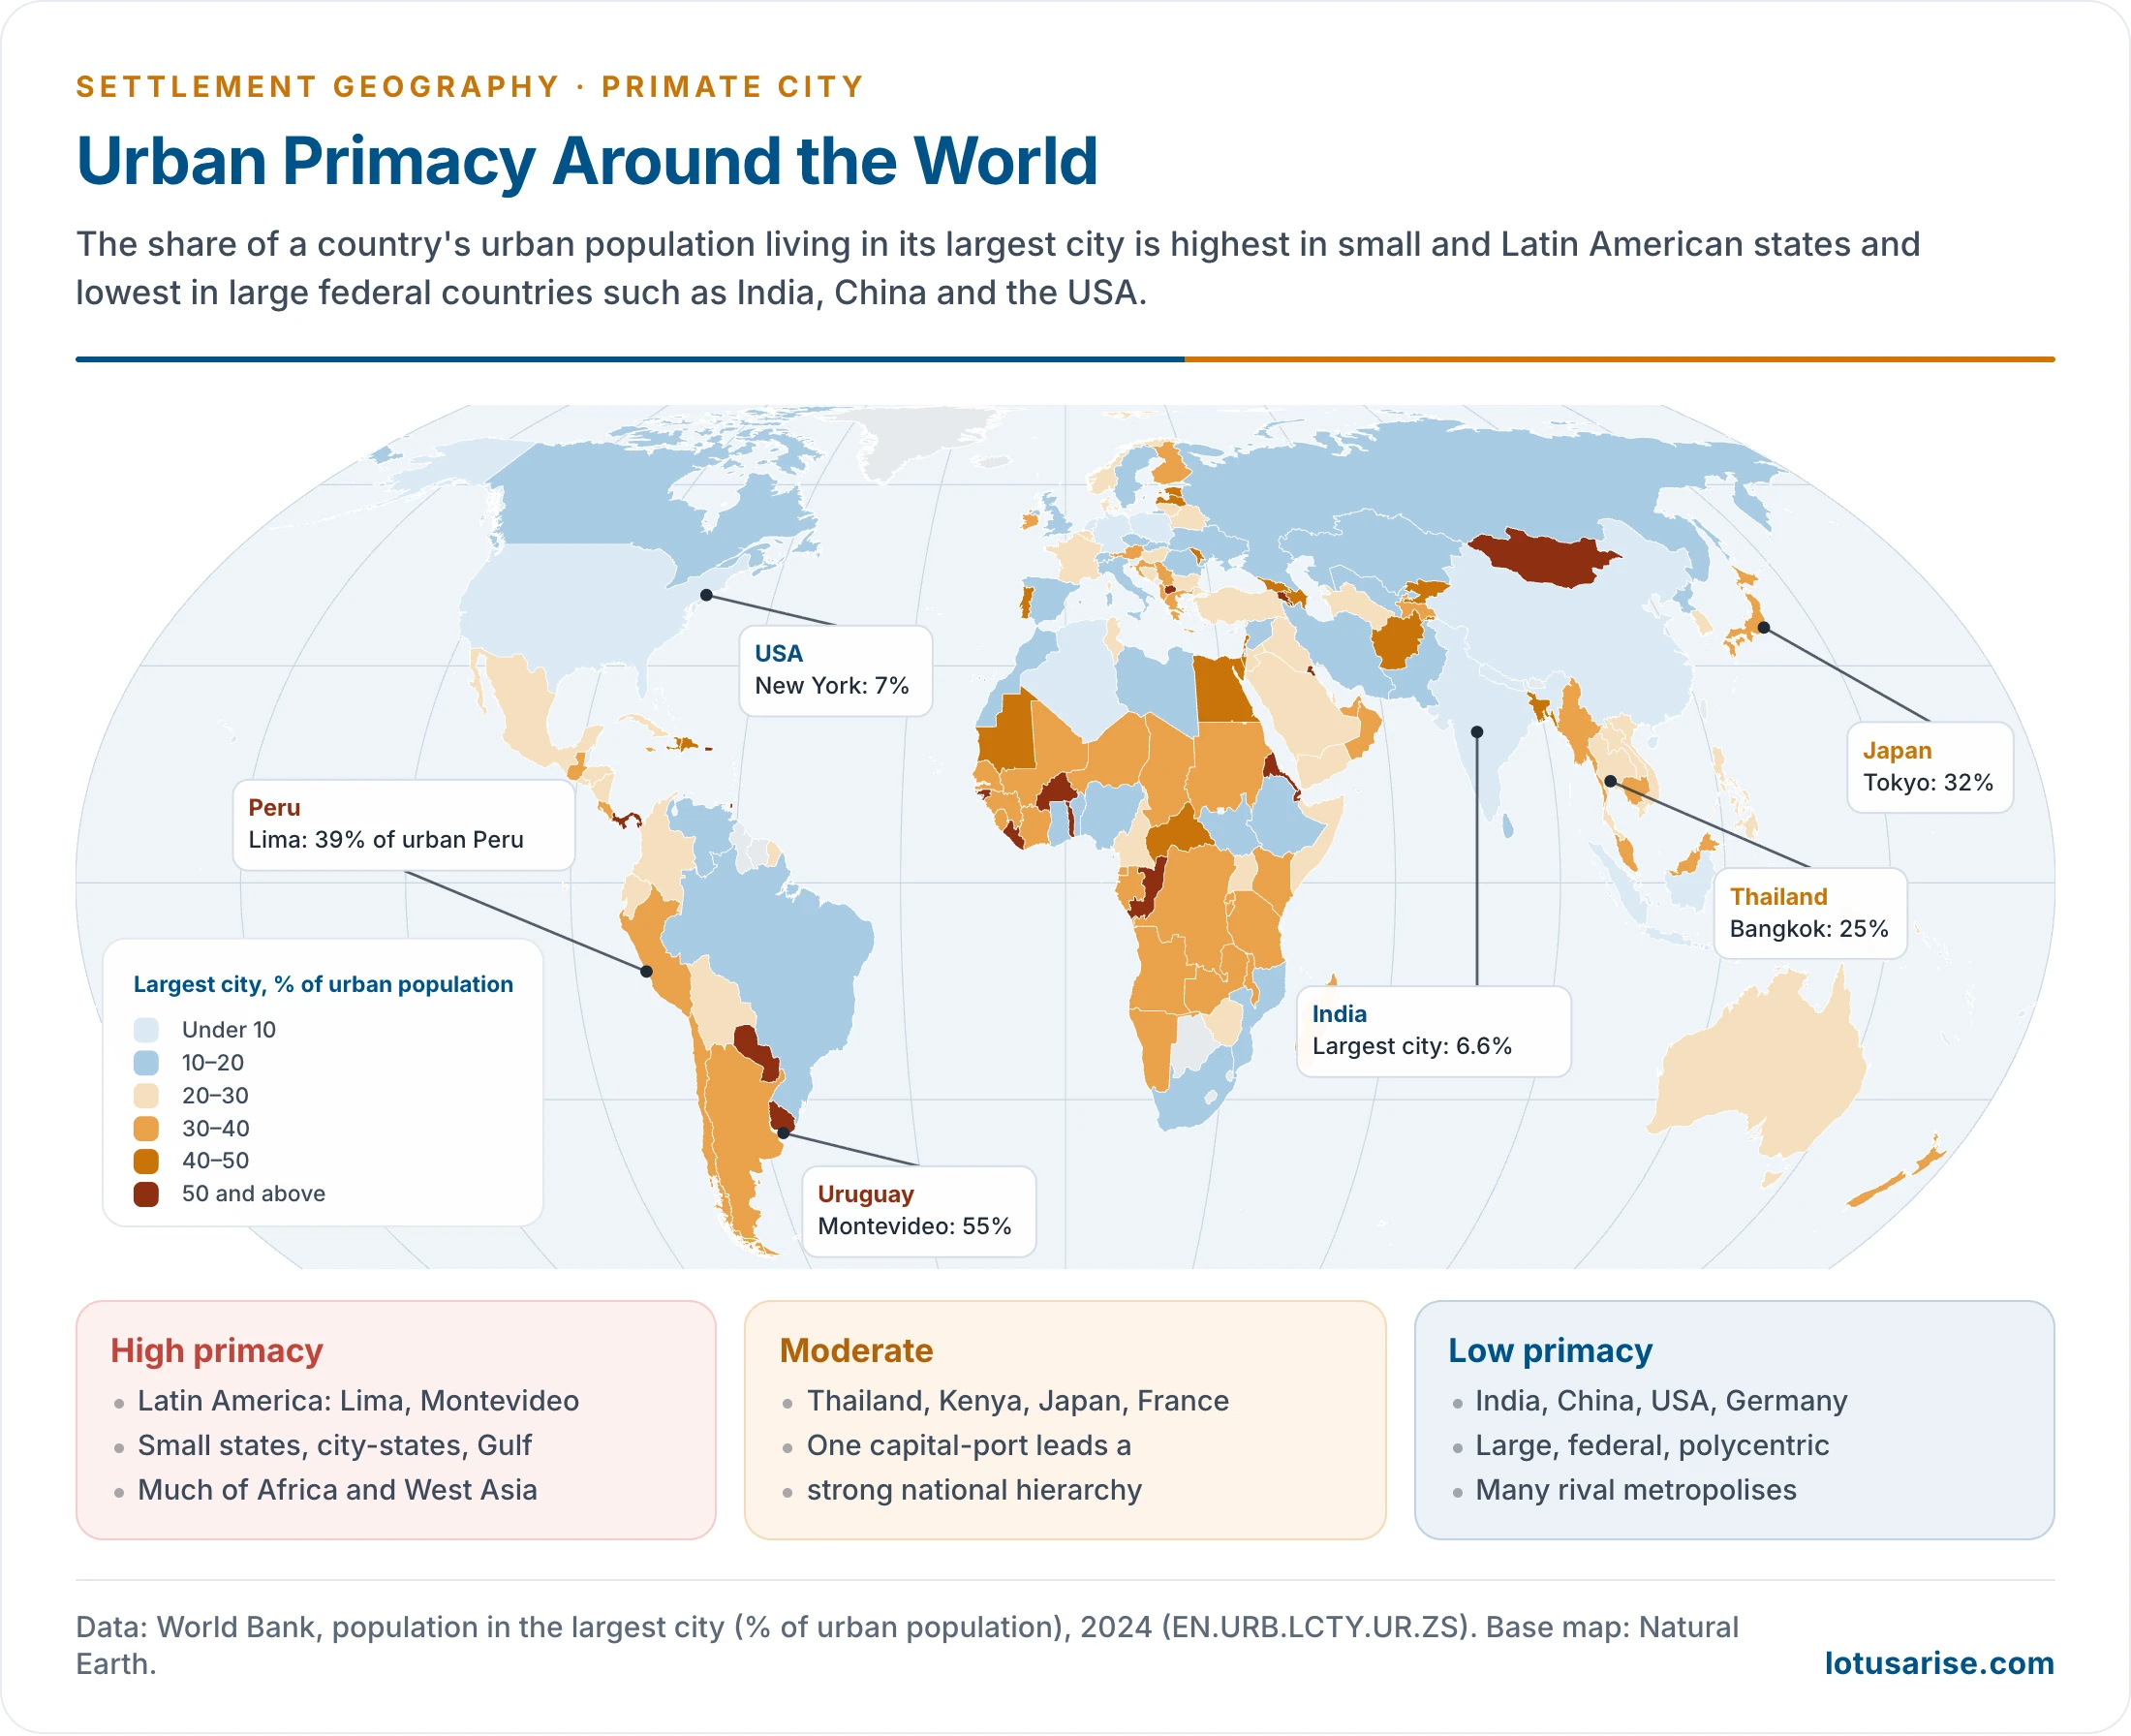
- Share of urban population in the largest city: used for international comparison (World Bank, UN).
- A higher value of any index means stronger primacy and a more unbalanced urban system.
- Present pattern (UN World Urbanization Prospects 2025):
- Very high primacy: Bangkok is about 29 times Chiang Mai; Montevideo about 12 times the next Uruguayan city; Lima about 11 times Arequipa; Buenos Aires about 10 times Córdoba.
- Developed primate systems: Paris is about 8 times Lyon, Dublin about 7 times Cork and London about 4 times Birmingham. Mexico City is about 4 times Guadalajara.
- No primacy: the USA, China, India, Germany and Australia have indices close to 1.
- The share of the urban population in the largest city shows the same contrast. It exceeds 50% in Uruguay, Paraguay, Mongolia and several small African states, but is under 10% in India (about 6.6%), the USA (about 7%) and China (about 3%) (World Bank 2024).
Emergence of a Primate City
- Primacy develops through a cumulative, self-reinforcing process, not by accident.
- Initially a region has several settlements of similar status, each with its rural hinterland.
- As urbanisation proceeds, one city gains a strategic advantage: a better site or situation, a port, the seat of government, access to world trade.
- It then attracts more economic activity, leading to in-migration, more jobs, and better infrastructure and services.
- This positive feedback loop lets the city grow at the expense of the others until it becomes primate.
- Once established, primacy sustains itself:
- investment continues to concentrate there;
- skilled labour prefers the dominant city;
- institutional and infrastructural advantages keep reinforcing growth.
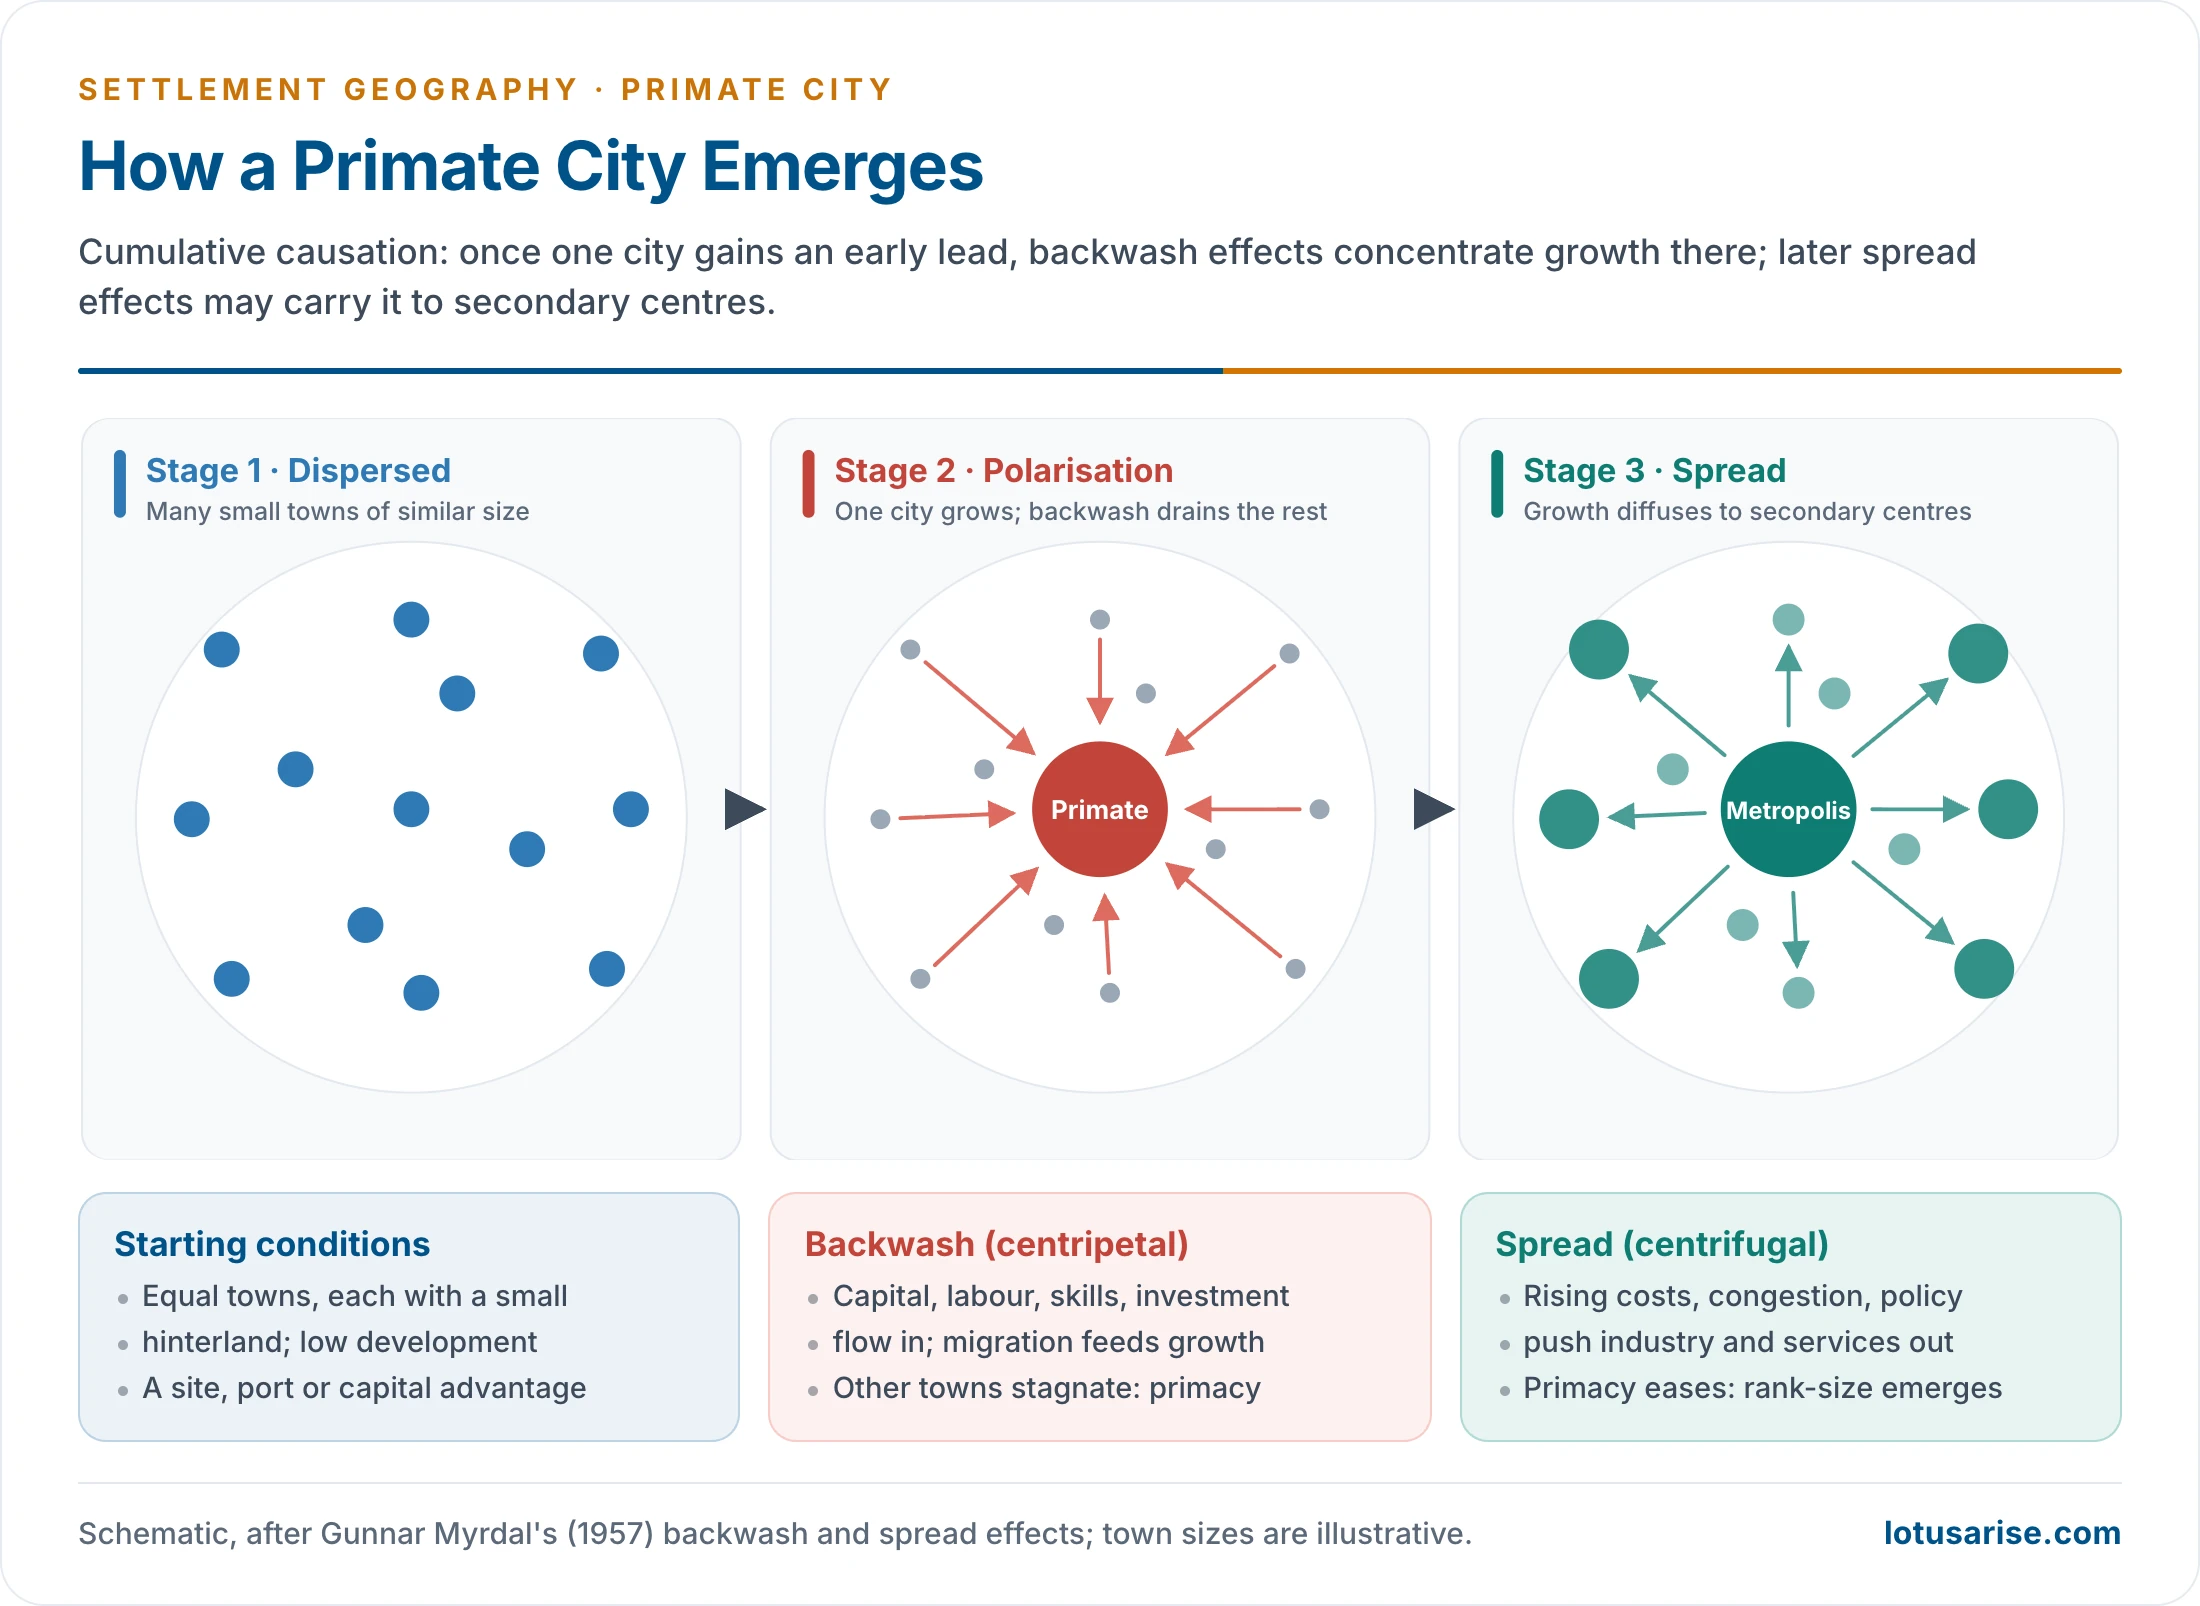
- Jefferson did not explain the process. It is best explained by Gunnar Myrdal’s (1957) cumulative causation, read as three stages:
- Stage 1: development is uniform but low.
- Stage 2: a central place attracts capital, labour and enterprise and grows disproportionately by draining its surroundings. This backwash effect works like a vacuum pump, pulling investment and technology away from other cities.
- Stage 3: spread effects diffuse development outward from the primate city to the rest of the landscape.
- Thus a primate city is a stage in development. It offers better jobs, higher wages, better infrastructure and the hope of a better life, sustained by migration, a growing commercial sector and its pull on capital and people.
Conditions Favouring Primacy
- Arnold S. Linsky (1965) tested which countries tend to have primate cities. Primacy is most likely in countries with:
- small territorial extent;
- high population density and rapid population growth;
- an agricultural, export-oriented economy;
- low per capita income;
- a former colonial status, where one capital-port linked the colony to the imperial economy.
- A large population base often appears in lists of these conditions, but Linsky did not find it; many strongly primate countries are small.
- Brian J. L. Berry (1961) examined city-size distributions in 38 countries. Only 13 followed the rank-size form; the rest were primate or intermediate.
- Primacy occurred in both rich and poor countries. Berry found no simple link between primacy and the level of development.
- Rank-size systems were typical of large, old, economically and politically complex countries; primacy of small, simpler ones, or of those dominated by a few outside forces.
- Salah El-Shakhs (1972) proposed a curvilinear relationship: primacy rises in the early stages of development and falls as development matures and spreads.
- Trends, 1975–2025 (UN World Urbanization Prospects 2025, largest ÷ second city):
- Rising primacy where one gateway city captured export growth: Bangladesh (Dhaka) from about 3.6 to 7.3, South Korea (Seoul) from 4.2 to 6.9, Kenya (Nairobi) from 2.6 to 4.2, Indonesia (Jakarta) from 3.2 to 4.7.
- Falling primacy where secondary cities grew faster: the Philippines (Manila) from about 15 to 8, Mexico from 5.5 to 4.3, Nigeria (Lagos) from 3.2 to 2.3, France from 8.9 to 7.8.
- Both directions fit El-Shakhs’ view that primacy depends on the stage and spread of development, not on income alone.
- Developed countries such as Britain, France, Denmark, Austria and Ireland have primate cities. Their capitals are old, centralised capitals of unitary states, not products of poverty.
- Germany counted among them in Jefferson’s day, with Berlin; its index today is only about 1.3.
- Within Northern Ireland, Belfast is far larger than any other town, while the remaining towns follow the rank-size rule fairly closely. Primacy at the top can sit above rank-size below.
- Many developing countries lack primacy: India, China, Pakistan and Brazil. Size, federal structure and regional diversity work against it.
Primate Cities and Urban Spheres of Influence in Developing Countries
- In much of the developing world the primate city’s sphere of urban influence is the whole national territory.
- It supplies the highest-order functions (ministries, head offices, banks, universities, specialist hospitals, the international airport) to the entire country.
- Smaller cities are left with truncated spheres: they serve only local, low-order needs and lie in the primate city’s urban shadow.
- Mechanisms of dominance:
- Colonial inheritance: capital-ports such as Lima, Manila, Dakar, Luanda and Colombo were built to link the colony to the metropole; railways and roads converge on them.
- Political centralisation: a unitary state concentrates jobs, contracts, licences and decisions in the capital.
- Agglomeration economies: firms locate where markets, suppliers and skilled labour already are.
- Urban bias in public spending and infrastructure, and in subsidised food and transport.
- Globalisation: foreign investment, export industries and producer services enter through one gateway city (Bangkok, Dhaka, Nairobi).
- Positive roles:
- The primate city is the growth pole and innovation centre of the national economy, offering scale economies a poor country cannot afford in many places.
- It is the link to the world economy and the main channel for the diffusion of modern ideas.
- Bert F. Hoselitz (1955) called such cities generative when their growth stimulates the wider economy.
- Negative roles:
- They can be parasitic (Hoselitz): draining rural capital, talent and savings without returning comparable benefits.
- Regional imbalance, the core–periphery split described by John Friedmann (1966) and backwash in Myrdal’s sense.
- Over-urbanisation of the core: slums, informal work, congestion, pollution and flooding (Dhaka, Lagos, Manila, Lima).
- Weak intermediate cities, which break the urban hierarchy and the diffusion of services to rural areas.
- Responses:
- New capitals to shift functions: Brasília (1960), Abuja (1991) and Indonesia’s Nusantara, legislated in 2022.
- Growth poles and secondary-city programmes, such as Thailand’s Eastern Seaboard development.
- Decentralisation of administration and investment to regional centres.
- Evaluation: primate dominance is partly a stage that may ease with development, as El-Shakhs suggested. Where colonial structures, political centralisation and globalisation reinforce one another, it persists and becomes a lasting cause of regional disparity.
Applicability and Desirability
- Applicability:
- The primate city is an inductive generalisation. It has no universal validity, since socio-economic forces keep changing and any law about human behaviour lacks complete objectivity.
- Its relevance is mixed. Uruguay, Thailand and Peru fit it strongly; Canada (Toronto only about 2 times Montreal) only just meets it; the USA, China and India do not.
- Older figures for the same cases: Mexico City 5 times Guadalajara, Montevideo more than 7 times Paysandú, and Montreal just above Toronto (a ratio over 1) before Toronto overtook it.
- Linsky’s conditions explain many cases but have exceptions on both sides.
- Such models are half-truths, yet useful as yardsticks to measure reality, the deviation from it and the causes of the deviation.
- Desirability:
- Primacy is a form of spatial disparity, so planners generally try to discourage it.
- In some circumstances it is desirable: in a small territory with limited resources, spreading investment evenly may duplicate facilities and waste capital.
- Poor countries may accept initial primacy as deliberate imbalance: concentrate scarce resources first, then spread development to reduce disparity over the long term.
Primacy in India
National Level: Multiple Primacy
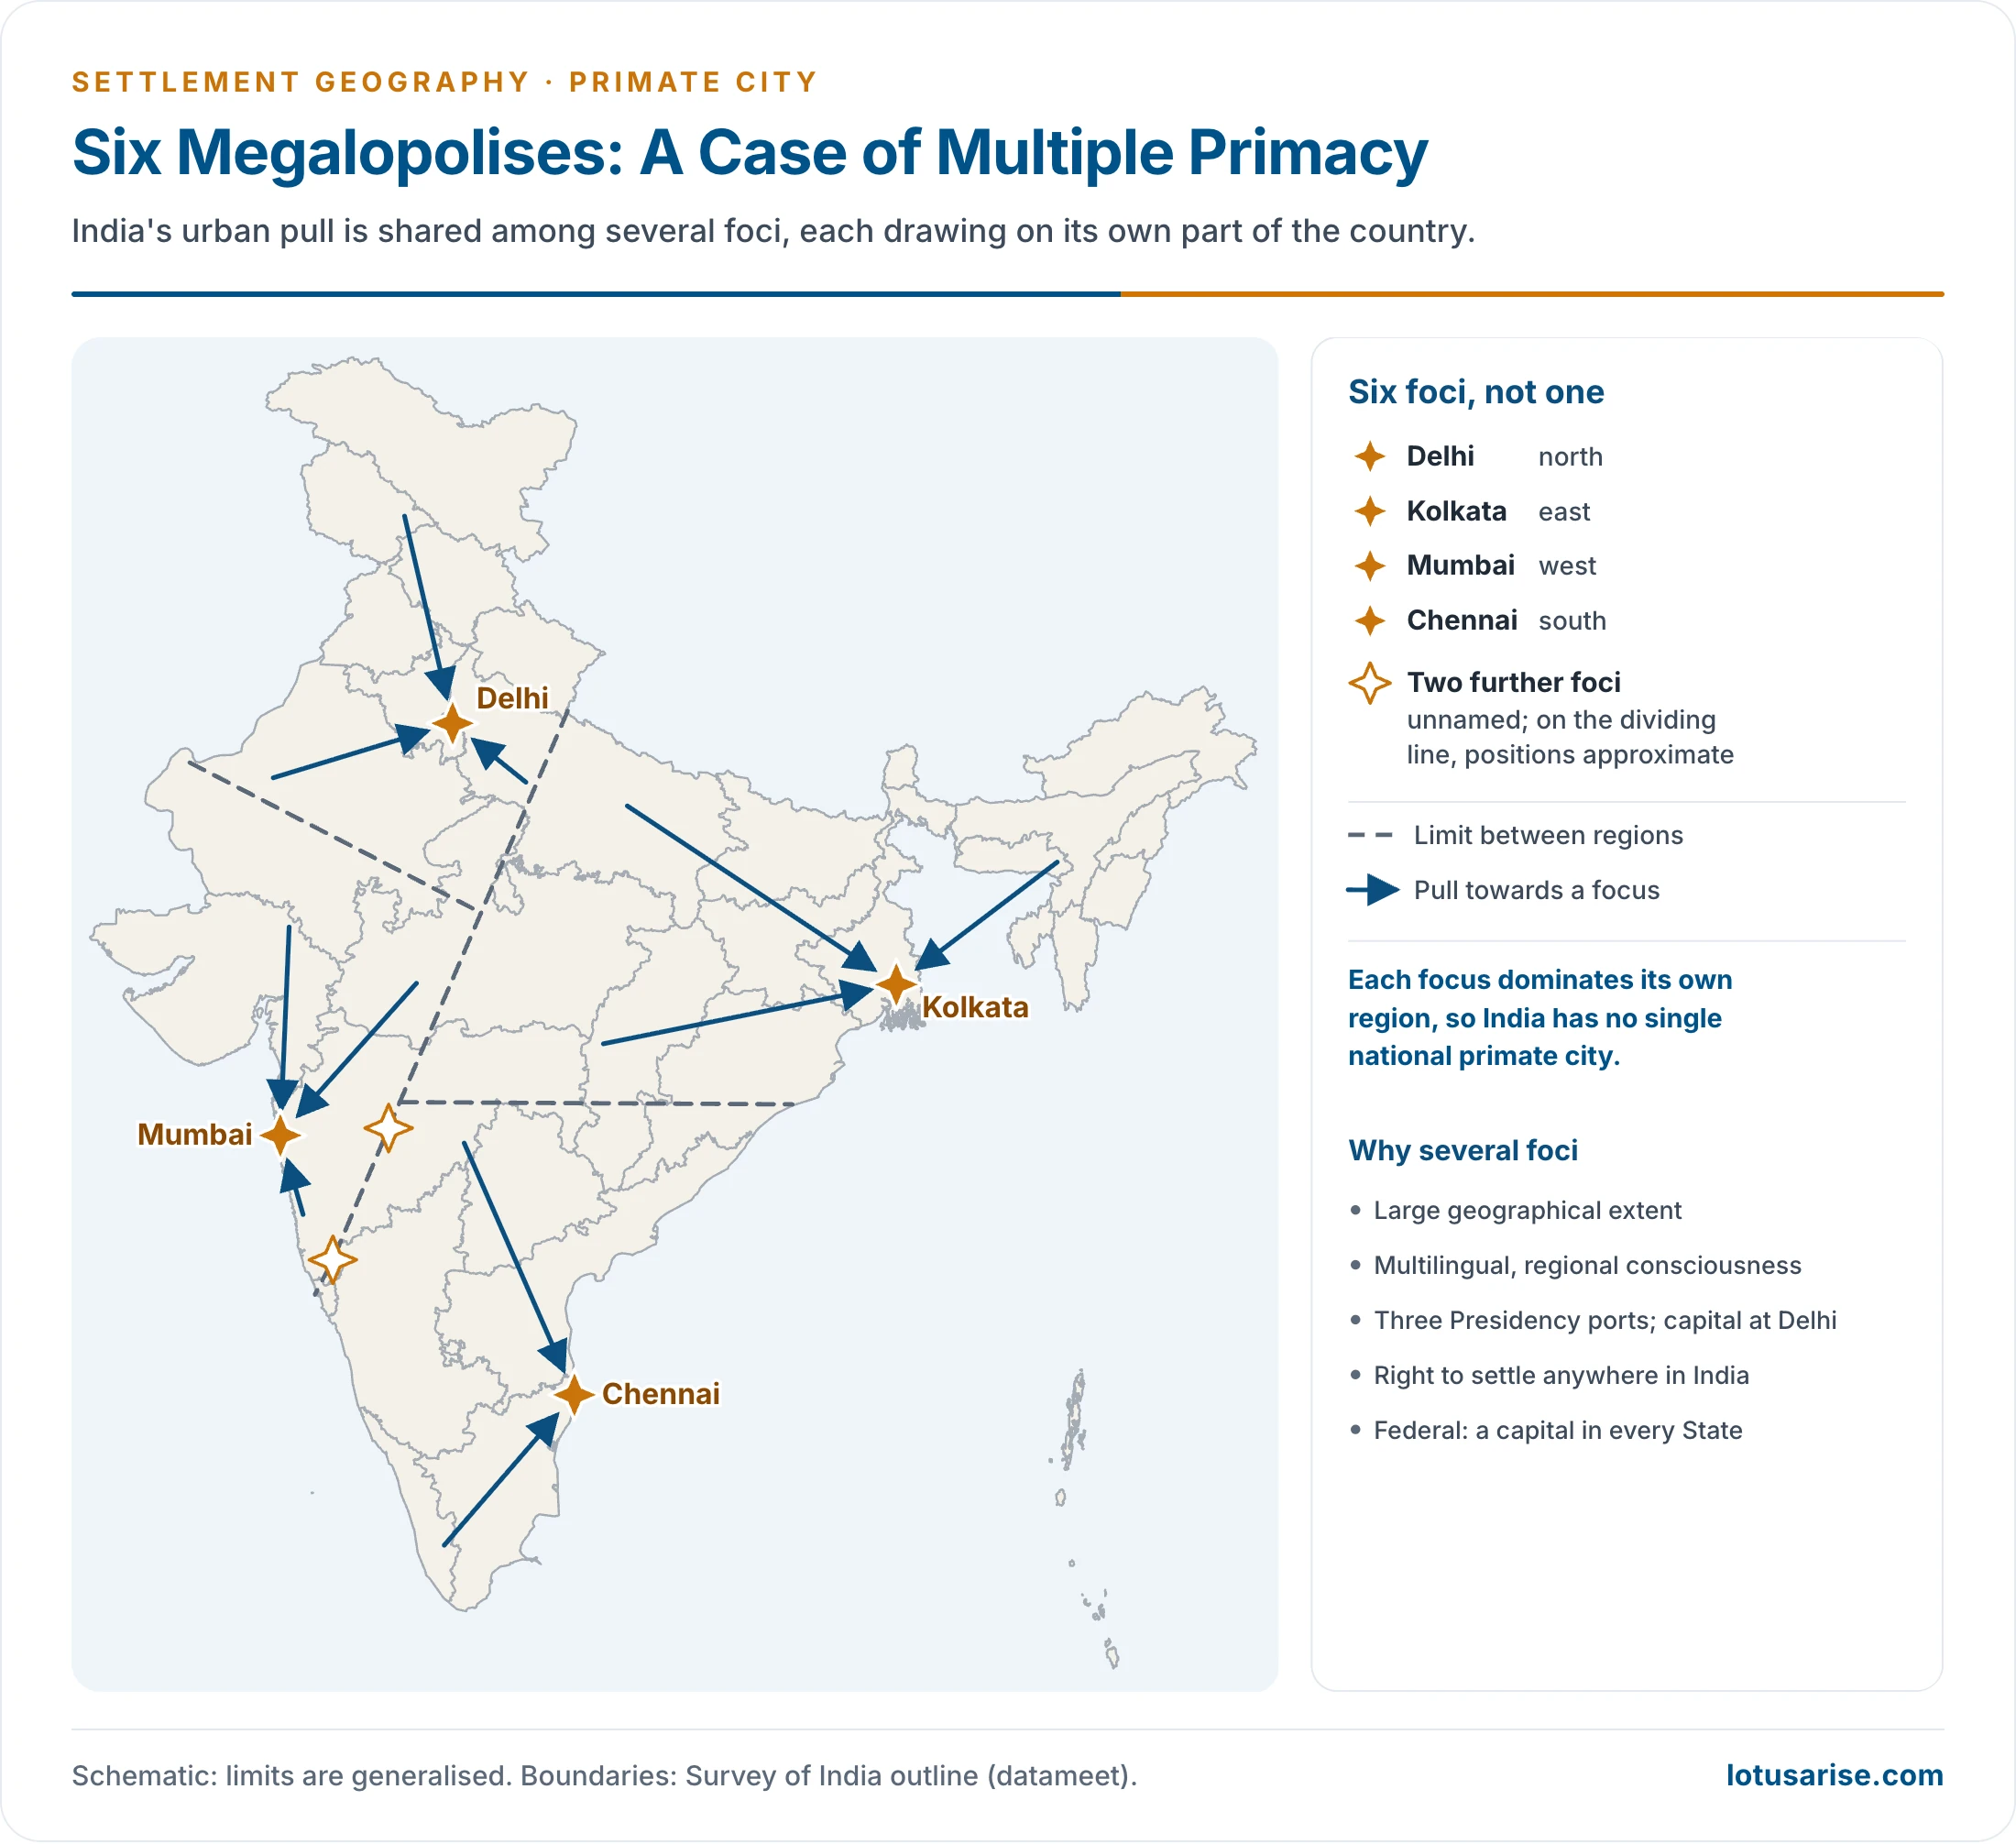
- India has no national primate city. Instead it shows multiple primacy:
- In Census 2011, Greater Mumbai UA (18.4 million) was only about 1.1 times Delhi UA (16.3 million), with Kolkata UA (14.1 million) close behind.
- The UN’s 2025 estimates, which use a uniform satellite-based city definition, put Delhi first, about 1.3 times Kolkata.
- Reasons:
- Large geographical extent and the distance-decay of any one city’s influence.
- A multi-ethnic, multilingual country with strong regional consciousness and linguistic States.
- Colonial history: Bombay, Calcutta and Madras grew simultaneously as port-cum-administrative centres of three Presidencies; Delhi became the capital in 1911.
- Four metropolises in four quadrants, each dominating its own region.
- An older map of multiple primacy shows six such foci rather than four.
- The older ratio of Mumbai to Kolkata was also about 1.1.
- The constitutional right to settle anywhere in India spreads migration among many cities.
- A federal structure, with a capital and a commercial centre in every State.
State Level
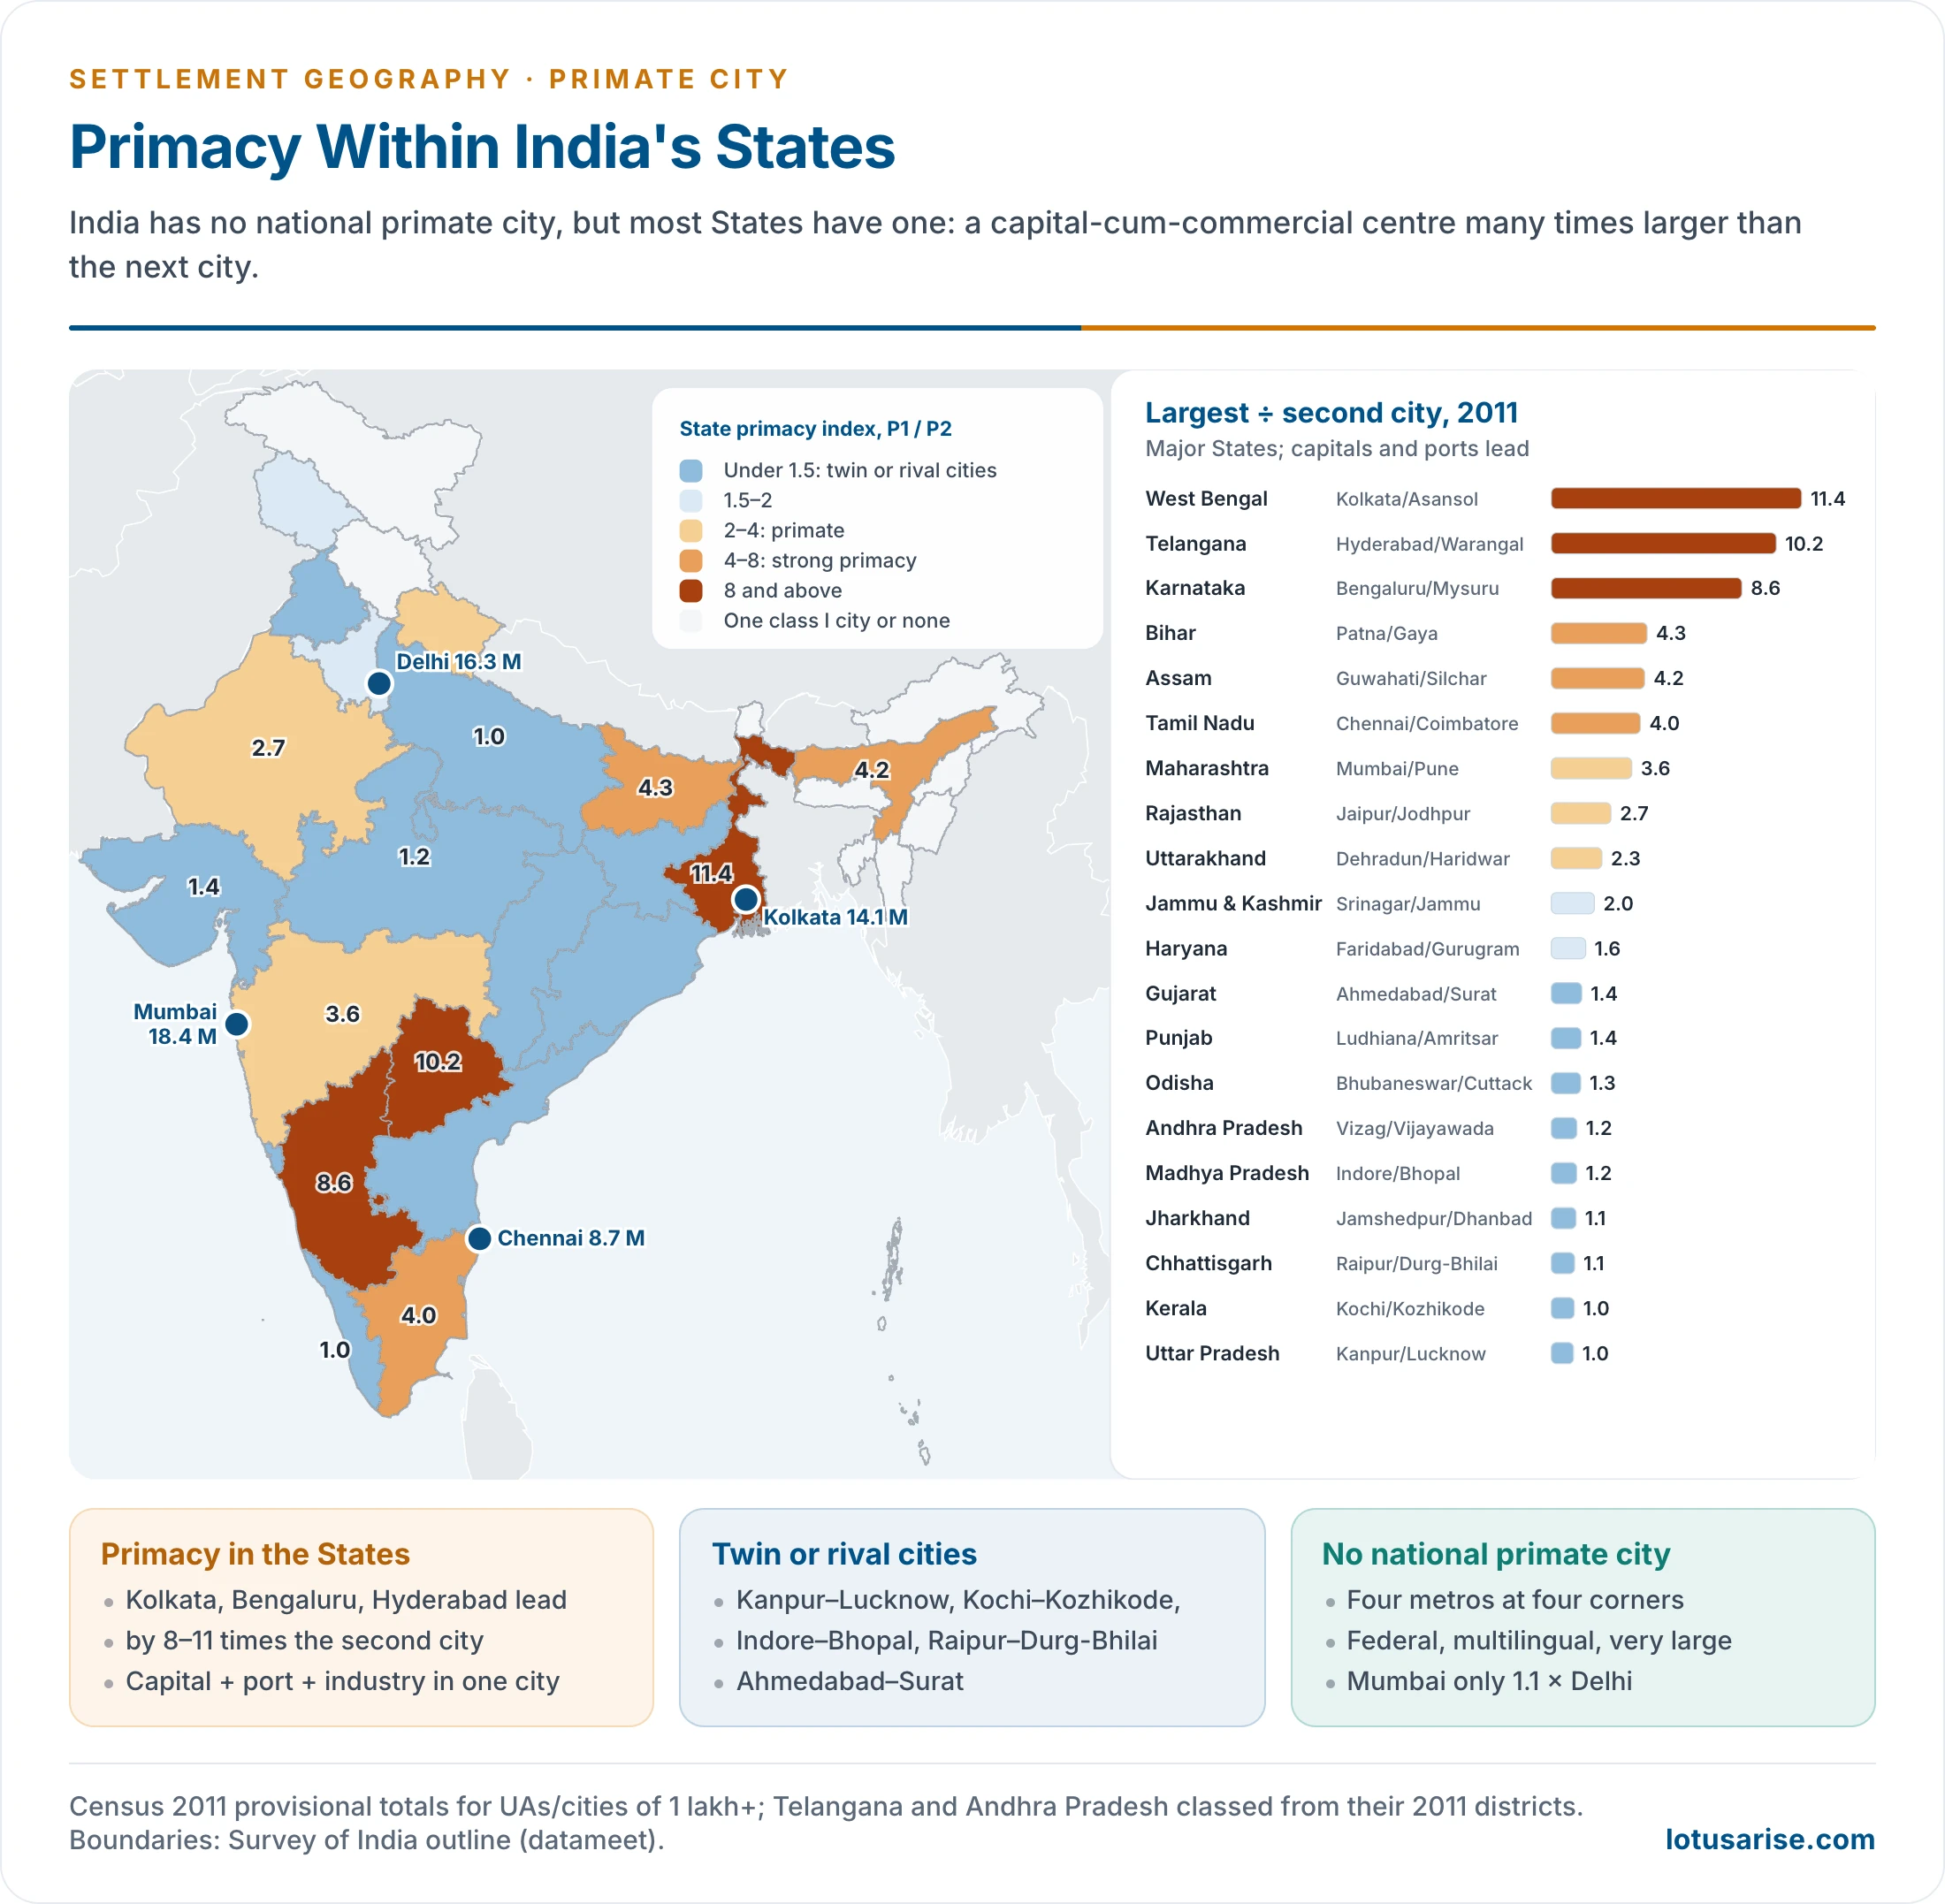
- Primacy is the norm at the State level. State capitals usually act as primate cities (Census 2011, largest UA ÷ second):
- West Bengal: Kolkata about 11 times Asansol.
- Telangana: Hyderabad about 10 times Warangal.
- Karnataka: Bengaluru about 9 times Mysuru.
- Bihar (Patna ÷ Gaya) and Assam (Guwahati ÷ Silchar): over 4.
- Tamil Nadu: Chennai 4 times Coimbatore, but with a strong second tier (Coimbatore, Madurai, Tiruchirappalli, Tiruppur, Salem) that reflects its dispersed development.
- Maharashtra: Mumbai about 3.6 times Pune. Rajasthan: Jaipur about 2.7 times Jodhpur.
- Exceptions with twin or rival cities:
- Uttar Pradesh: Kanpur and Lucknow are almost equal, followed by Ghaziabad, Agra, Varanasi, Meerut and Prayagraj. The State’s size explains the absence of primacy.
- Keralam (Kerala): Kochi, Kozhikode and Thiruvananthapuram are comparable. A narrow coastal plain gives no one region a decisive advantage, and the 2011 redefinition of UAs enlarged all of them.
- Gujarat: Ahmedabad is only about 1.4 times Surat.
- Madhya Pradesh (Indore, Bhopal), Chhattisgarh (Raipur, Durg-Bhilai), Jharkhand (Jamshedpur, Dhanbad, Ranchi) and Punjab (Ludhiana, Amritsar).
- Socio-economic analysis shows a broad tendency: States with older industrialisation and a capital-cum-port or capital-cum-IT city (West Bengal, Karnataka, Telangana, Maharashtra, Tamil Nadu) show greater primacy. Gujarat, with several industrial cities, is the exception.
- An older State-level table, from Qazi Ahmad’s study (1971), read:
- Primacy: West Bengal (Kolkata/Asansol) 5, Bihar (Patna/Gaya) 5, Karnataka (Bengaluru/Mysuru) 4.8, Maharashtra (Mumbai/Pune) 4.5, Andhra Pradesh (Hyderabad/Visakhapatnam) 4.5, Rajasthan (Jaipur/Jodhpur) 4.
- No primacy: Jharkhand (Ranchi/Jamshedpur) 1.4, Punjab (Ludhiana/Amritsar) 1.3.
- Policy responses aim to spread growth below the metros:
- counter-magnet and satellite towns around Delhi under the National Capital Region plans, and Navi Mumbai for Mumbai;
- the Integrated Development of Small and Medium Towns scheme (1979), then AMRUT (2015) and the Smart Cities Mission (2015–2025) for secondary cities;
- industrial corridors that link a chain of cities rather than a single centre.
Rank-Size Rule
Origin and Statement
- In any region small settlements are many and large ones few. There is a gradation from hamlets and villages to towns and metropolises, and the gradation follows a regular pattern.
- The regularity was first noted by the German physicist Felix Auerbach (1913). It was formulated as a law by the American linguist George Kingsley Zipf (1949) in Human Behavior and the Principle of Least Effort.
- It is an idealistic, inductive model based on statistical analysis of the urban centres of many countries.
- It asks two questions:
- Why are higher-order cities fewer than lower-order ones?
- What is the population relationship between cities of different ranks, that is, the urban continuum of a country?
- The largest cities have more and more varied functions and serve much larger areas, so they are few.
- Statement: if all settlements are ranked by population, with the largest as rank 1, then the population of a town multiplied by its rank equals the population of the largest city.
- Equivalently, the population of the nth city is 1/n of the largest city.
- Formula: Pn = P1 / n, where Pn is the population of the city of rank n and P1 that of the largest city.
- The sequence runs P1, P1/2, P1/3, P1/4 … P1/n, or 100 : 50 : 33 : 25 … if the largest city is taken as 100.
- Worked example: if the largest city of a region has 3,00,000 people, the fifth city should have 3,00,000 ÷ 5 = 60,000. The rule thus predicts the expected population of any city wherever it holds.
Graphical Representation
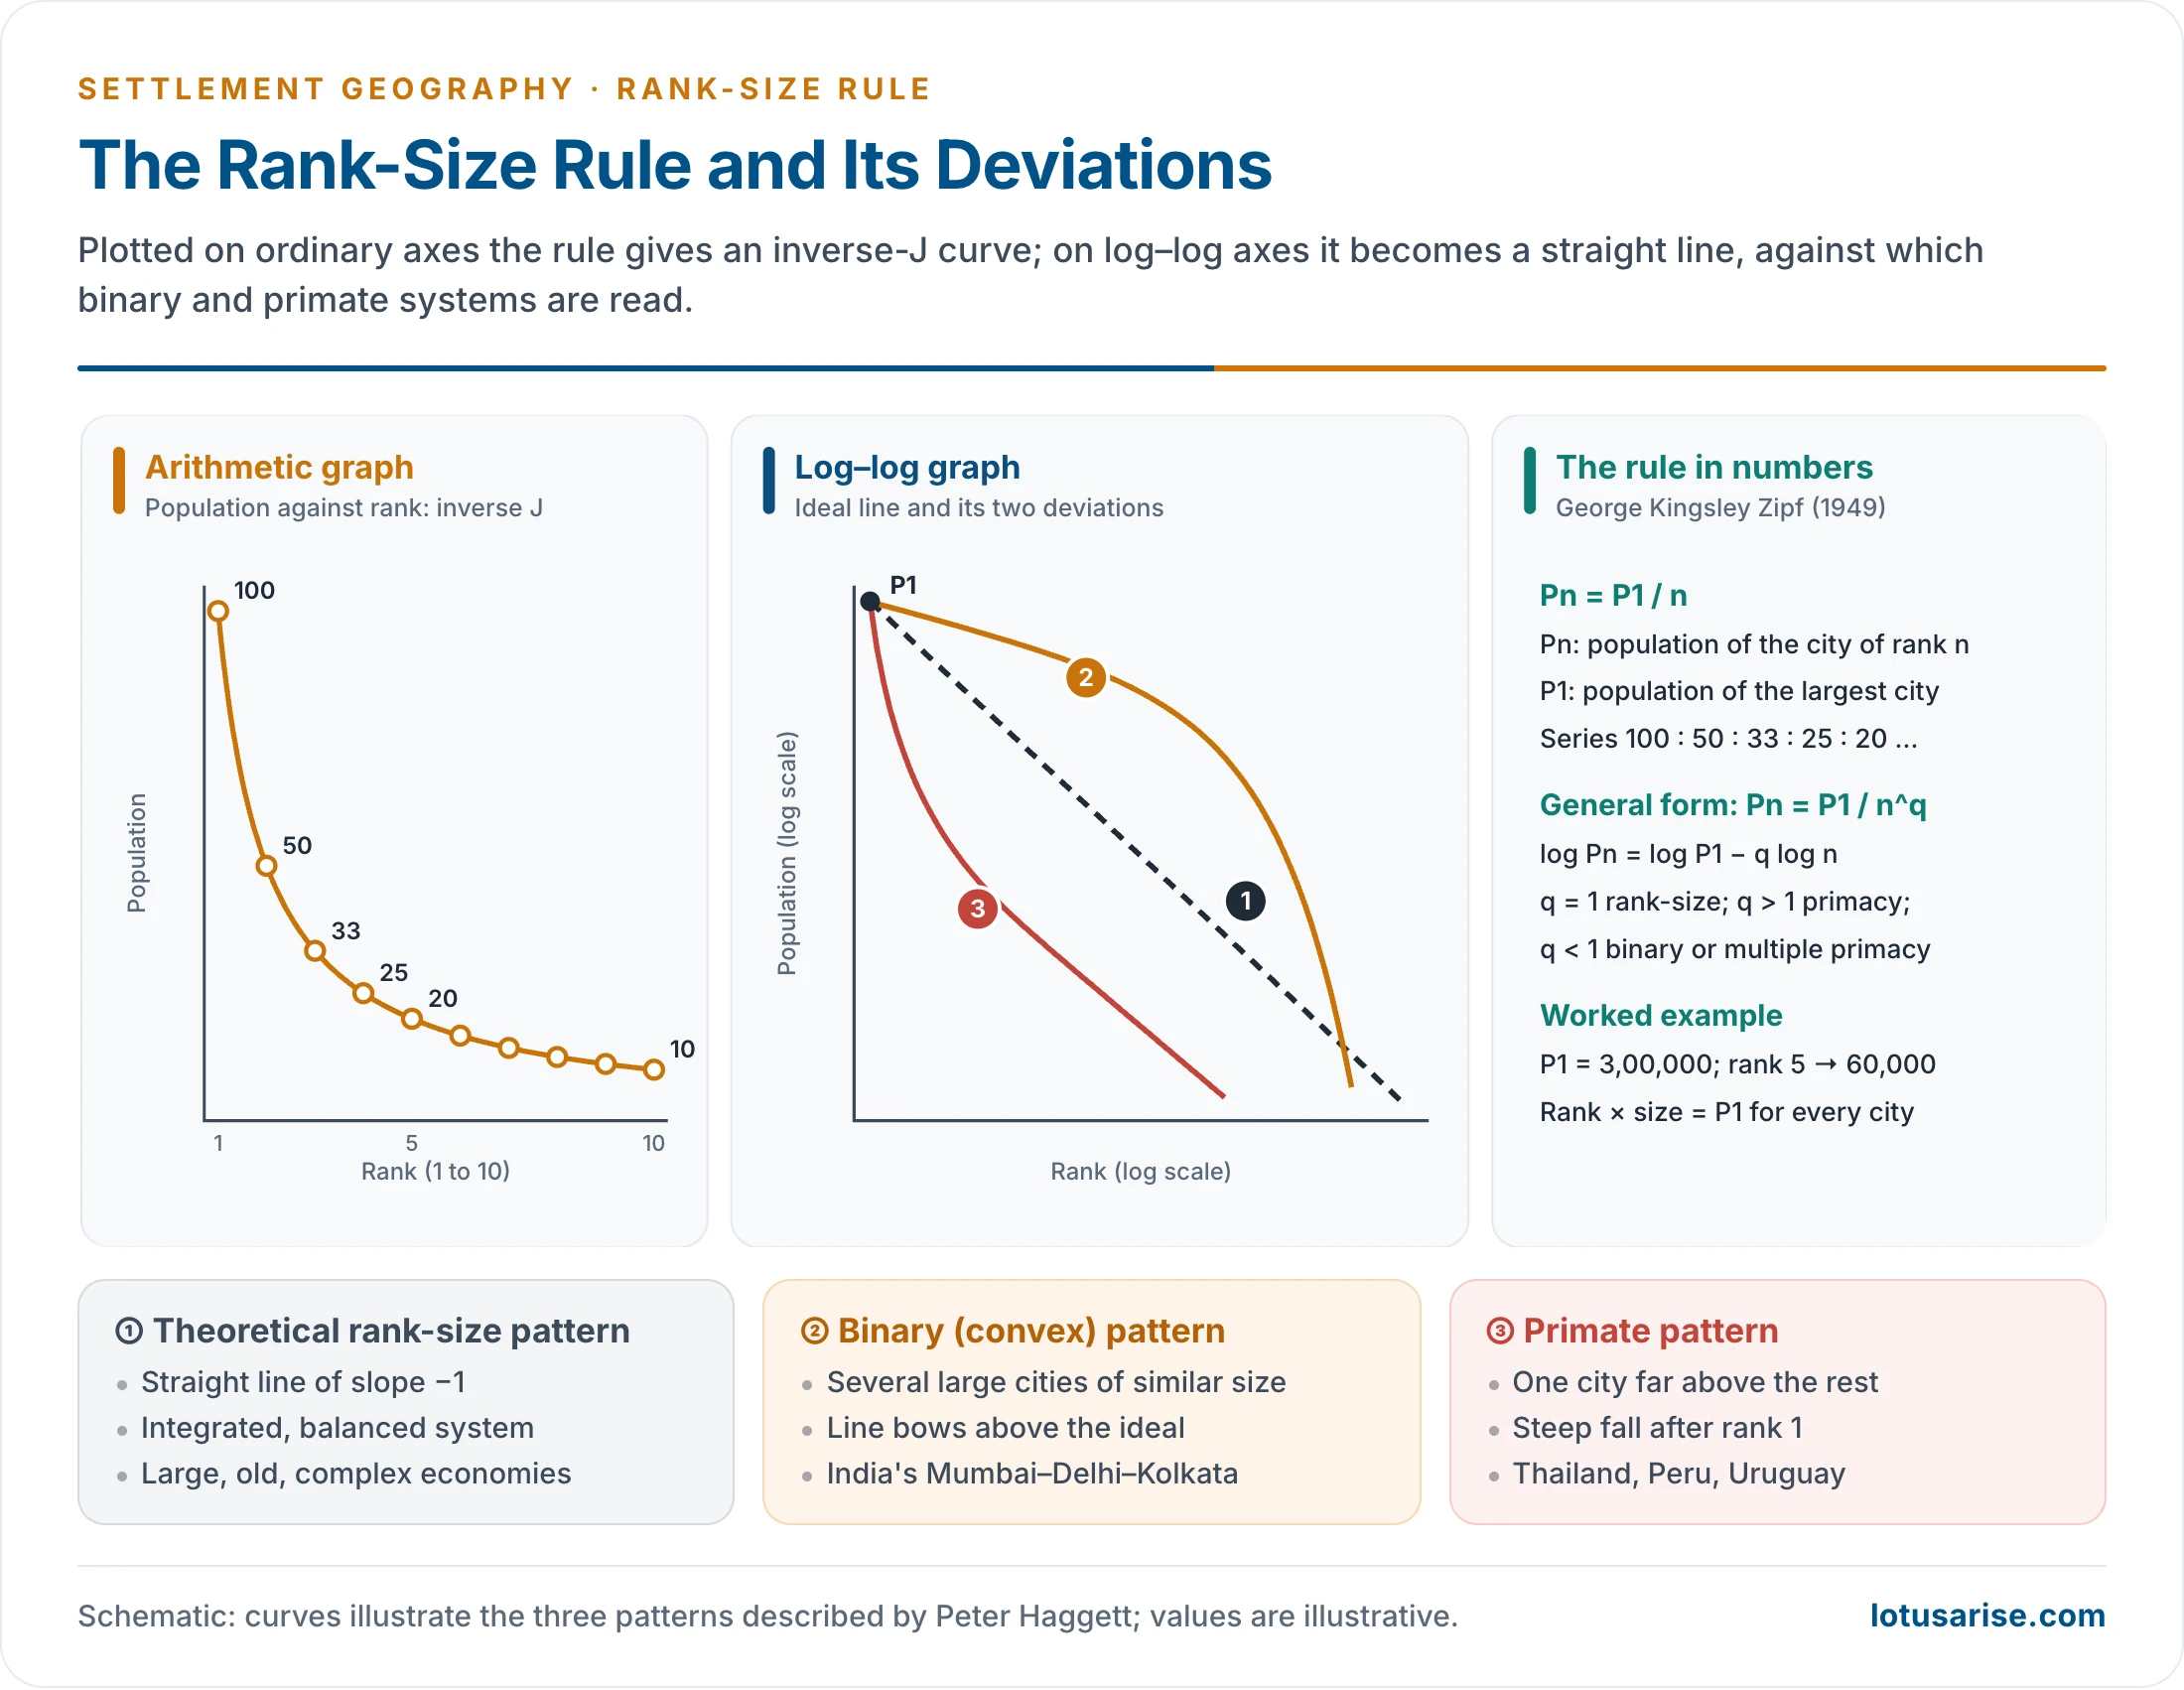
- Arithmetic graph: population against rank on ordinary axes gives an inverse J-shaped curve. Population falls sharply from rank 1 and then flattens.
- Logarithmic graph: on log–log axes the relation becomes a straight line of slope −1, because log Pn = log P1 − log n.
- This line is the theoretical rank-size pattern, the mathematical signature of the rule.
- General form: Pn = P1 / n^q, or log Pn = log P1 − q log n.
- q = 1: perfect rank-size relationship.
- q > 1: a steeper slope, the first city disproportionately large: primacy.
- q < 1: a flatter slope, several large cities of similar size: no primacy or multiple primacy.
- What the graph shows:
- Large cities are few and differ greatly in size; small towns and villages are numerous and of comparable size.
- Zipf’s straight line is a normative ideal. Real distributions deviate from it.
Deviations from the Rule: Haggett’s Three Patterns
- Under heterogeneous conditions the rank-size relationship is distorted. Peter Haggett identified three patterns on the log–log graph:
- Theoretical rank-size pattern: a straight diagonal line. It represents an integrated, balanced urban system and is possible only under fairly homogeneous conditions.
- Binary (convex) pattern: a few large cities of about the same size create a flat upper section before the curve drops. The curve lies above the ideal line.
- Indian examples: Mumbai, Delhi and Kolkata nationally; Kanpur and Lucknow in Uttar Pradesh; Jamshedpur, Dhanbad and Ranchi, cities of industry and mining, in Jharkhand; planned townships such as Rourkela and Jamshedpur at the head of their regional hierarchies.
- Primate pattern: one city is very large, followed by a sharp fall to many smaller towns of similar size. The curve falls steeply below the line after rank 1.
- Indian example: Kolkata, with its concentration of industrial, commercial and service functions, dominates the hierarchy of West Bengal and much of eastern India.
- The binary pattern results from forces that create several large cities (multiple colonial ports, industrial decentralisation, federal capitals). The primate pattern results from the concentration of economic and political power in one city.
- Jefferson’s primate city is therefore a special case of the rank-size rule.
Explanations of the Rule
- Zipf: forces of diversification and unification. The rule is a balance between two opposing forces.
- Diversification: farming, fishing and forest communities must stay near their resources, so population splits into many small, dispersed settlements that use the resource base with the least travel.
- Unification: manufacturing and services need to concentrate people to minimise the movement of goods and services to consumers, so large settlements form.
- The size of the larger cities varies with the strength of unification. In the ideal equilibrium between the two forces, a rank-size relationship results.
- Herbert A. Simon (1955): a stochastic explanation, developed by Brian Berry and William Garrison (1958).
- The rank-size relationship results from a large number of random, independent decisions by people about where to live.
- Simon treated the straight log–log line as the equilibrium of a general growth process of the urban system.
- The rule is thus best seen as an average condition of urbanisation. Deviations from it open questions that need geographical explanation.
- Berry (1961): rank-size distributions arise where many forces act on a large, long-urbanised and complex system; primacy where a few strong forces act on a small or simple one.
- Central place links: a stepped central place hierarchy becomes a smooth continuum when many regional hierarchies are added together. Rank-size is therefore compatible with Walter Christaller’s levels.
The Rule Tested with Real Data
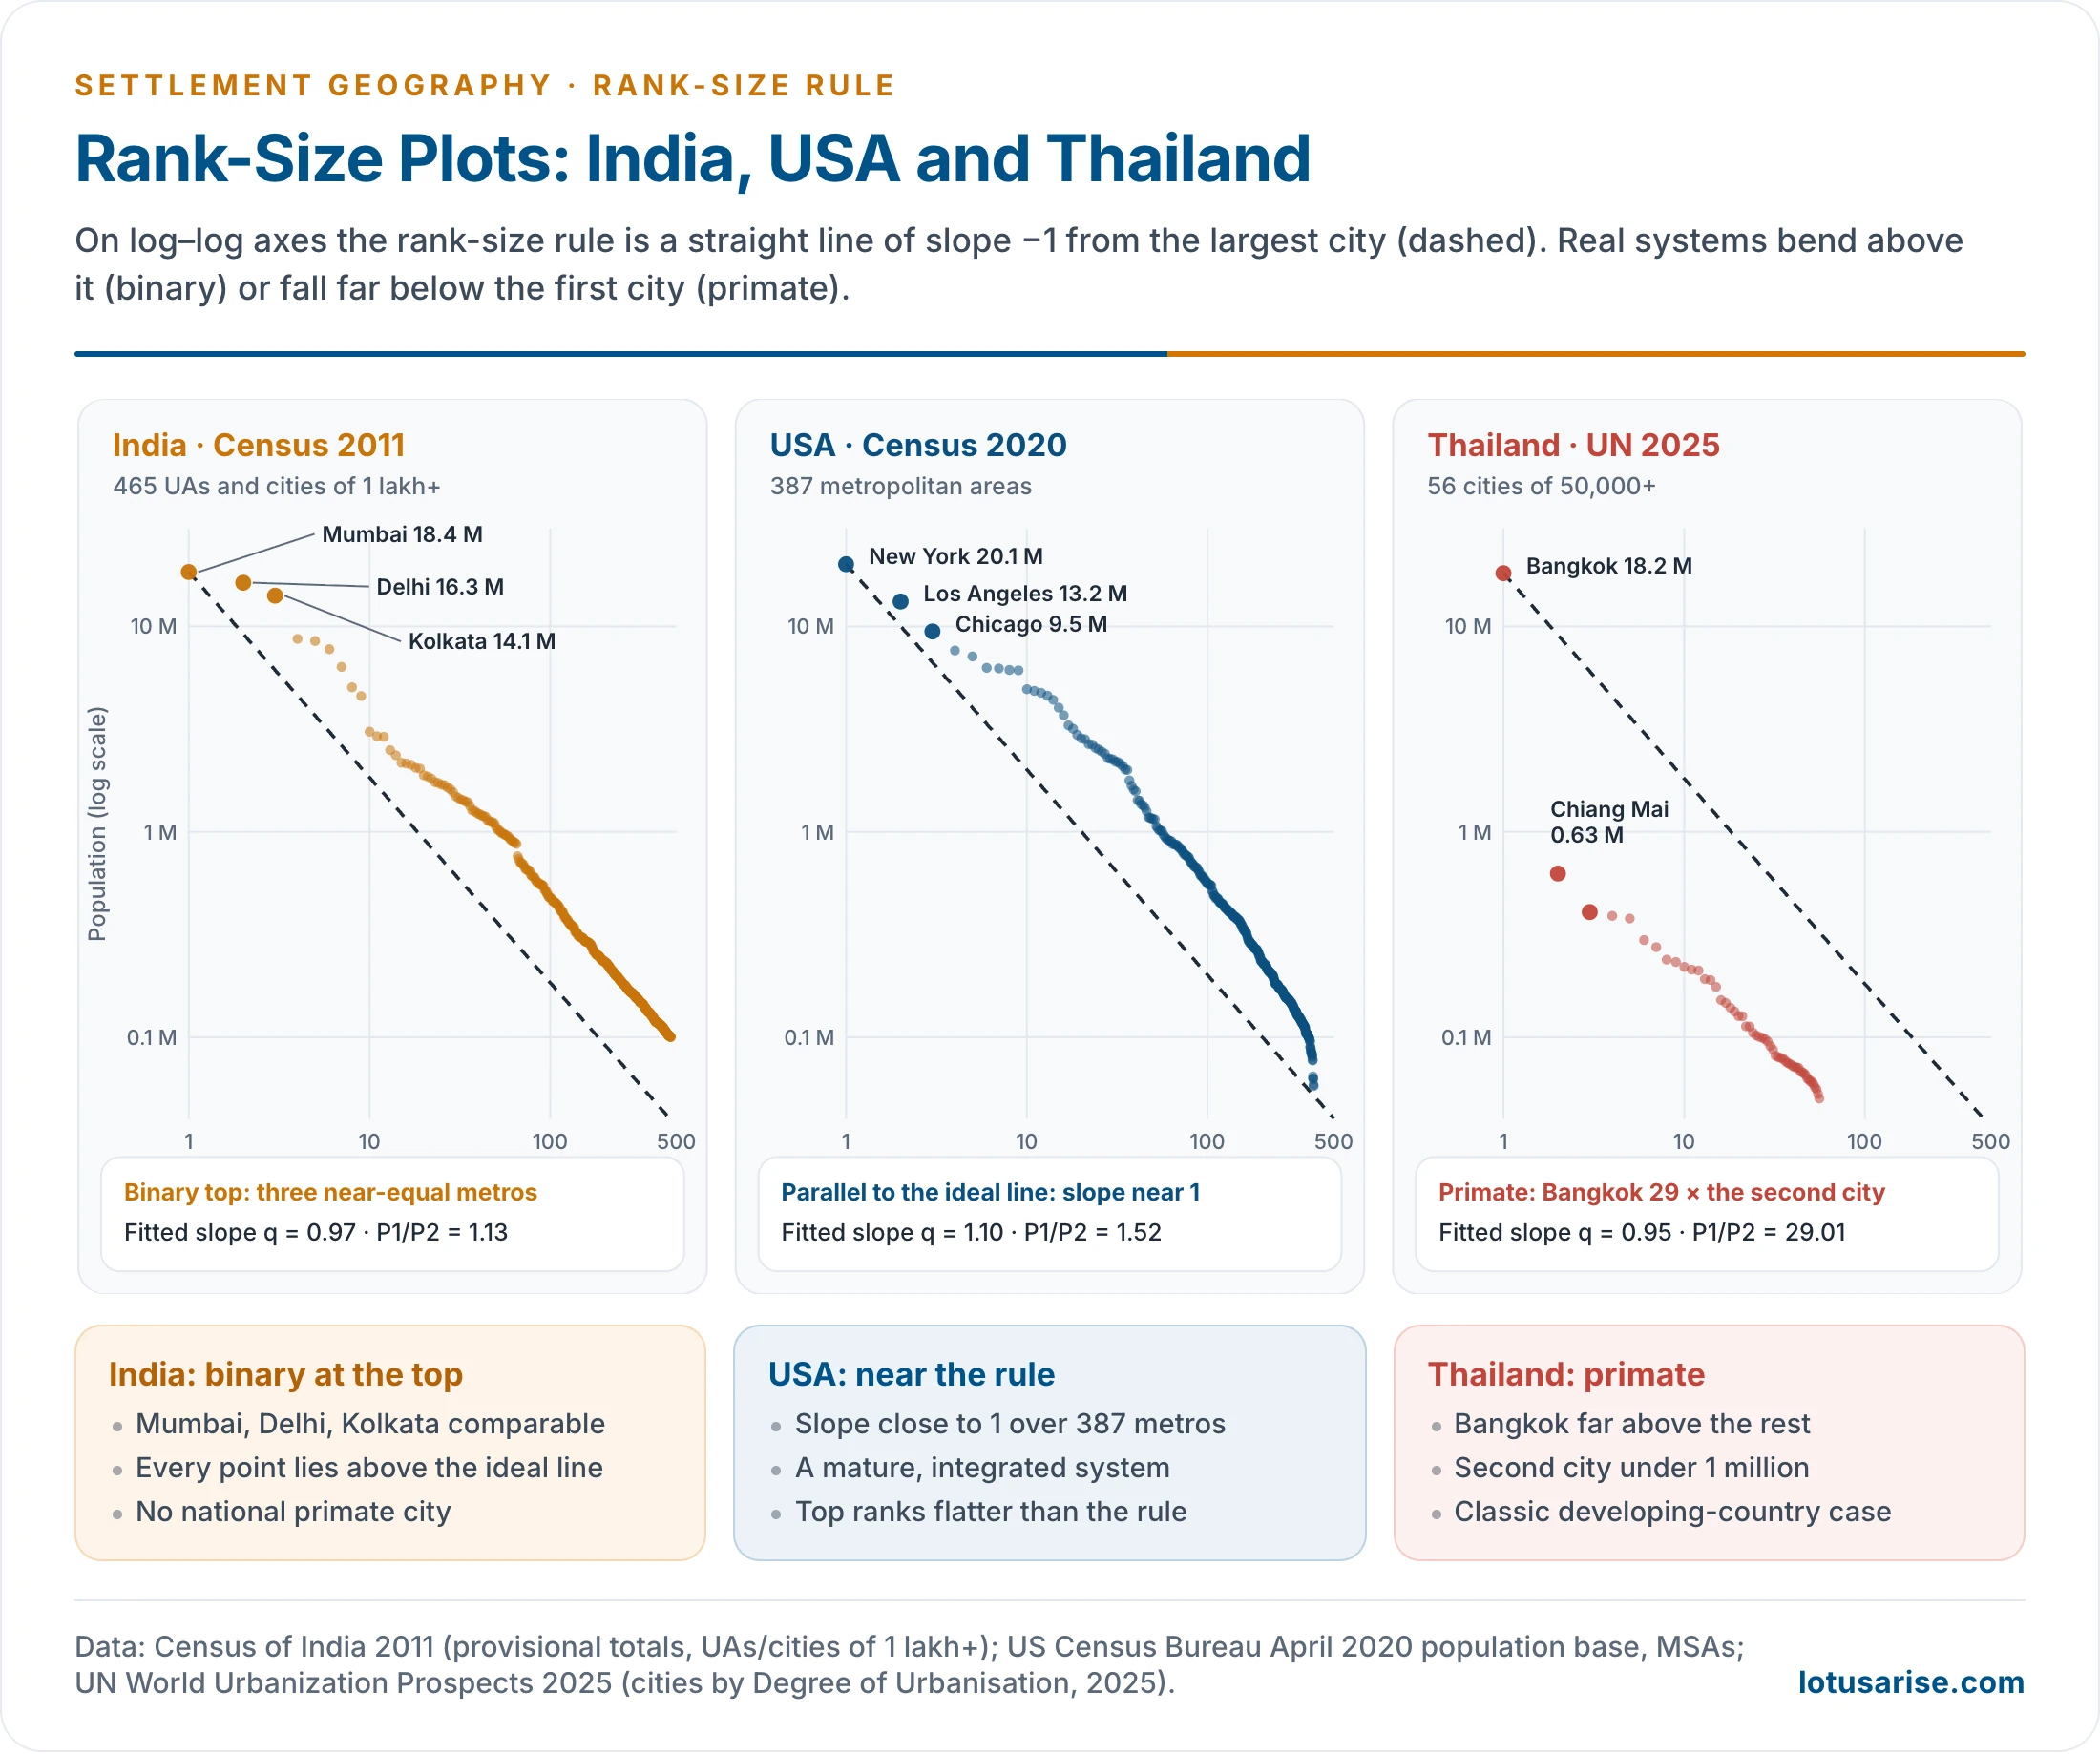
- USA (Census 2020, 387 metropolitan areas): the fitted slope is about 1.1, close to the ideal. The top ranks are flatter: New York (20.1 million) is about 1.5 times Los Angeles (13.2 million).
- Thailand (UN 2025, 56 cities): Bangkok (about 18 million) is about 29 times Chiang Mai. The rest of the system lies far below the line drawn from Bangkok, a classic primate pattern.
- India (Census 2011, 465 UAs and cities of 1 lakh+): the overall slope is about 1.0, but the top is binary.
- The rule predicts Delhi at about 9.2 million and Kolkata at about 6.1 million, against actual populations of 16.3 and 14.1 million.
- Every Class I city is larger than the rule predicts. Each point lies above the ideal line.
Rank-Size Rule in India
- National level: the rule fails at the top. Mumbai, Delhi and Kolkata are of nearly the same size, against the rule’s expectation that the second city should be half the first.
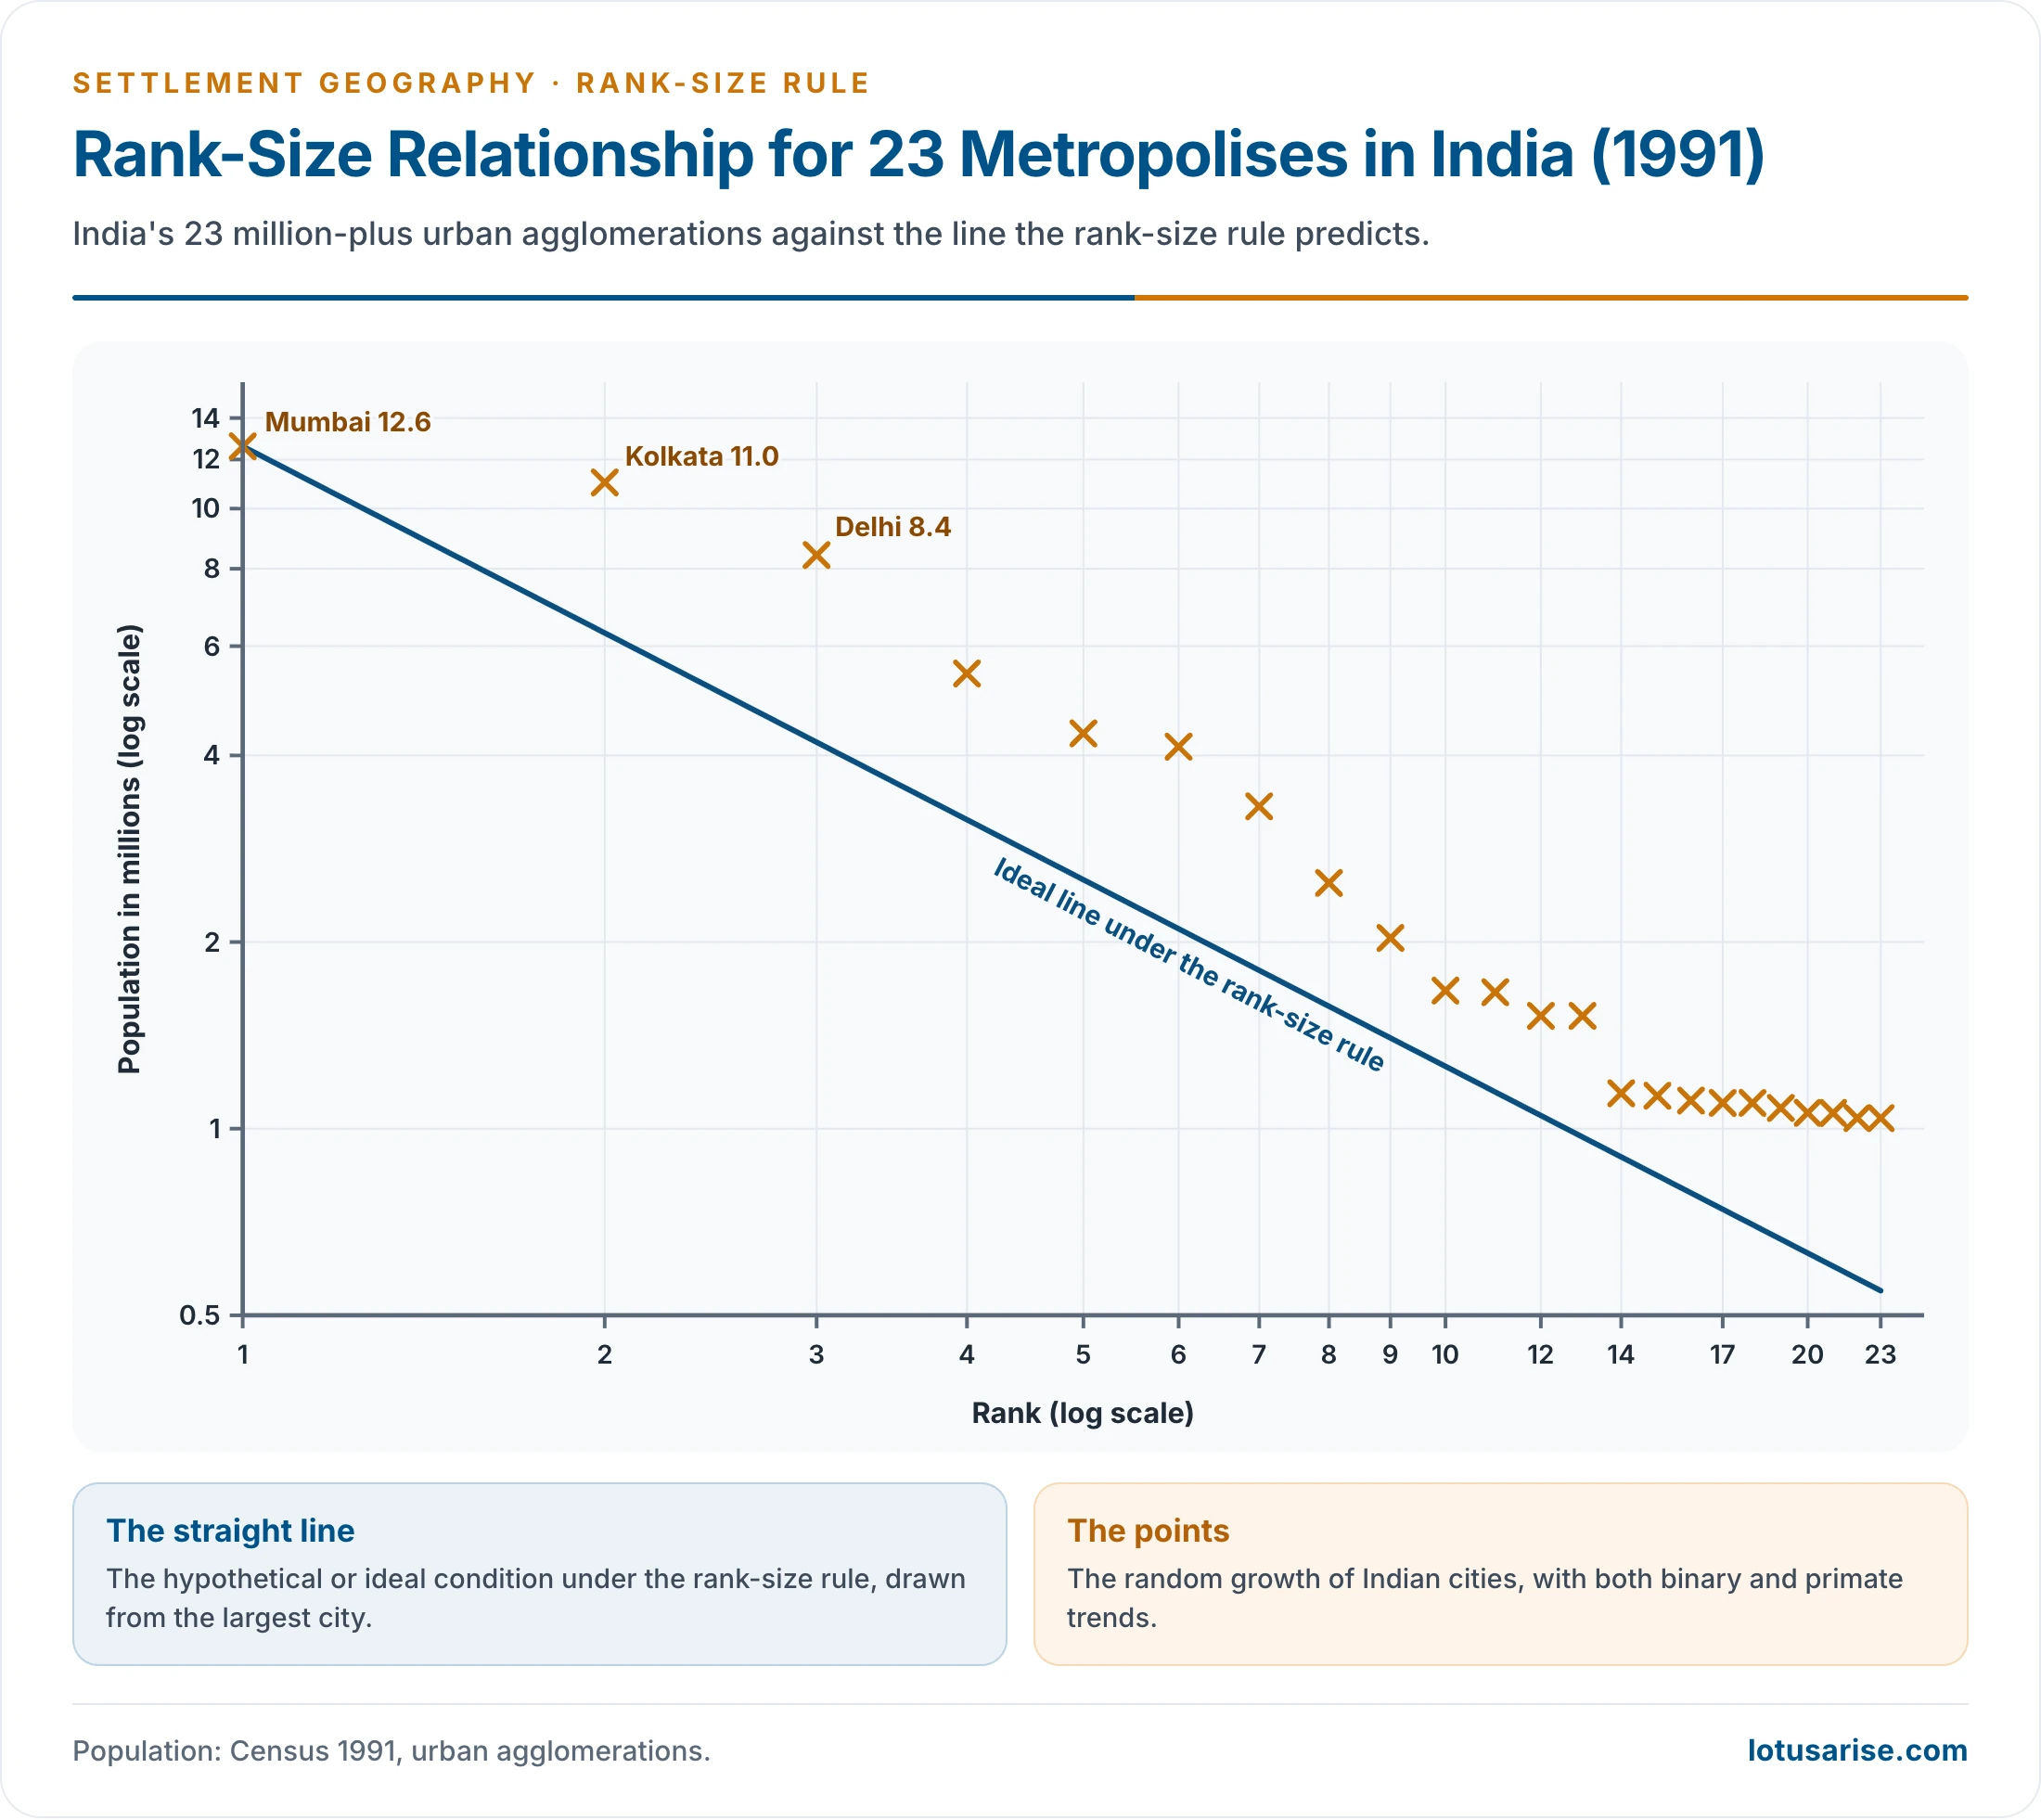
- A plot of India’s 23 metropolises of 1991 already showed both binary and primate trends at once.
- The lead has also rotated. Kolkata was the largest city until the 1981 Census; Mumbai led from 1991 (12.6 million against Kolkata’s 11.0 million); Delhi grew fastest, from 8.4 million in 1991 to 16.3 million in 2011.
- State level: R. Ramachandran (1989) found that most States do not conform.
- Primacy existed in at least 15 States. In others the leading city was barely larger than the second.
- Only a few, notably Rajasthan, approached a rank-size distribution.
- Older summaries of this study name Rajasthan, Uttar Pradesh and Haryana as the three States where the rule holds, on 1981 data.
- Qazi Ahmad grouped the States too: those with no primacy, such as Punjab, Uttar Pradesh, Haryana and Keralam, follow the rule; at the national level multiple primacy rules it out.
- India’s urban system is heterogeneous, a product of colonial history, regional diversity and uneven industrialisation.
- Recent change: the rapid growth of Bengaluru, Hyderabad, Pune, Surat and Ahmedabad is filling the upper-middle ranks. This flattens the hierarchy without creating a single dominant city.
- The next census, delayed from 2021, will test this. Its houselisting phase ran in 2026 and population enumeration has a reference date of 1 March 2027.
Rank-Size Rule and the Nearest-Neighbour Index
- Settlement patterns are measured in two complementary ways:
- the rank-size rule measures the size hierarchy of urban centres;
- the nearest-neighbour index (Philip J. Clark and Francis C. Evans, 1954) measures the spacing of settlements, especially the patterns of rural settlement: clustered, random or uniform.
- Applying the rule: rank all towns above a size cut-off; compute the expected size P1/n for each; plot actual and expected values on log–log paper; fit the slope q by regression; and read the deviations (binary top, primate first city, missing middle ranks).
- Used together they describe a settlement system vertically (how large) and horizontally (how spaced).
- A uniform spacing with a smooth rank-size gradation suggests an integrated, central-place type system.
- Clustering around one dominant centre with a primate distribution suggests a polarised system.
| Measure | What it measures | Formula | Reading |
|---|---|---|---|
| Rank-size rule | Size distribution of cities | Pn = P1 / n^q | q = 1 balanced; q > 1 primate; q < 1 binary |
| Primacy index | Dominance of the first city | P1 / P2; P1 / (P2 + P3 + P4) | Above 2 (or 1) = primacy |
| Nearest-neighbour index | Spacing of settlements | R = 2 × mean distance × √(N/A) | 0 clustered; 1 random; 2.15 uniform |
Significance and Limitations
- Significance:
- Diagnostic tool: shows whether an urban hierarchy is balanced or distorted.
- Planning: deviations show where policy is needed, for example to reduce primacy or promote intermediate cities.
- Integration indicator: a country close to the rule has a well-integrated urban system with smooth functional links.
- Comparison of urban systems across countries, regions and periods.
- Simplicity: the formula Pn = P1/n is easy to apply to any data set.
- Limitations:
- Not universal: in Berry’s 1961 study only 13 of 38 countries followed it (13 of 37 in the count usually credited to Berry and Horton).
- Inductive, not deductive: without a theoretical base it becomes a mere statistical exercise.
- Ignores history and culture: colonial legacies, political centralisation and cultural factors shape city sizes, as in India.
- Static: it describes a moment and cannot capture how systems evolve.
- Sensitive to definitions: results change with the boundary used (municipal city, urban agglomeration, metropolitan area or satellite-defined city) and with the population cut-off.
- Fails for heterogeneous systems: large, diverse countries with regional disparities and many language regions rarely fit it.
- Does not explain outliers: cities far above or below the line are left unexplained, and the rigid form rarely holds exactly anywhere.
- Conclusion: the rule has no universal application, but it is a yardstick of the functional integration of urban centres and of a country’s development of transport, communication and industry.
Primate City and Rank-Size Rule Compared
| Basis | Primate city | Rank-size rule |
|---|---|---|
| Proponent | Mark Jefferson (1939) | Felix Auerbach (1913), G. K. Zipf (1949) |
| Concern | Relation of the first and second cities | All the cities of a system |
| Condition | P1 more than twice P2 | Pn = P1 / n; P2 = P1 / 2 |
| Forces | Agglomeration, concentration, centripetal | Decentralisation, diffusion, dispersal; centrifugal |
| Typical setting | Small, centralised, often former colonies | Large, old, industrialised, well-connected countries |
| Development reading | Uneven development; early stage | Integrated, mature system |
| Nature | Empirical, closer to observed cases | Idealised, rarely matched exactly |
| Type of theory | Sociological: development, ethnicity, political unification | Economic: industrialisation and many urban centres |
| Colonial history | Former colonies of imperial powers | Often former imperial powers themselves |
| Log–log graph | Steep fall after rank 1 | Straight line of slope −1 |
- The two are not opposites. Primacy is a deviation from the rank-size line, so the concept of the primate city is implicit in the rank-size rule.
- India shows a balance of the two forces, centripetal and centrifugal, a kind of dynamic equilibrium.
- Both treat the urban system as a whole and read its shape as evidence of economic integration, political organisation and historical experience.
Previous Year Questions
1999Write short note: Primate city.2000Short note: Rank- Size Rule.2005Write short note: Concept of primate city.2006In urban geography, what are the concepts of primate city and Rank Size Rule? Discuss in detail.2008Write short note on primate cities.2022Discuss the concept of ‘Rank-Size-Rule’ given by G.K. Zipf. Is this rule relevant in Indian context?2025Critically evaluate the role of primate cities in dominating the urban spheres of influence in developing countries.2026Analyse the measuring patterns of settlement in relation to the Nearest Neighbour Index and Rank-Size-Rule in detail.





Sir Are you an upsc aspirant or geography phd? your notes seem to be good enough. looks u have cleared mains
UPSC Aspirant 🙂
Well done. You will clear this time.
Thanks 🙂
The last diagram case 1 and case 2 given wrong, they have been mistakenly altered.
Thank You Ravinder for pointing out the mistake, I have corrected the same. Keep reading.
Case 1 and case 2 are right , just the example of India, will be case 1 . DMKC are primate cities at upper hierarchy
T
thank u so much
That is great
SIR ARE THERE ANY VIDEO LECTURES OF YOURS
No
Then how can we connect with you