

Functional Classification

- The functional classification of settlements organises towns and cities on the basis of the dominant economic activities they perform — manufacturing, trade, administration, defence, education, religion, recreation, and so on.
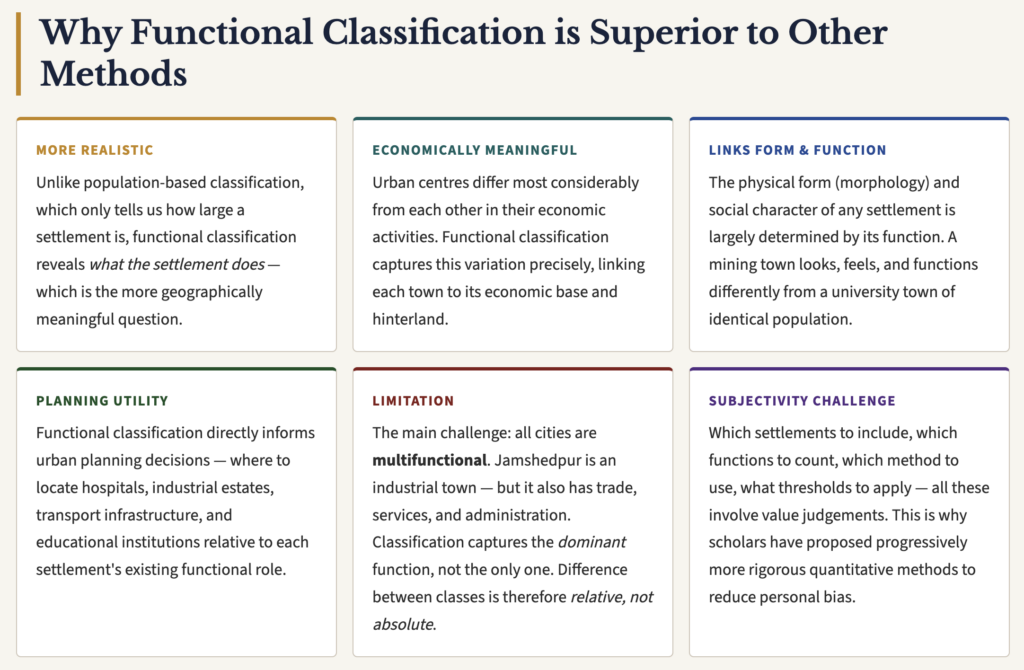
- It is widely regarded as the most realistic and meaningful basis for classifying urban settlements because it is with respect to economic activities that urban centres vary most considerably from each other.
- Settlements may be classified on many bases — population size, location, spatial pattern, or historical origin. But none of these reveals why a settlement exists, what role it plays in the regional and national economy, or what services it provides to its hinterland. Functional classification answers these questions directly.
- The physical form and social character of any settlement is largely determined by the type and complexity of functions it performs.
- Cities are usually multifunctional and differ greatly from towns with fewer functions, or from villages with even fewer.
- As settlements grow in size, they become more complex and multifunctional – making clear-cut functional categorisation increasingly difficult.
- The main challenge in functional classification is assigning each settlement to a specific group – the criteria used, functions considered, and interpretations applied are all value judgements of the scholar, introducing some degree of subjectivity.
- Since urban settlements offer a wider range of functions, most scholars have focused their classification efforts primarily on urban centres rather than rural ones.
Methods of Functional Classification
Since the last forty years of the twentieth century, the schemes of functional classification have become progressively more comprehensive and statistically sophisticated. Three broad categories of methods have been developed:
| Category | Nature | Key Scholars | Basis | Limitation |
|---|---|---|---|---|
| Qualitative Methods | Empirical, non-statistical | Aurousseau (1921), Griffith Taylor (1949), Mumford (1938) | Personal observation and description | Subjective; no standard criteria; country/time specific |
| Qualitative-cum-Quantitative | Transitional; uses occupational data but arbitrary thresholds | Harris (1943), Ogburn (1937) | Census occupational and employment data | Qualifying percentages arbitrarily chosen |
| Quantitative (Statistical) | Purely statistical; objective and replicable | Nelson (1955), Webb (1959), Pownall (1953), Alexandersson (1956) | Standard deviation, location quotient, surplus workers index | Requires substantial reworking for application outside original country |
1. Qualitative Methods — The Empirical Stage
- Qualitative methods constitute the initial stage in functional analysis of settlements. They are empirical and non-statistical — based on the direct observation and descriptive judgement of the scholar.
- Though subjective and now considered inadequate as standalone tools, these methods provided the conceptual scaffolding upon which later statistical methods were built.
Aurousseau’s Classification (1921) — The First Major Scheme
- Marcel Aurousseau, in his paper “The Distribution of Population — A Constructive Problem” (Geographical Review, Vol. XI, 1921), was the first scholar to systematically classify towns by function.
- He proposed six broad classes further subdivided into 28 sub-types:
| Class | Sub-Types |
|---|---|
| I. Administration | Revenue Towns, Capital Cities |
| II. Defence | Garrison Towns, Naval Bases |
| III. Culture | University Towns, Cathedral Towns, Art Centres, Pilgrimage Centres, Religious Centres |
| IV. Production | Manufacturing Towns, Collection (Mining, Fishing, Forest, Depot Towns) |
| V. Communication | Transfer (Market Towns, Fall Line Towns, Break-of-Bulk Towns, Bridgehead Towns, Tidal Limit Towns, Navigation Head Towns), Distribution (Export, Import, Supply Towns) |
| VI. Recreation | Health Resorts, Tourist Resorts, Holiday Resorts |
Merits of Aurousseau’s Classification
- First comprehensive scheme bringing diverse ideas into one framework — provided the “springboard for new methods” of functional classification.
- Simple, intuitive, and easy to apply without complex statistical tools.
- Covers a wide range of urban functions including cultural, recreational, and defence roles often ignored in purely economic classifications.
Criticisms of Aurousseau’s Classification
- Over-generalised — the six classes are too broad to capture the nuanced differences between cities.
- To classify a town into one major category, the cut-off point of one class has been decided by an arbitrary percentage, and therefore, it is subjective.
- Some classes are specific to particular countries at particular points of time — e.g., “Fall Line Towns” and “Break-of-Bulk Towns” were characteristic of early 20th century USA and rare elsewhere.
- Neglects economic activities entirely — makes no use of occupational or employment data.
- Mixes functional and locational terms — for example, “Tidal Limit Town” grouped under communication is a locational term, not a functional one.
- Purely based on personal observation — different scholars applying the same scheme may reach different conclusions for the same city.
2. Qualitative-cum-Quantitative Methods — The Transitional Stage
- These methods mark a transitional stage between the earlier purely qualitative methods and the later purely statistical ones.
- They use occupational and employment data from census records — establishing a clear link between settlement functions and occupational groups — but the qualifying thresholds and minimum limits are often selected arbitrarily by the scholar, retaining an element of subjectivity.
Ogburn’s Classification (1937)
- One of the earliest attempts to introduce quantitative data into functional classification.
- Classified towns on the basis of the percentage of population engaged in trade, manufacturing, and transportation.
- Primarily descriptive; percentages used were not rigorously derived from statistical analysis.
C.D. Harris’s Classification (1943) — The Most Widely Accepted in This Category
- Chauncy D. Harris presented “A Functional Classification of Cities in the United States” published in the Geographical Review in 1943. This remains the most widely accepted method in the qualitative-cum-quantitative category.
- Based on his study of 984 towns with populations of 10,000 and above in the United States, using 1930 Census data.
- Harris relied on two sets of information: occupation figures (what people say they do) and employment figures (what establishments say they employ).
- He preferred employment figures to occupation figures — to avoid including informal workers such as carpenters and plumbers in the manufacturing category.
- He identified nine principal categories of towns.
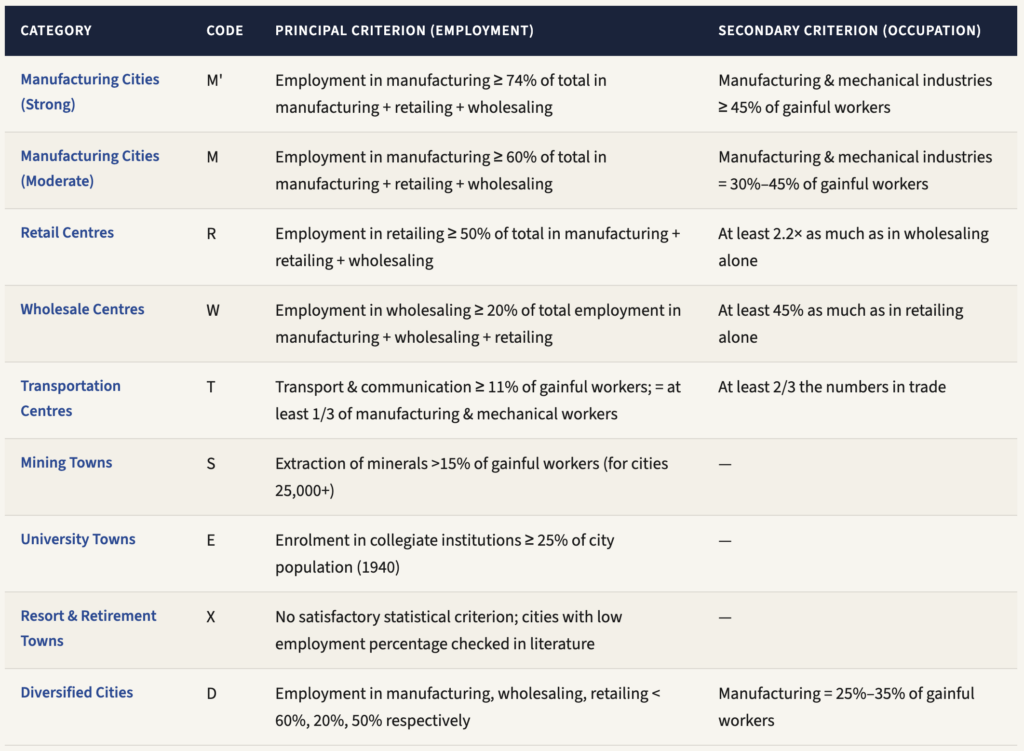
- Harris’s classification suffers from some defects and is not universally viable. He used metropolitan districts as functional units because the industry-group data, such as those published now, were not available during that time. Consequently, the number of cities that were too small to have metropolitan districts was left unclassified.
- Carter (1975) labelled Harris’s classification as subjective because the decisions to access or delete with a minimum number or cut-off points seem to be personal ones and were set by simple empirical means.
- Under the class of ‘Transport and Communications’, workers engaged in telephone and telegraph services were omitted, which was nothing more than a subjective decision
3. Quantitative (Statistical) Methods — The Rigorous Stage
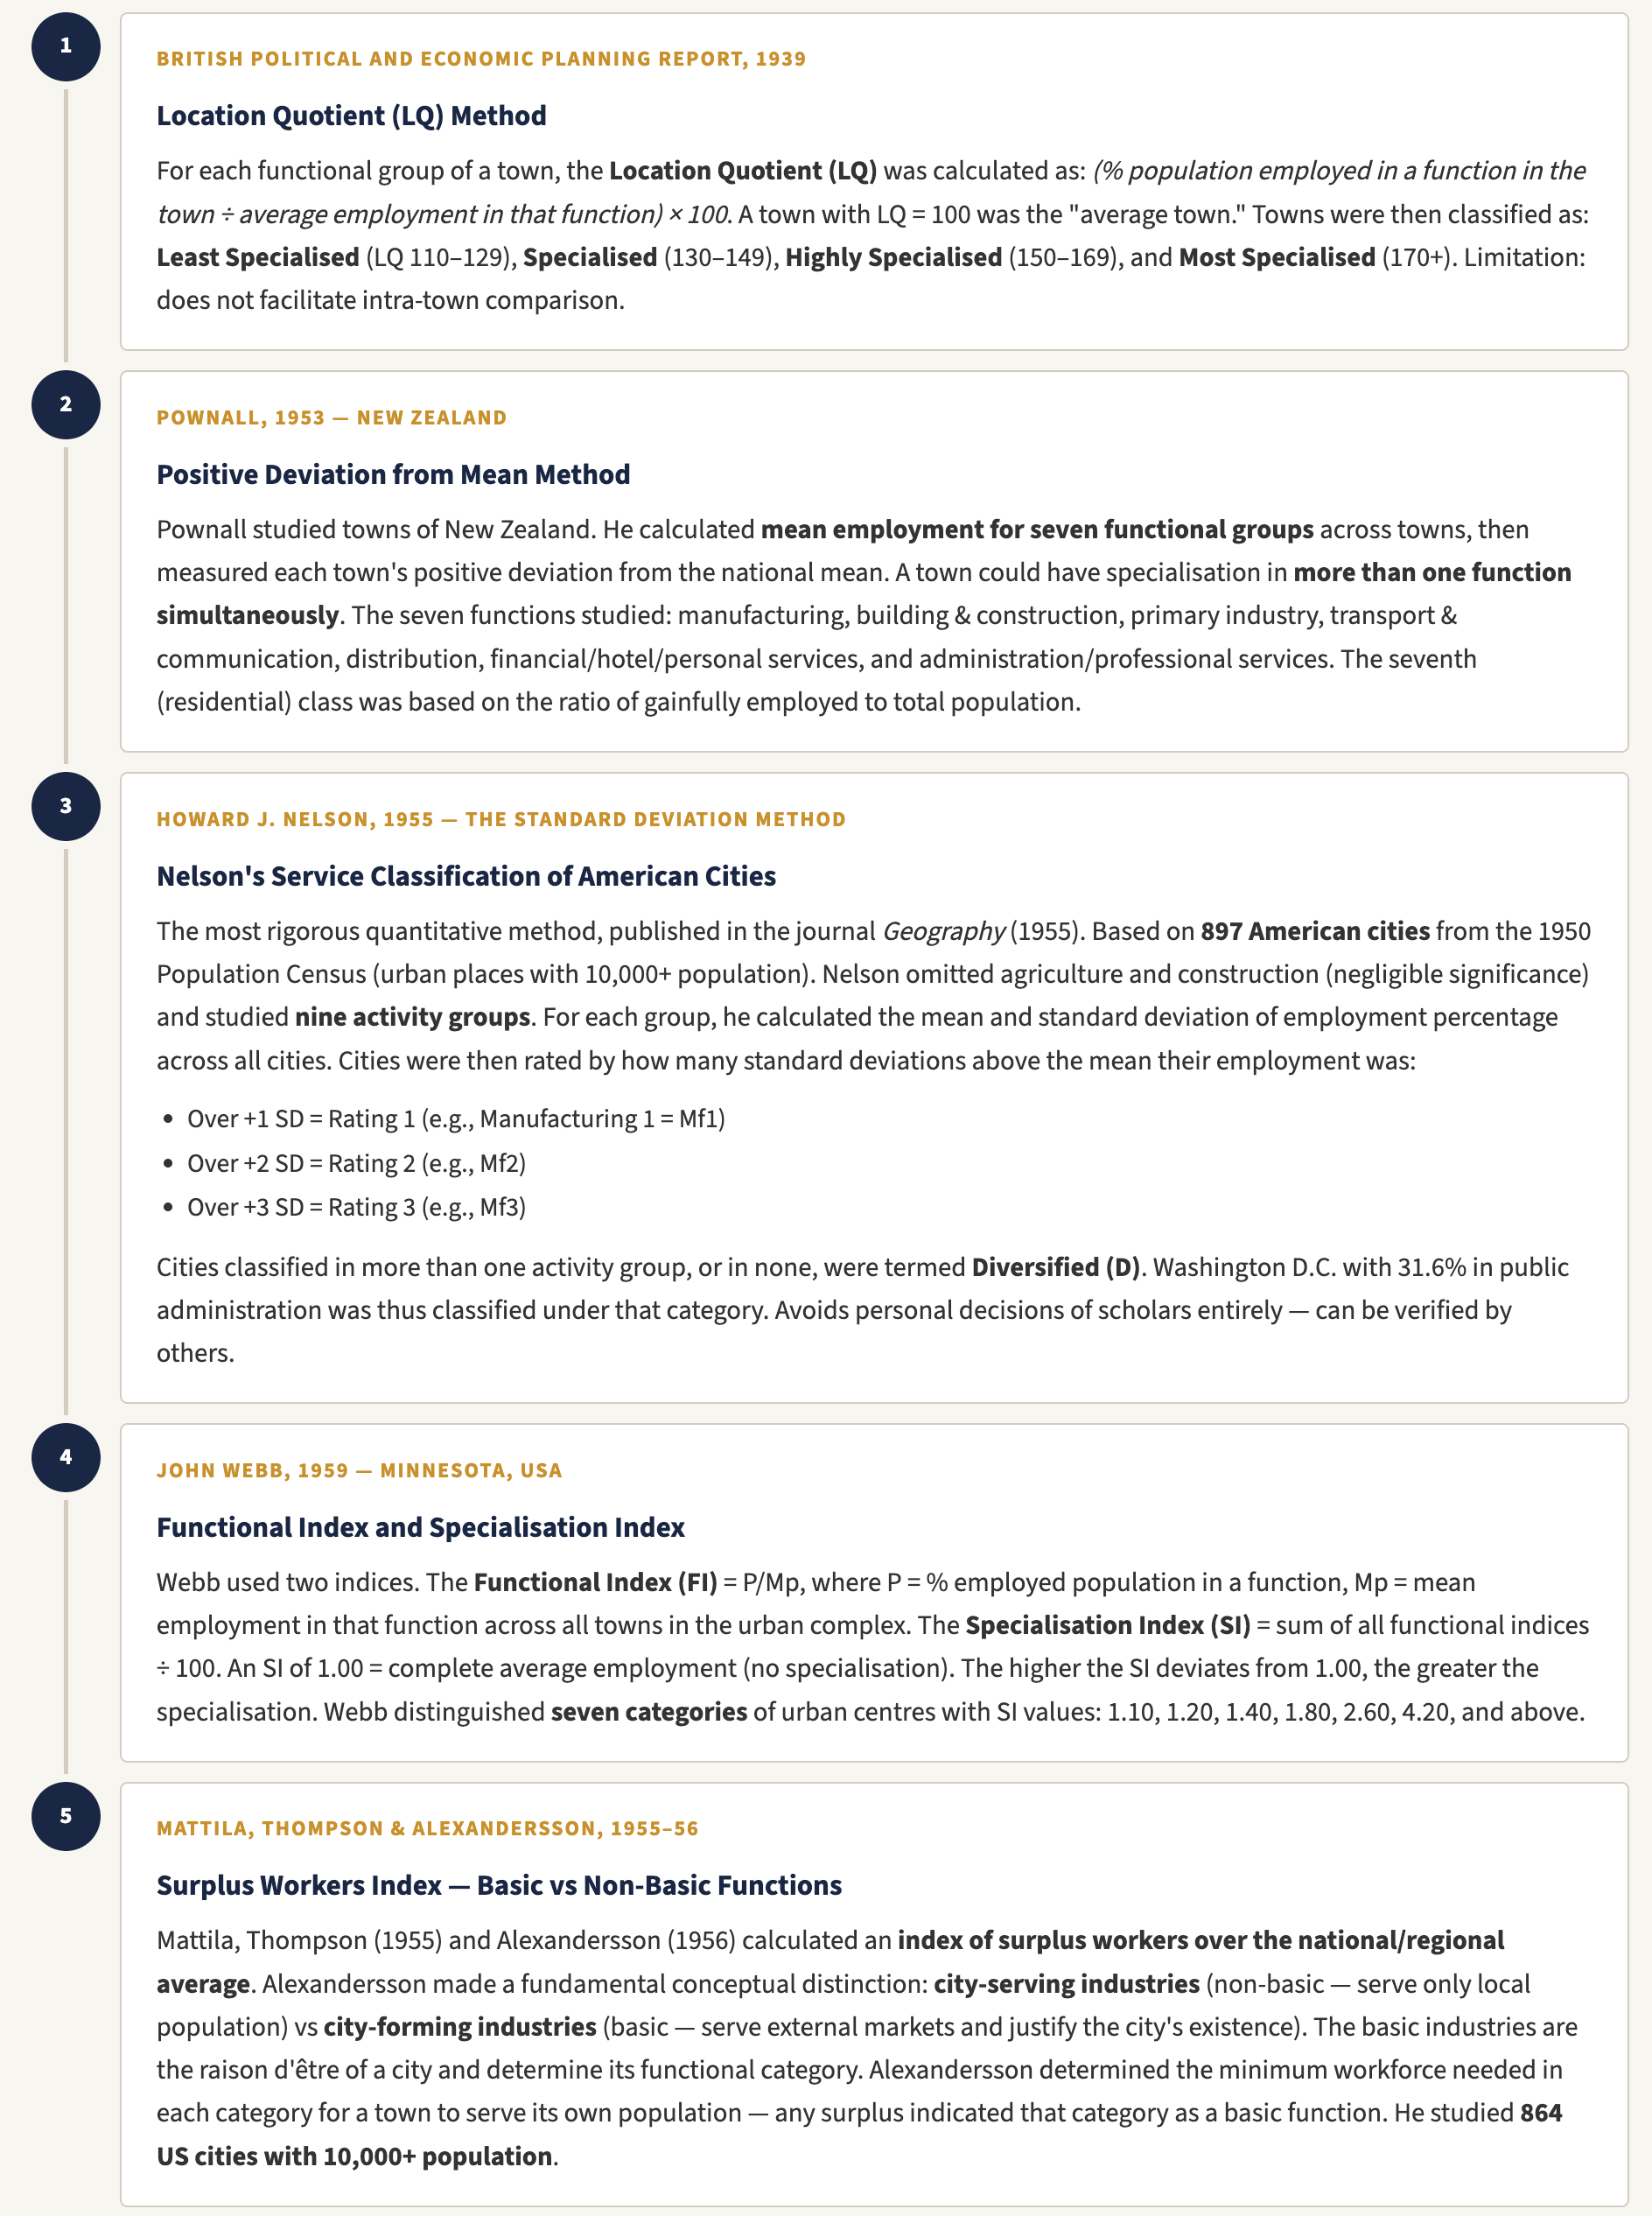
- In quantitative methods, the pre-determined minimum level of specialisation is not chosen arbitrarily but derived from statistical techniques, making the classification objective, transparent, and replicable by other scholars. These methods are based on the concept of Diagnostic Ratio — the idea that a certain proportion of the labour force in any function, above which that employment becomes distinctively specialised compared to other urban centres.
Howard Nelson’s Classification
- Nelson, through his classification, removed the shortcomings of the earlier classifications by using a stated procedure that could be objectively checked by other workers.
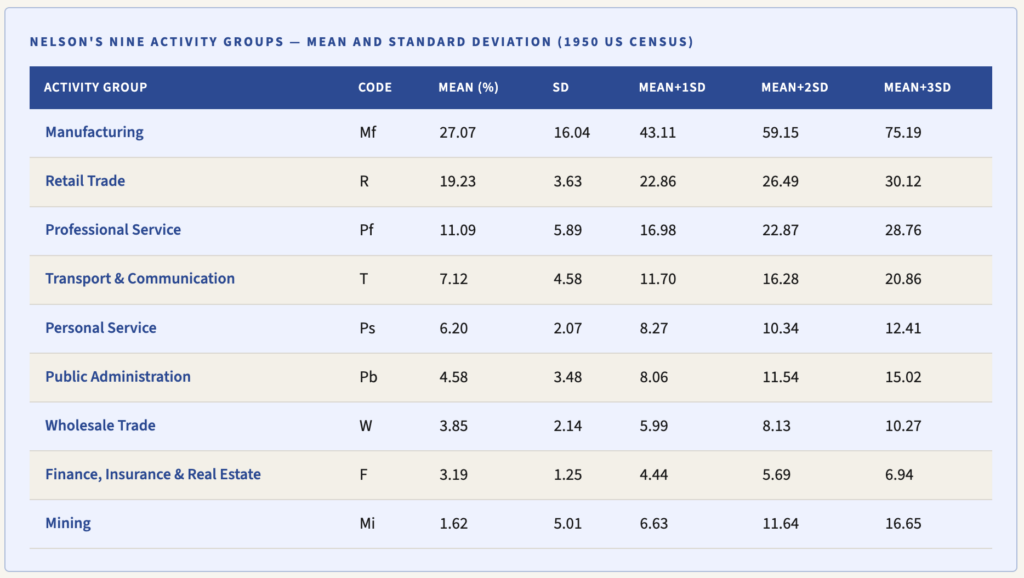
- His paper ‘A Service Classification of American Cities’ was published in the journal ‘Geography’ in 1955. He decided to base his method of classification entirely upon major industry groups as listed in the 1950 Census of Population for standard metropolitan areas, urbanised areas, and urban places of 10,000 or more population.
- He omitted the little significance groups like agriculture and construction, and finally, arrived at the nine activity groups
- manufacturing;
- mining
- retail;
- wholesale;
- personal service;
- professional services;
- public administration;
- transport and communication;
- finance, insurance, real estate.
- The problem of city specialization, and also the degree of specialization above the average was solved by giving margins of the different degrees to different size classes.
- He did find a definite tendency for the percentages employed in some activities to vary with city size. The question – ‘When is a city specialized?’ was solved by using a statistical technique – the Standard Deviation (SD). [S.D=√d²/N]
- With the help of the above formula, the index value is derived and the lowest deviation from theoretical value projects the city character on the basis of economic functions.
- Percentage of workers in all functions were calculated for each town and then the statistical mean of each function was calculated and towns having percentage above mean functions were taken as specialized towns in that function.
- Thereafter, towns having below the mean were eliminated and the remaining towns were hierarchically arranged on the basis of standard deviation.
- Nelson has not only functionally classified the cities but also taken the functional hierarchy for each function.
- According to Nelson, the city can be specialized in more than one activity and to varying degrees.
Criticism
- Nelson was criticized by some British Urban geographers especially Moser and Scott who said that this scheme of classification is applicable only for a particular point of time. After few years, there may be a change in occupation statistics. But, a simple change in occupational statistics can’t change the genetic factors of the town.
Functional Types of Urban Centres
Of all classifications of urban settlements, the one based on function is the most realistic and meaningful. The following are the major functional categories of urban centres as recognized in settlement geography literature:
- 🏛Administrative Towns
- Administration is the dominant function. These towns are the headquarters from where a country, state, district, or specific territory is administered.
- May be national capitals, state capitals, district HQs, or sub-divisional HQs
- Contain government offices, public buildings, residences of ministers and bureaucrats
- Economic base heavily dependent on government employment
- Indian examples: New Delhi (national), Jaipur (state), Bhopal, Patna, Lucknow
- Global examples: London, Washington D.C., Moscow, Cairo, Tokyo
- Administration is the dominant function. These towns are the headquarters from where a country, state, district, or specific territory is administered.
- 🏭Industrial Towns
- Manufacturing and production of goods is the main function. Manufacturing industries act as centripetal forces for growth.
- Scale and types of industries determine the size and structure of the town
- Major share of working population engaged in manufacturing
- Generally well connected by rail-road network for raw material supply and product distribution
- Indian examples: Jamshedpur (Tata Steel), Bokaro, Bhilai, Asansol, Bhadravati
- Global examples: Chicago, Detroit, Glasgow, Shanghai, Manchester
- Manufacturing and production of goods is the main function. Manufacturing industries act as centripetal forces for growth.
- 🏪Commercial Towns (Trade Centres)
- Collection and distribution of commercial goods is the main function. Well connected by transportation systems. Three sub-types:
- Market towns: Retail and wholesale trade. Ex: Kanpur, Ludhiana, Indore, Bhopal
- Financial towns: Financial houses, banks, stock markets, commercial agencies. Ex: Mumbai — financial capital of India
- Seaports: Export and import; some function as entrepôts with large warehouses. Ex: New York, Amsterdam, Cape Town, São Paulo
- Collection and distribution of commercial goods is the main function. Well connected by transportation systems. Three sub-types:
- 🚂Transport Towns
- Predominantly perform the function of transport and communication.
- Generally develop at convergence of roads (highways) or at railway junctions
- Economy sustained by the traffic of people and goods passing through
- Global examples: San Francisco, Paris, Berlin, Santiago, Sydney
- Indian examples: Nagpur (all national highways converge), Itarsi (major rail junction, MP), Mughalsarai
- Predominantly perform the function of transport and communication.
- ⛏Mining Towns
- Involved in the mining of precious metals, minerals, or energy resources.
- Located in proximity to mineral extraction sites
- Highly vulnerable to boom-and-bust cycles when resources are exhausted
- Indian examples: Jharia, Raniganj (coal), Kolar (gold), Digboi (oil — Asia’s oldest refinery), Zawar (zinc)
- Global examples: Hunnan, Shanshi, Kirkuk, Kalgoorlie
- Involved in the mining of precious metals, minerals, or energy resources.
- 🎓Educational Towns (University Towns)
- Dominant function related to education and training.
- Have one or more universities — called university towns
- Also include colleges, medical colleges, engineering colleges, training institutes
- Population drastically reduces during holidays — a unique diagnostic feature
- Indian examples: Aligarh (AMU), Shantiniketan, Pilani (BITS), Amravati
- Global examples: Oxford, Cambridge, Harvard
- Dominant function related to education and training.
- 🕌Religious Towns
- Existence entirely based on religious significance; generally develop at holy places or pilgrimage sites.
- Characterized by temples, mosques, churches, gurudwaras
- Periodically visited by vast crowds from long distances — creating a pilgrimage economy
- Indian examples: Kashi/Varanasi, Dwarka, Haridwar, Tirupati, Madurai, Bodh Gaya
- Global examples: Mecca, Jerusalem, Vatican City
- Existence entirely based on religious significance; generally develop at holy places or pilgrimage sites.
- 🛡Military Towns (Defence Centres)
- Primarily concerned with defence or military services.
- Usually situated near places of strategic importance
- Clear division of land between military and civil authorities — military campus at a distance from main town or at its corner
- Characterized by cantonments, barracks, airfields, training areas
- Indian examples: Ambala, Meerut, Jodhpur, Port Blair, Pune Cantonment, Visakhapatnam
- Global examples: Gibraltar, Aden
- Primarily concerned with defence or military services.
- ✈Resorts and Recreation Towns
- Cater to the recreational needs of people.
- Located near hot springs, hill stations, seaside, historical monuments, national parks, or scenic beauty
- Have hotels, shopping facilities, cinemas, nightclubs, and children’s parks
- Indian examples: Srinagar, Pahalgam, Gulmarg, Manali, Darjeeling, Ooty, Agra, Jaipur
- Global examples: Geneva, Los Angeles, Venice, Barcelona, Las Vegas
- Cater to the recreational needs of people.
- ⚡Diversified Towns
- Multifunctional with absence of any one particular dominant function.
- First identified and named by Harris (D) and Nelson (D) in their quantitative schemes
- The most common functional type among large cities globally
- The Indian urban system is fundamentally a system of diversified towns — most large cities exhibit highly balanced functions with no clear specialisation
- Examples: New York, Chicago, Kansas City, Mumbai, New Delhi, Hyderabad, Kolkata
- Multifunctional with absence of any one particular dominant function.
Functional Classification of Indian Cities
- A classification system devised for American or European cities cannot be applied to the Indian context without substantial modifications. Several important contextual differences must be noted before examining the Indian classification schemes:
- In the Indian context, primary activities are very much characteristic of urban centres — unlike the assumption in Western classification methods that primary activities are entirely rural. Almost a third of India’s urban centres have agriculture as a relatively dominant activity.
- Employment in agriculture is significant primarily in small towns; in large cities, secondary and tertiary activities predominate.
- The occupational data provided by the Indian Census forms the primary basis of all Indian functional classification schemes.
- According to the Indian Census, towns can be classified into five functional categories: primary activities, industry, trade and commerce, transport, and services.
Indian Census Classification Framework
| Category | Criterion | Classification |
|---|---|---|
| Monofunctional | Workers in ONE category ≥ 40% of total workers | Town dominated by that single function |
| Bifunctional | Workers in TWO dominant categories combined ≥ 60% of total workers | Town has two significant functions |
| Multifunctional | No two categories combined yield 60% | Diversified town with no dominant function |
Historical Progression of Indian Classification Attempts
| Scholar | Year | Method | Scope | Key Contribution / Limitation |
|---|---|---|---|---|
| Amrit Lal | 1951 | Location Quotient + Median | 67 Class-I cities (1951 Census) | First attempt; methodological deficiencies; didn’t even list the 67 cities studied |
| Janaki | 1954 | Descriptive/qualitative | Towns of Kerala | Five categories: administrative, commercial-industrial, agricultural, market, temple, plantation towns. Descriptive; no statistical criteria |
| Prakash Rao | 1962 | Least Square Linear Regression | All Indian towns | Plots population size vs % workers in a function; line of central value determines specialisation; innovative but complex |
| Rafiullah | 1965 | Maximum Positive Deviation | Indian towns (1961 Census) | Adaptation of Weaver’s crop combination method; calculates deviation from middle value of theoretical standard |
| Ganguli | 1965 | Nelson’s Standard Deviation Method | 250 Indian cities with 50,000+ population (1961 Census) | Direct application of Nelson’s method to India; one of the earliest rigorous quantitative attempts |
| Qazi Ahmad | 1965 | Multivariate Analysis (62 variables) | 102 Indian cities with 1 lakh+ population | Only 10 cities exhibited over 70% correlation among variables — revealing the limits of multivariate methods for India |
| Ashok Mitra | 1964/1973 | Triangular Method | 2528 urban centres (1961 & 1971 Censuses) | Most widely accepted method; simple, specific logic; triangular graph for visual representation |
| Mitra, Mukherjee et al. | 1981 | Factor Analysis + Cluster Analysis | 1466 towns (1961 & 1971 Census data) | 24 cluster types; computationally complex; results not significantly better than 1964 method |
| M.K. Jain | 1991/1994 | Modified Ashok Mitra method | All urban agglomerations (1991 Census) | Added mono-, bi-, multi-functional categories; 5 sectors including primary activity |
Most Common Functional Classification of Indian Cities
The most common functional classification of the Indian cities is –
- Administrative Cities
- Defense Towns
- Cultural Cities
- Collection Centres
- Production Centres
- Transfer and Distribution Centres
- Resorts Towns
- Residential Towns
- Seaport Towns
- Cities with Diversified Functions
Administrative Cities
- The main function of the administrative cities/towns is to administer the country, state, or any other administrative unit. It includes not only the capital cities of the country but also all the centers of states, districts, and other administrative divisional headquarters of the country. In the administrative cities are placed the legislative, executive, and judiciary of the respective administrative unit.
- Example: New Delhi, Mumbai, Kolkata, Chennai, Bangalore, Hyderabad, Lucknow, Jaipur, Patna, Bhopal, Chandigarh, Aizawl, Kohima, etc. are essentially administrative cities.
Defense Towns
- The dominant functions in a defense town pertain to the security and defense of the country. In fact, such towns are characterized by cantonments, barracks, military training centers, garrisons, air-force bases, airfields, harbors, strategic locations, and naval headquarters.
- Example: Adampur, Ambala, Halwara, Jalandhar, Jamnagar, Jodhpur, Khadakwasla, MOHO, Pathankot, Udhampur, Vishakhapatnam, etc. are some of the examples of defense towns.
Cultural Cities
- These cities perform either religious, educational, or recreational functions.
- Educational: They are characterized by universities, college buildings, libraries, and playgrounds. They also have shops which mainly catch to the needs of the students, such as book shops, sports shops, etc.
- Example: Shantiniketan, Aligarh, Gurukul, Kharagpur, etc.
- Entertainment: Such towns are known for their theaters, art galleries, and other cultural activities as that of film making.
- Example: Mumbai, Chennai, Kolkata, etc.
- Religious: Religious towns can be centers of pilgrimage on the seats of religious leaders. They are characterized by religious monuments, shops of selling religious books, pictures, candles, agarbattis, etc.
- Example: Allahabad, Amritsar, Ajmer, Bodh-gaya, Dharamshala, Gangotri, Hardwar, Pushkar, Varanasi, etc.
- Educational: They are characterized by universities, college buildings, libraries, and playgrounds. They also have shops which mainly catch to the needs of the students, such as book shops, sports shops, etc.
Collection Centres
- The mining towns, fishing ports, lumbering centers are included in this category. The exploitation of minerals from the mines is the main function of the mining towns.
- Example: The urban places of Jawar near Udaipur, Digboi in Assam, Ankleshwar in Gujrat, Bailadila in Chhattisgarh; Kathgodam, Halwani, Kotwar in Uttarakhand, Machlipatnam, Kakinada, Mahe, Kozhikode, etc. are some of the examples of collection centers.
Production Centres
- The urban places having manufacturing industries are included in the category of manufacturing cities. These cities are well connected by roads and railways.
- Example: Bhilai, Bhadrawati, Bokaro, Coimbatore, Dhanbad, Durgapur, Jamshedpur, Vishakhapatnam, etc. are some of the important manufacturing centers of India.
Transfer and Distribution Centres
- The main functions performed at the transfer centres are trade, commerce, and services. The market towns are characterized by markets containing a wide range of goods, stores, warehouses godowns, cold storage, and wholesale markets supported by a good network of transport facilities.
- Example: The most important commercial centers are Mumbai, Kolkata, Chennai, Ahmadabad, Gwalior, Indore, Ludhiana, Muzaffarpur, Surat, etc.
Resorts Towns
- The urban places which accommodate the recreation needs of people are known as resorts or recreation
towns. These towns may be based on health-giving water (hot-spring), seaside recreation, mountain-climbing, sports facilities, national parks, tiger reserves, and places of aesthetic beauty. Resort towns are also characterized by hotels, guest houses, cinema halls, nightclubs, shopping centers, etc. - Example: Dehra-dun, Dalhousie, Darjeeling, Dharamshala, Gulmarg, Kullu, Manali, Mt. Abu, Nainital, Pahalgam, Panchmadhi, Ooty, Ranikhet, etc. are some of the examples of resort towns.
Residential Towns
- Some of the towns and cities are developed just to provide residential accommodation to the urban people. Modern towns are usually located away from congested cities and provide residential facilities for the urban people.
- Example: Delhi, Rohini, Indirapuram, New Delhi, Mumbai, Kolkata, Bangalore, Hyderabad, Lucknow, Jaipur, etc. are some examples of residential towns.
Seaports
- The basic task of seaports is to export and import goods.
- Example: Diamond Harbour, Haldia, Kandala, Kochi, New Mangalore, New-Tuticorin, Okhla, Paradeep, etc. are some examples of Seaport towns in India.
Cities with Diversified Functions
- As stated, most of the cities and towns of India are multifunctional. The capital cities are also the commercial, manufacturing, cultural and recreational centers. The seaports are engaged in trade and commerce, besides cultural activities.
- Example: New Delhi, Mumbai, Kolkata, Bangalore, Hyderabad, Lucknow, Jaipur, Allahabad, etc. are some examples of multifunctional cities of India.
Ashok Mitra’s Classification (1964)
Ashok Mitra (Registrar General and Census Commissioner of India at the time) designed the most widely accepted method for explaining the functional structure of Indian towns and cities. First published as a classification in 1964 and as a full monograph in 1973, it used 1961 Census data providing nine categories of workers for all urban centres.
Step 1 — The Nine Census Categories
| Category | Description | Urban/Non-Urban? |
|---|---|---|
| I | Cultivators | Non-urban (excluded from analysis) |
| II | Agricultural Labour | Non-urban (excluded from analysis) |
| III | Forestry, Fishing, Plantations, Mining and Quarrying | Both (borderline — mining is urban, forestry/fishing generally not) |
| IV | Household Industry | Urban |
| V | Manufacturing other than Household Industry | Urban |
| VI | Construction | Urban |
| VII | Trade and Commerce | Urban |
| VIII | Transport, Storage and Communication | Urban |
| IX | Services | Urban |
Categories I and II (agriculture) are entirely non-urban and were excluded. The remaining seven categories (III–IX) were grouped into three broad functional types:
| Functional Type | Census Categories Included | Classification Criterion |
|---|---|---|
| A — Manufacturing Towns | III + IV + V + VI | % workers in A > % in B or C (by 20%) |
| B — Trade and Transport Towns | VII + VIII | % workers in B > % in A or C (by 20%) |
| C — Service Towns | IX | % workers in C > % in A or B (by 20%) |
Step 2 — Six Sub-Types
Manufacturing Towns and Trade & Transport Towns were further subdivided into sub-classes, yielding six types in total:
| Class | Sub-Class | Criterion |
|---|---|---|
| Manufacturing Towns (A) | a. Mining/Forestry/Fishing/Plantation Town | % workers in Category III > IV, V, or VI considered individually (by 10%+) |
| b. Artisan Town | % workers in Category IV > III, V, or VI considered individually (by 10%+) | |
| c. Manufacturing Town | % workers in Category V > III, IV, or VI considered individually (by 10%+) | |
| d. Construction Town | % workers in Category VI > III, IV, or V considered individually (by 10%+) | |
| Trade & Transport Towns (B) | a. Trade Town | % workers in Category VII > Category VIII (by 10%) |
| b. Transport Town | % workers in Category VIII > Category VII (by 10%) |
Step 3 — The Triangular Method (Visual Representation)
To determine the degree of functional specialization, Mitra devised a brilliant visual tool: the triangular graph method.
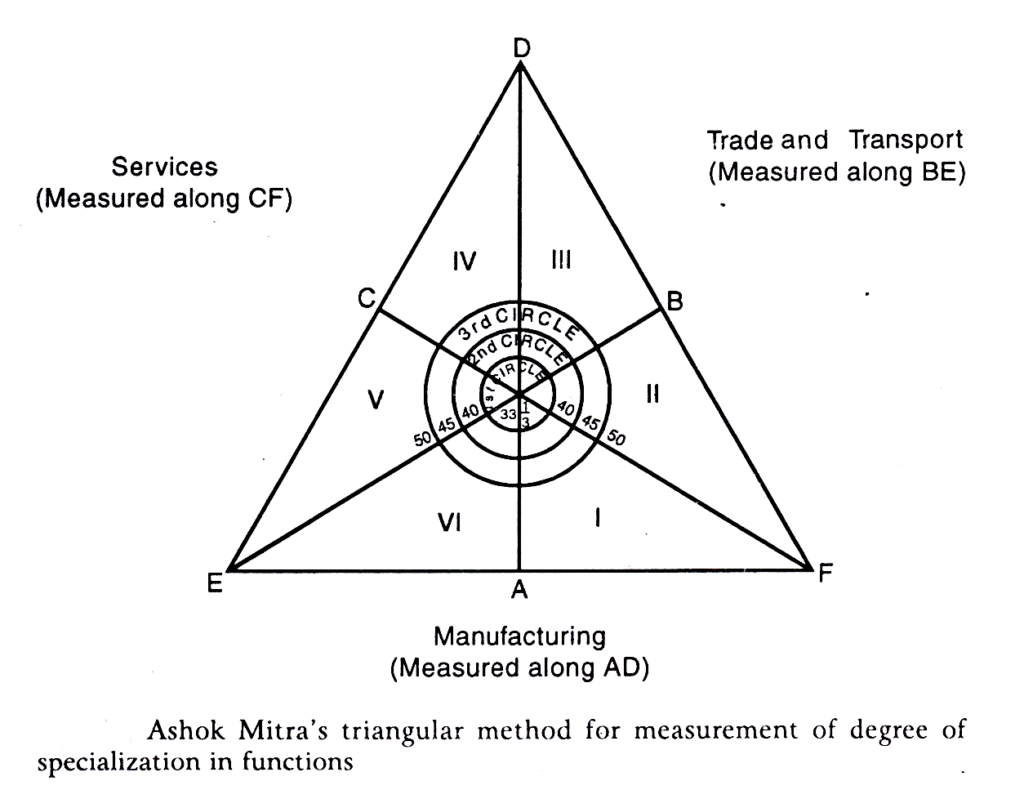
- An equilateral triangle is drawn, with three medians (axes) representing Manufacturing (A), Trade & Transport (B), and Services (C).
- Each median is graduated from 0 to 100. The values of A, B, C for any town always add up to 100%.
- The town’s position is plotted in the triangle. The in-centre (where all three medians meet) represents a town where each function has exactly 33⅓% workers — maximum diversification, no specialization.
- Three concentric circles are drawn from the in-centre at radii of 6⅔, 11⅔, and 16⅔ units, intersecting the axes at 40%, 45%, and 50% marks.
| Code | Degree of Specialisation | Position in Triangle | Worker % |
|---|---|---|---|
| FHD | Functions Highly Diversified (High Balance) | Within the 1st (inner) circle | No group exceeds 40% |
| FMD | Functions Moderately Diversified | Between 1st and 2nd circles | One group = 40%–45% |
| PFA | Predominant Function Accentuated (Moderately Specialized) | Between 2nd and 3rd circles | One group = 45%–50% |
| PFHA | Predominant Function Highly Accentuated (Highly Specialized) | Outside the 3rd (outer) circle | Dominant group > 50% |
The six subtriangles within the main triangle further determine the predominant and subsidiary functions. For example, a city positioned in subtriangle IV between the second and third circles is a specialized industrial city with medium trade & transport functions and low service functions.
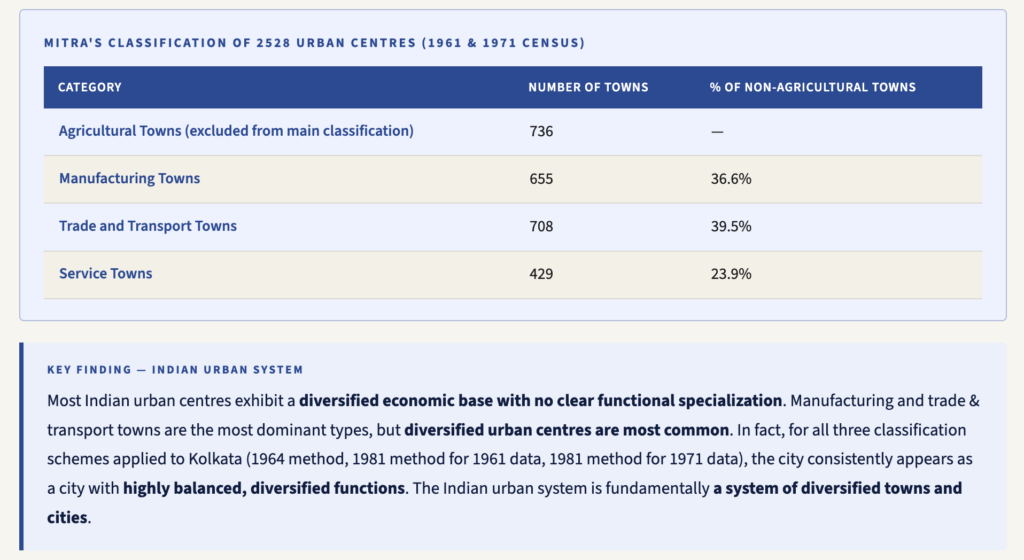
The 1981 Classification — Mitra, Mukherjee and Others
- Used factor analysis + distance analysis + hierarchical cluster analysis — computationally intensive, requiring computer assistance.
- Based on a data matrix of 1,466 towns × 9 worker categories for both 1961 and 1971 Census data.
- Results showed 24 cluster types — but these did not always correspond between the 1961 and 1971 analyses (cluster 8 in 1961 = very high transport; cluster 8 in 1971 = high trade).
- Despite the computational complexity, the final classification results did not vary significantly from the simpler 1964 method.
- Conclusion: The brief and simple 1964 triangular method remains the better practical tool.
M.K. Jain’s Classification Based on 1991 Census
Dr. M.K. Jain, Deputy Registrar General (SS) of India, attempted a functional classification of Indian cities following Ashok Mitra’s methodology, using the 1991 Census data. His classification (published as Census of India 1991 Occasional Paper No. 3, 1994) added three new functional classes: mono-functional, bi-functional, and multi-functional.
Method — Five Sectors
The nine industrial census categories were grouped into five sectors:
| Sector | Census Industrial Categories Included |
|---|---|
| 1. Primary Activity | I (Cultivation), II (Agricultural Labour), III (Forestry/Fishing/Mining), IV (Household Industry) |
| 2. Industry | V (Manufacturing), VI (Construction) |
| 3. Trade | VII (Trade and Commerce) |
| 4. Transport | VIII (Transport, Storage & Communication) |
| 5. Services | IX (Services) |
Classification Decision Rules
- Mono-functional: Workers in ONE sector ≥ 40% of total main workers.
- Bi-functional: No single sector ≥ 40%, but the two largest sectors combined ≥ 60% of total workers.
- Multi-functional: No two sectors combined ≥ 60% — the town is diversified.
- Additional sub-functional categories were recognized where at least 25% of workers were engaged in: (a) forestry/fishing, (b) mining/quarrying, (c) household manufacturing, or (d) construction.
Functional Classification of Million Cities of India — M.K. Jain (1991 Census)
| # | Urban Agglomeration | Population | Functional Category |
|---|---|---|---|
| 1 | Bombay (Mumbai) | 12,596,243 | IND (Industry dominant) |
| 2 | Calcutta (Kolkata) | 11,021,918 | IND-cum-TR and COM |
| 3 | Delhi | 8,419,084 | Services-cum-IND |
| 4 | Madras (Chennai) | 5,421,985 | IND-cum-Services |
| 5 | Hyderabad | 4,344,437 | IND-cum-Services |
| 6 | Bangalore (Bengaluru) | 4,130,288 | IND |
| 7 | Ahmedabad | 3,312,216 | IND |
| 8 | Pune | 2,493,987 | IND |
| 9 | Kanpur | 2,029,889 | Services-cum-IND |
| 10 | Nagpur | 1,664,006 | IND-cum-Services |
| 11 | Lucknow | 1,669,204 | Services |
| 12 | Patna | 1,099,647 | Services |
| 13 | Vizag (Visakhapatnam) | 1,057,118 | Services-cum-IND |
| 14 | Jaipur | 1,518,235 | IND-cum-Services |
| 15 | Surat | 1,518,950 | IND |
| 16 | Kochi | 1,140,605 | IND-cum-Services-cum-TR and COM |
Key Observation from M.K. Jain’s 1991 Classification
The most striking finding is that Industry (IND) dominates as the primary or secondary function in virtually all million-plus cities. Only Lucknow and Patna are classified as purely service towns. Delhi — the national capital — is classified as Services-cum-IND, confirming that its administrative function is reflected as the service sector but manufacturing remains significant. Mumbai’s classification as purely IND reflects the dominance of its textile, chemical, and port-related industries in the 1991 data.
Cultural Classification of Indian Cities
Beyond economic function, Indian cities can also be classified on the basis of cultural and historical character — reflecting the different civilizational phases that have shaped their morphology, architecture, and social fabric. Five broad cultural types have been identified:
| Cultural Type | Key Characteristics | Indian Examples |
|---|---|---|
| Ancient Cities | Relics of ancient urbanization — ruins, religious structures, organic street patterns; morphology shaped by ritual, caste, and temple-centred planning | Rajgir, Madurai, Varanasi, Mathura, Thanjavur, Kanchipuram, Pataliputra (Patna) |
| Medieval Cities | Turkish and Mughal architecture — bagh (gardens), fountains, ornate arches, domes; fortified but gates remain; old city has ethnic enclaves and congested bazaars | Agra, Delhi (Shahjahanabad), Jaipur, Pune, Surat, Nabadwip, Mysore, Lucknow |
| Colonial Cities | Gothic and Doric architecture in public buildings; civil lines, cantonments, railway colonies; clear separation of European and native quarters | Mumbai (Bombay), Kolkata (Calcutta), Chennai (Madras), Ranchi, Shimla, Dehradun, Darjeeling |
| Industrial Age Cities | First modern planned cities in British period; neat road grids, standardized workers’ housing; few in number but distinct in character | Jamshedpur, Asansol, Kulti, Bhadravati, Rourkela, Durgapur, Bhilai |
| Post-Independence Planned Cities | Designed by leading architects; grid-sector layouts; pollution-free green belts; separate residential sectors; market complexes | Chandigarh (Le Corbusier), Bhubaneswar, Gandhi Nagar, Naya Raipur, Bokaro |
Classification by Stages of Growth and Decay
Griffith Taylor’s Sequential Stages
Following W.M. Davis’s theory of sequential landscape change, Griffith Taylor (1949) identified stages in urban development. However, he himself acknowledged that the model is applicable only to Western cities under a particular economic system and lacks specific determinants:
- Sub-infantile: Initial cluster — a single ill-defined street town. No clear zones.
- Infantile: No clear differentiation between industrial, commercial, and residential areas. No factories. Larger houses near margins.
- Juvenile: Fairly clear segregation of a commercial quarter towards the centre. Residential areas still undifferentiated.
- Adolescent: Clear differentiation of residential zones begins.
- Early Maturity: Residential differentiation more pronounced.
- Maturity: Separate commercial areas and four clearly differentiated residential zones — from mansions to shacks.
The classification is interesting from an academic point of view but is unpractical as no specific determinants have been stated. Moreover, it is applicable only to western cities under a particular economic system.
Lewis Mumford’s Growth-Decay Typology (1938)
Lewis Mumford in his landmark work The Culture of Cities (1938) conceived of a city rising through multiple stages to reach its evolutionary peak — and then beginning to decay. He identified three stages of growth followed by three stages of decay:
| Stage | Type | Characteristics | Examples |
|---|---|---|---|
| Growth 1 | Eopolis | The rising village community — pre-urban, primarily agricultural | Early settlements |
| Growth 2 | Polis | Small market town; modern civic amenities emerge while traditional values are upheld | Medieval English market towns |
| Growth 3 | Metropolis | Large city with cosmopolitan population, specialized occupations, and wide sphere of influence | Plato’s Athens, Shakespeare’s London, Tagore’s Calcutta, Emerson’s Boston |
| Decay 1 | Megalopolis | Bloated city where material wealth dominates life; beginning of decline | Rome (2nd century), Paris (18th century), New York (20th century), Calcutta (late 20th century) |
| Decay 2 | Tyrannopolis | Tyrannical city — moral apathy replaces good living; commerce alternates between expansion and depression | — |
| Decay 3 | Nekopolis | The “city of the dead” — overcrowding and degradation lead to famine and war | Ancient Babylon, Nineveh, Rome |
Mumford’s Techno-Economic Phases (Based on Geddes)
- Eotechnic Phase: Wind, water, and wood as chief energy sources; beginning of decline of manual labour. Medieval period cities.
- Paleotechnic Phase: Era of coal and steam energy. Cities became increasingly polluted and dirty — the industrial revolution city. Ex: Victorian Manchester, early Kolkata.
- Neotechnic Phase: Electricity as the main energy source; cities become cleaner; synthetic materials; advanced communications; faster travel.
- Biotechnic Phase: Harmony between human beings and nature; production systems aim to maintain a clean and beautiful environment. Mumford in 1938 declared this was “just becoming visible over the edge of the horizon.”
Robert Redfield’s Cultural Classification (1954)
Redfield divided cities on the basis of two historic periods — before and after the Universal Oikumene (the Industrial Revolution/Western expansion):
- Pre-industrial: (i) Administrative Cultural Cities — cities of indigenous bureaucracy and literature (e.g., Peiping, Lhasa, Kyoto, Allahabad); (ii) Cities of Native Commerce — cities of the entrepreneur (e.g., Marseilles, early Canton).
- Post-industrial: (i) Metropolis — cities of the worldwide managerial and entrepreneurial class (e.g., London, New York, Mumbai); (ii) Cities of Modern Administration (e.g., Washington D.C., New Delhi).
- These classes form the basis of Redfield’s concept of orthogenetic urbanization (cities growing from within the indigenous culture) vs heterogenetic urbanization (cities shaped by external forces — colonial, trading).





nice note
Good material for UPSC CSE but please add prospective questions with each topic. Thank you!
High, thanks for such concise notes they are simply gold mines.
However one correction, according to Grifith Taylors book “Urban Geography” Chauncey Harris had classified urban cities based on commercial interest. classes were based on employment where he surveyed 984 cities. From there the classification was in 5 categories
Thank you for the systematic notes
Thank u so much for your dedication.loved it.
thank u so much…..
thanks once again