

Sphere of Urban Influence

- Urban centers have inextricable bonding with the surrounding landscape where the socio-economic and cultural influence of the city spreads.
- The radial distance from the physical limits of the city where the city provides goods and services by import of various city-manufactured/produced goods and services, and also receives supplies of labour resources and economic inputs, is said to have functional and economic integration with the city. Such notional surroundings are termed the sphere of urban influence.
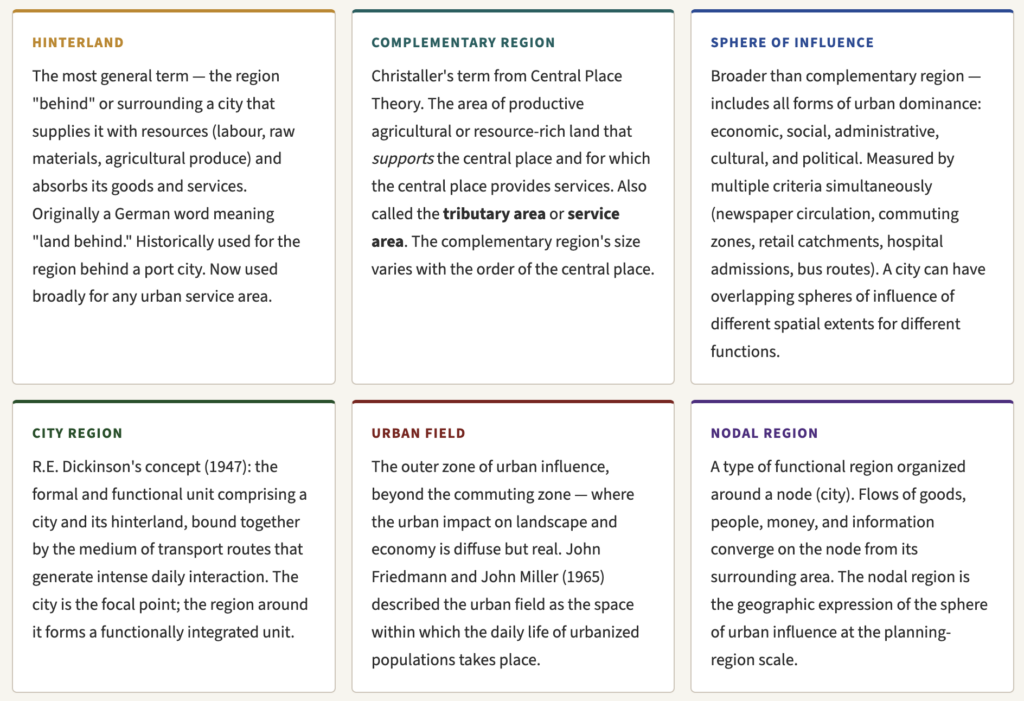
- The concept has its roots in Walter Christaller’s Central Place Theory (1933), where the area served by a central place is called its complementary region — the area of land whose population supports the services offered by the central place.
- But the sphere of urban influence goes beyond the purely economic service area: it encompasses all forms of interaction — commuting patterns, newspaper circulation, hospital catchment areas, retail trade areas, bus and rail service zones, and administrative boundaries — between a city and its surrounding region.
- The term sphere of influence was first used by Northam and supported by Canter. The urban sphere of influence is the geographical region that surrounds a city and maintains an inflow-outflow relationship with the city.
- It is also called Umland by the geographers of Scandinavia and Germany. Umland is a German word that means the area around. The term was first used by the Allies in the Second World War.
- The largest possible sphere of influence is known as a city region, where the highest range of goods and services is provided. The term city-region was first used by Dickinson. It is used to describe a similar situation on a much larger scale.
- For ports, similar regions have been called as hinterland.
- Sphere of influence can be defined as the catchment area of the city from where it draws services and various products and also provides the same. (functional integration from surrounding area having two way linkages).
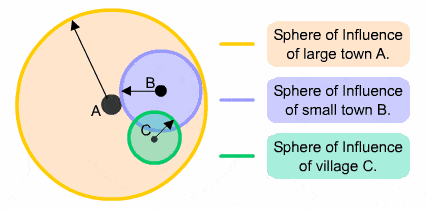
- Every urban centre, irrespective of the size of population and the nature of its function, has a region of influence. The intensity of influences decreases with distance from the core of the city. Generally speaking, as the size of the population increases, the multiplicity of functions increases. As a result, the influence zone is larger and vice versa. The influence area of the city may increase by fast communication networks.
- The influence area of the city is proportional to the number of services & volume of services of a city.
- For example, the area of the influence of Mumbai is larger than that of Lucknow because Mumbai provides more services than Lucknow.
- The range of goods and services means the optimum distance the economic rational man would travel to obtain goods and services from the city.
- E.g., a person living in Chennai would get I-phone on Chennai only, but for the Supreme Court, he has to go to Delhi.

Key Concepts and Terminology
- City Influence
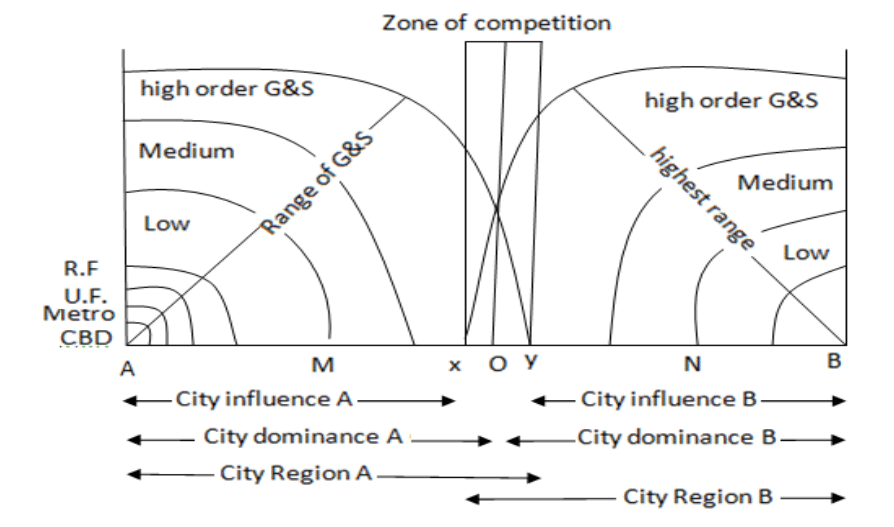
- City influence is the area where the exclusive influence of city extends without competition. The monopoly of city exists in this area. Generally in terms of lower and medium goods and services, the city influence is determined.
- City regions are identified on the basis of intensity and magnitude of their function. Here distance decay law operates.
- The structure of Urban Sphere of Influence is determined by the centrality of goods and services and their characteristic range where Range = distance and Centrality = demand
- City dominance:
- City dominance is the region where city competes with other cities but its own economic functions dominate.
- Zone of competition:
- It is the overlapped area or interface region where two or more cities can provide their goods and services. The determination of the boundaries of the city’s sphere of influence is located in the zone of competition.
- City region:
- It is largest area of urban sphere of influence. In above diagram AY and BX for A, B respectively. AM and BN are the City Exclusive Regions.
Threshold and Range — The Two Determinants of Sphere Size
- From Christaller’s Central Place Theory, two key concepts directly determine the size of a city’s sphere of influence:
- Threshold Population — The minimum number of consumers required to support the existence of a particular good or service in a central place. A grocery store can survive on the threshold population of three villages; a designer jeweller’s shop requires the threshold population of an entire metropolitan area. Higher-order functions have higher thresholds — and therefore larger spheres of influence.
- Range of a Good — The maximum distance a consumer is willing to travel to obtain a particular good or service. The range of a daily necessity (milk, bread) is very small; the range of a specialized service (cardiac surgery, university education) is very large. The range sets the outer boundary of the sphere of influence for that particular function.
- The sphere of influence lies between the threshold and the range: it must be large enough to provide the threshold population, but can extend no further than the range consumers are willing to travel.
- A city provides multiple goods and services, each with different thresholds and ranges — this is why the sphere of influence is not a single circle but a nested set of overlapping zones of varying spatial extents.
The City Region — Dickinson’s Framework (1947)
Robert E. Dickinson in his landmark work City Region and Regionalism (1947) was the first geographer to systematically describe and theorize the city region. His framework remains the foundational text for understanding the sphere of urban influence as a planning unit.
Dickinson’s Definition of City Region
Around every city lies its hinterland with which it has intense interaction and for which it forms the focal point. This generates functional kindred interests and common organizations brought into being through the medium of routes that bind the surrounding area to the urban centre. The focus of this region is the city (or cities) and the area around it constitutes the city region. The regional character is strongest around the focus and becomes less distinct away from it, finally dissipating at the periphery.
- The city region is not defined by administrative boundaries — it is a functional region shaped by actual interactions (flows of people, goods, information, and services) between the city and its surrounding territory.
- The regional character is strongest near the city and decreases gradually with distance — there is no sharp boundary but a gradual transition.
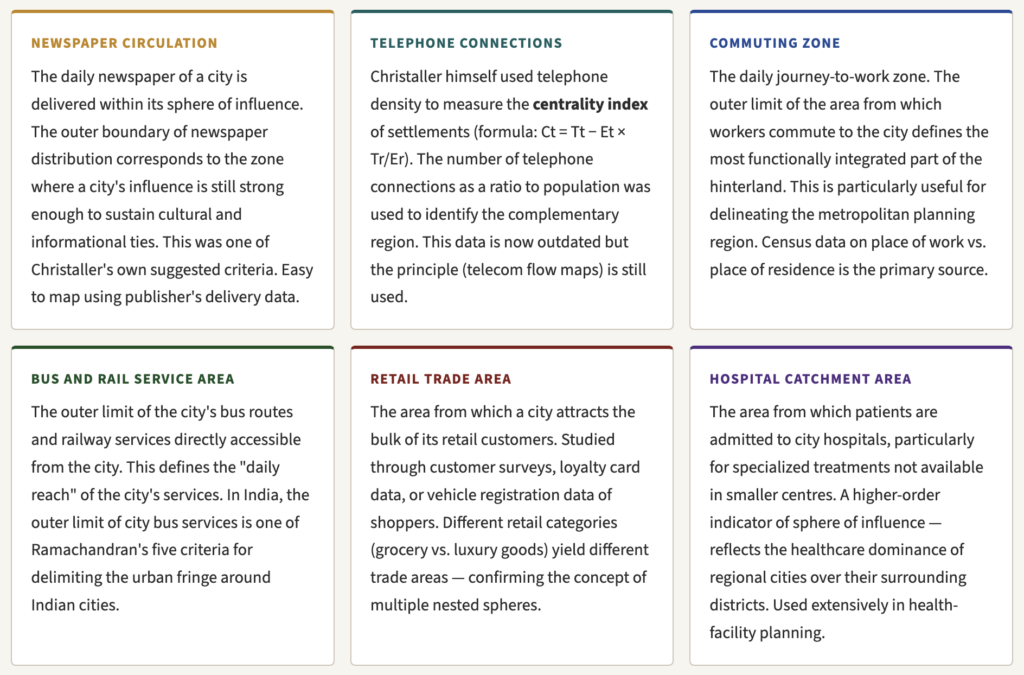
- The delimitation of a city region is a complex process based on various criteria which differ from one region to another. These criteria might include: number of telephone connections, extent of newspaper circulation, limit of the commuting zone, limit of local bus routes, retail trade areas, hospital catchment zones, and area served by daily markets.
- The rapid urbanization of the industrial world introduced a new phenomenon — the continuous built-up area — where different city regions began to overlap and eventually merge into conurbations.
- In planning terms, the city region provides the logical basis for metropolitan planning regions — planning cannot stop at the municipal boundary of the city proper; it must encompass the entire functionally integrated region.
Breaking Down of Walls — The Transition Zone
- Historically, in walled cities, the urban landscape was automatically contained within the city limits. The wall provided a clear, sharp demarcating line between urban and rural.
- With the breaking down of city walls, a clear demarcating line for urban areas disappeared. It was replaced by a transition zone called by varying names — urban fringe, rural-urban fringe, peri-urban zone, or suburban zone.
- The transition zone shows characteristics of both urban and rural life.
- Juxtaposed with the built-up area are open spaces and farms — a transition from purely urban to purely rural landscape.
- Two relationships explain this transition zone:
- (1) A city which grows in size will naturally do so at the expense of the countryside around it — the changing landscape shows characteristics of both urban and non-urban, with urban characteristics decreasing with distance from the city centre.
- (2) The city acting as a central place generates interactions with the area around it — greater degrees of interaction bring greater commercialization, communications development, and higher density of population.
- In either case, villages on the city fringe gradually urbanise and ultimately amalgamate with the city. This process is initially de facto (in reality) but later becomes de jure (legally recognised) through adjustment of municipal boundaries.
Zones Within the Sphere of Urban Influence
The sphere of urban influence is not a uniform area — it is organised into concentric zones of decreasing urban intensity radiating outward from the city centre. Each zone has a distinctive character, function, and planning challenge:

Methods of Delimiting the Sphere of Urban Influence
- The Sphere of Urban Influence (SUI) represents the functional region around a town or city from which it draws resources and to which it provides services. Since this region is not defined by administrative boundaries but by intensity of interaction, geographers have developed various methods to delineate or demarcate its spatial extent.
- The delimitation of SUI is essential for understanding urban–rural linkages, service areas, planning regions and settlement hierarchy. However, because urban influence is dynamic and multidimensional, no single method is sufficient; instead, a combination of approaches is often used.
- The urban sphere of influence can be determined by two methods
- Qualitative/Empirical Methods
- Quantitative Methods (Geometrical Methods and Statistical Methods)
Qualitative Methods
- This method is based on empirical observation of primary and secondary data. Primary data is collected from field surveys, and secondary data is collected from agencies and organisations.
- UN Criteria
- For 5000 population town (5000-10000):
- Service provided by primary health centres
- Primary and secondary education
- Post office accounts and services
- Cycle repair
- Bank account holders
- Repairing and purchase of agricultural equipments
- Purchase of cloths
- For 1 lakh plus cities:
- Purchase of agricultural equipments. E.g. tractors, machines
- Higher education
- Treatment of lethal disease
- Purchase of costly clothing and ornaments for special occasions.
- For 5000 population town (5000-10000):
- R L Singh criteria
- He was first to study the Umland of any city of India (Varanasi in 1956)
- He classified two sets of criteria for Varanasi
- Demand based (inflow variables)
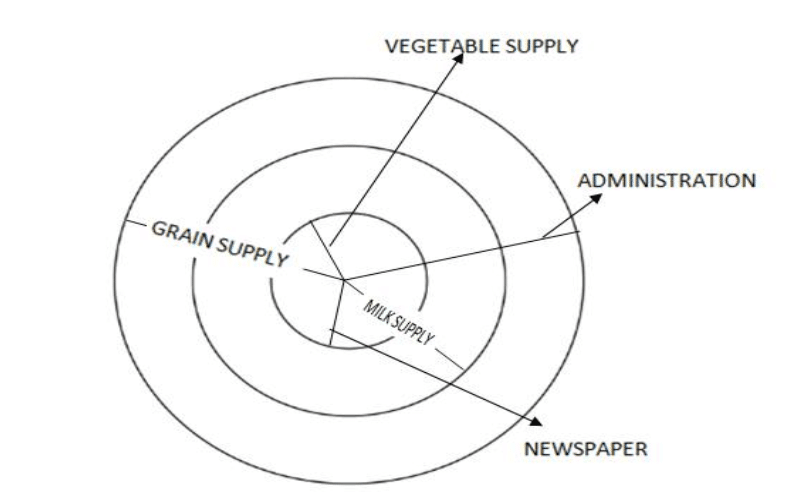
- Vegetable supply (he concluded 8 km distance for Varanasi)
- Milk supply
- Grain supply
- Supply based (outflow variables)
- Bus service
- Newspaper distribution
- Administration
- Demand based (inflow variables)
- He took out the radial distance for each of the goods and services from the centre of city.
- The R L Singh’s study was followed by the study of U Singh, who studied Allahabad (1961) and later KAVAL (Kanpur, Allahabad, Varanasi, Agra, Lucknow) towns (1962).
Quantitative Methods
- Quantitative methods are further classified into geometrical and statistical method
Geometrical Methods
- Geometrical methods: It is also divided into two methods viz. Skyline Method and Proximal Boundary Method.
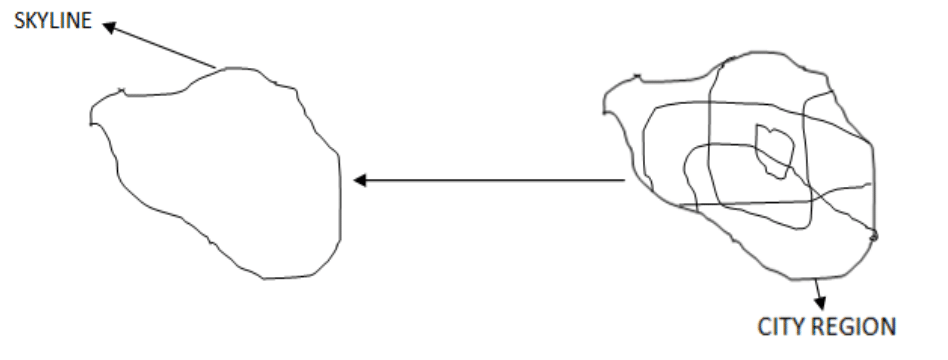
- Skyline Method:
- In this method, the range of goods and services are calculated on the basis of surveys and data, and the boundaries are delimited from various goods and services till the supply point.
- All the irregular polygon areas are superimposed on each other and the outermost overlapping boundaries are taken as the limit of urban sphere of influence.
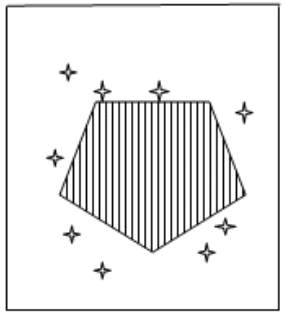
- Proximal Boundary Method (Thiessen Polygons):
- Urban centres over the same hierarchy are plotted over the map. It is also referred to as the Thiessen Polygon method.
- The midpoint of all the cities are connected by straight lines, thus an irregular polygon emerge over a surface which is taken as the boundary limits of the sphere of influence/ city region.
Statistical Methods
- Most of the quantification for the study of urban field/city region/urban sphere of influence is based on Newton’s law of gravity. Thus, such models have been called Gravity Analogue Models.
- Several models are based on probability, and several models have been constructed based on behavioural matrix analysis (where primary data is collected to quantify the decision of individuals over their choice, demand, and preference).
Breaking Point Model or Law of Retail Gravitation
- The Law of Retail Gravitation, propounded by William J. Reilly in 1931, is a theoretical model used to predict the trade area attraction between two competing cities. Inspired by Newton’s Law of Universal Gravitation, it posits that consumers are drawn to retail centers based on their relative size (mass) and the distance they must travel.
- Key Concepts and Components:
- Gravity Analogue: Just as gravity acts on mass and distance, this model posits that the attraction (“mass”) of a city (usually measured by population or retail sales) pulls customers towards it, while distance reduces this pull.
- The “Breaking Point” (BP): This is the distance from a smaller city towards a larger city where the “pull” of both cities is equal. At this precise point, shoppers are likely to split their business between the two centers.
- Boundary Delineation: If the breaking point can be established between a town and neighboring cities, its theoretical trade area or sphere of influence can be defined.
- The law is based on two primary variables that influence a consumer’s choice of where to shop:
- Size (Population): Larger cities or retail centers exert a stronger “gravitational pull” because they offer a greater variety of goods, better quality, and more specialized services.
- Distance: The attractiveness of a center decreases as the distance (or travel time) to it increases. Reilly specifically used the inverse square of the distance, meaning resistance to travel grows exponentially as distance increases.
- The Formulas:
- The law is expressed through two primary mathematical applications:
- Trade Proportions Formula
- The Breaking Point (BP) Formula
- The law is expressed through two primary mathematical applications:
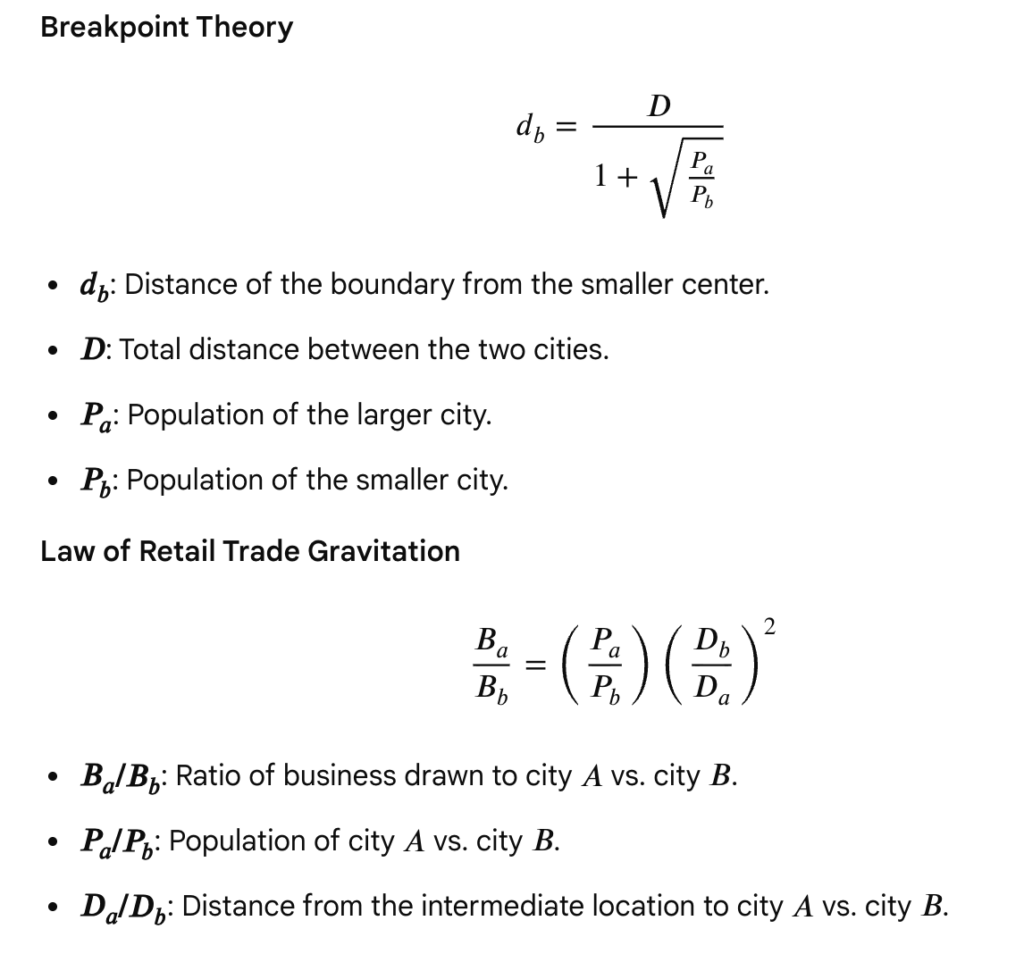
Breakpoint theory (Gravity Analogue Model):
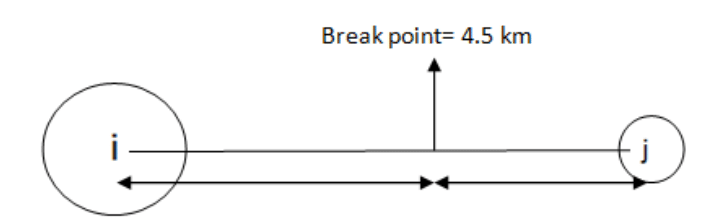
- In this model there are two cities separated by 18 km distance and population size of 45000 and 5000 respectively. Population is taken as mass and thus law of gravitation is applied to estimate the pull by each of the cities.
- Gravity = Pi*Pj/dij
- This has been further modified to get the break point (point between i and j where pull of i will be effective) between i and j.
- Break Point = dij/√1+ (Pi/Pj)
- In above case the break point for city I will be 4.5 km from J
- The break point law provides linear boundary. Based on this method, the break point for each of surrounding cities are found and connected with straight line.
Law of Retail Trade Gravitation (Gravity Analogue Model):
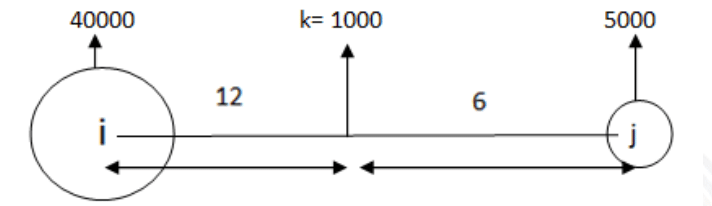
- This law was proposed by Reilly. It assumes that there is settlement K with population size 1000 located at the distance of 12 km from city I and 6 km from city J.
- The following formula gives the ratio of the volume of trade moving into either city I or J. It can also express the number of people travelling to respective cities for goods and services.
- Mki/Mkj = Pi/Pj*(dkj/dki)² = 40000/5000*(6/12)² = 2:1
- In above equation
- Mki= Mass of people/ volume of trade moving from k to i
- Pi= Population of i
- dik= Distance between i and k.
- In above case we get the ratio of 2:1 which signifies that if two people move from k to i, 1 moves to j.
- This method provides a well defined cut off area of influence. It is hence widely appreciated and is used in developed countries. However, this model is far from reality and hence less applicable.
Probability Model by Huff:
- The Huff Model is a probabilistic model used to predict the likelihood of a consumer visiting a specific retail location based on its attractiveness and distance relative to all other competing locations.
- Unlike the deterministic Breakpoint Theory, it views trade areas as a probability surface where consumers have a choice between multiple alternatives.
- This model is based on the law of probability to determine how many people/the volume of trade will move to cities I and J.
- If settlement k is located on the midpoint and the population size is the same, then the ratio will be 50:50.
- If the ratio of distance is 18:6 with the same population then the ratio will be 1:9.
- Similarly, various probabilities can be worked out.
- For a city region, linear boundaries can never be drawn. A city region can be defined by centrality and the range of goods and services which is variable for each of them. This model failed because human behaviour is unpredictable.
Behavioural Model
- Since the behavioural model is based on individual analysis at a given point of time, they became very complex and they could not work out in a precise manner the boundary limits of a city region.
- Behavioural model matrix was prepared by Prat who attempted to quantify the behaviour of people through various intrigue.
- Thus, the quantitative methods can’t precisely determine the city region of sphere of influence since:
- Primary data collected ha number of discrepancies.
- The decision making of people changes with time and circumstances.
- People choices, taste, emotions, values can’t be quantified.
- Man is neither economic nor rational and his behaviour analysis can’t be produced through a law of model, where there is rigidity in areal demarcation.
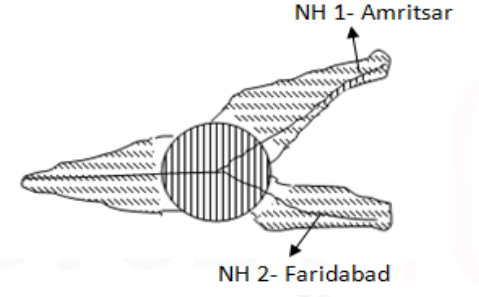
- It was found in many developing countries, cities that influence areas become star shaped. In that situation, there is need to bring some modification to the statistically demarcated area.
- This modification is to be based on empirical method or some variable are to be suitably chosen for the inclusion of those areas which are not coming within influence area through statistical method but functionally they qualify to be a part of influence area. In such circumstances, statistically demarcated area is to be extended where ever it needed. Hence, a new approach should be statistical cum empirical in nature.
- For example NCR is a well defined city region and has used this statistical cum empirical approach. It is due to this empirical approach that demarcated area is projected outside along all important roadways which go outside Delhi. Developed Western countries however, have a different situation with infrastructure developed in all directions and again due to pollution and environment degradation, the settlement growth is not strong along roadside as it is found in developing countries.
- City region is largely a mental construct or abstract notion, and delimitation by quantitative methods is impossible because nature of demand/production at city centre and the population size is dynamic. However, the qualitative method can be used to find near proximity to reality.
Functional / Interaction-Based Methods
Multi-Criteria / Composite Methods
- Since the sphere of influence has different extents for different functions, the most comprehensive approach is to use multiple criteria simultaneously and identify the area where a majority of indicators show the city’s dominance.
- Criteria typically combined: newspaper circulation + bus service limits + commuting zone + retail catchment + hospital admissions + secondary school attendance areas.
- The resulting composite sphere of influence is not a perfect circle but an irregular polygon reflecting the asymmetric influence of transportation routes, topographic barriers, and competing centres.
- In India, this multi-criteria approach was used in planning the Calcutta Metropolitan District and the National Capital Region (NCR).
The Sphere of Urban Influence in the Indian Context
India presents a unique and complex case for understanding the sphere of urban influence. Several features distinguish the Indian context from the idealised Western models:
The Standard Urban Area (SUA) — India’s Planning Unit
- India’s Census recognized that the city proper and its urban landscape are not necessarily the same. The census definition of cities has changed from time to time:
- Until 1951: Data published only for individual towns and cities.
- 1961: The concept of Urban Agglomeration (UA) — two neighbouring towns could fall under a single “town group.”
- 1971: The concept was formally adopted. A UA = a continuous urban spread constituting a town and its urban outgrowths, or two or more physically contiguous towns together with recognized urban outgrowths (railway colonies, university campuses, port areas etc.).
- Also in 1971: The Standard Urban Area (SUA) — a statistical spatial reporting unit envisaged as the basis for urban development planning for any concerned city or town with population of at least 50,000 in 1971. It includes adjoining towns, their outgrowths, and intervening rural pockets likely to be urbanized in the near future. Remained as reporting unit for 1971, 1981, and 1991 Census, after which it was discontinued.
- 1991 Census: Recognizes towns and Urban Agglomerations (UAs). The Calcutta UA, for example, includes 129 urban units (Uluberia, Rishra etc.) and 25 outgrowths (cantonments of Shyamnagar, Dum Dum etc.).
Key Indian Examples of Sphere of Urban Influence
| City / Region | Nature of Sphere | Key Features |
|---|---|---|
| National Capital Region (NCR) | Administrative metropolitan region — India’s most explicitly planned sphere of urban influence | Includes Delhi + parts of Haryana (Gurugram, Faridabad, Sonipat, Rohtak), UP (Noida, Ghaziabad, Meerut, Hapur), Rajasthan (Alwar). Covers ~55,083 sq km. Planned to decongest Delhi by developing counter-magnets. |
| Calcutta / Kolkata Metropolitan District | Colonial and post-independence metropolitan sphere | Extended along the Hooghly River north and south of Kolkata, incorporating the Hooghly Industrial Belt. The UA includes 129 urban units. The partition-era refugee influx dramatically extended the fringe zone. |
| Mumbai Metropolitan Region (MMR) | Western India’s dominant urban sphere | Includes Mumbai, Navi Mumbai, Thane, Kalyan-Dombivli, extending into Pune corridor. Mumbai-Pune region shows conurbation characteristics. MMR covers ~4,355 sq km. |
| Bengaluru Metropolitan Region | IT-era sphere expansion | Post-1991 expansion driven by IT industry — Electronic City, Whitefield, Outer Ring Road corridor push the effective sphere out to satellite towns like Devanahalli, Hosur, Tumkur. |
| Varanasi Urban Region | Ancient city’s cultural and commercial sphere | Sphere extends significantly for pilgrimage/religious functions (national reach) while the daily commercial sphere covers a smaller surrounding district-level area — illustrating multiple overlapping spheres of different functional extents. |
Why Western Models of Sphere of Influence are Imperfectly Applicable to India
- Topographic diversity — India’s terrain ranges from Himalayan mountains to desert, riverine delta to plateau — preventing the isotropic plain assumptions of Christaller or Reilly from holding.
- Socio-economic inequality — richer sections bypass lower-order centres to access higher-order services; poorer sections are confined to locally available services — violating the assumption of uniform consumer behaviour.
- Multipurpose trip behaviour — Indian consumers often combine trips for multiple services in a single journey to a higher-order centre, rather than visiting the nearest available centre for each service.
- Cultural and religious factors — pilgrimage towns, temple towns, and dargah-based economies create non-market spheres of influence not captured by Christaller or Reilly.
- Colonial legacy — colonial port cities (Mumbai, Kolkata, Chennai) developed dominant spheres of influence driven by administrative fiat rather than market optimization, creating permanent distortions in the hierarchical arrangement.
- Rapid unplanned urbanization — urban sprawl and fringe development in India often precede infrastructure provision, creating disorganized and unpredictable sphere boundaries.
Planning Implications — Managing the Sphere of Urban Influence
- Understanding the sphere of urban influence is not merely academic — it has direct, practical implications for urban and regional planning. The key insight is that urban planning cannot stop at the municipal boundary of the city proper. The forces shaping urban growth — migration, commuting, land use change, infrastructure demand — all operate at the scale of the city’s sphere of influence.
- Metropolitan Planning Regions
- The logical planning unit is the entire sphere of urban influence — not just the municipal city. India’s NCR (National Capital Region), Bengaluru Metropolitan Region, and Mumbai Metropolitan Region are all defined at the scale of the city’s sphere rather than the statutory city boundary. Planning decisions about land use, transport, housing, and industry must be made at this regional scale.
- Green Belts
- To control urban sprawl and limit the outward expansion of the sphere of influence, Green Belts are created around cities — agricultural or open land that is preserved from development. Ebenezer Howard (1898) first visualized this concept; the first Green Belt was created around London in 1935. In India, Delhi’s Master Plan includes Green Belt provisions, though enforcement has been weak.
- Counter-Magnets and Satellite Towns
- When a city’s sphere of influence becomes dangerously over-extended (leading to over-crowding, infrastructure collapse), planning policy creates counter-magnets — new towns or developed secondary cities within the sphere designed to attract investment and population away from the core. Navi Mumbai (counter-magnet for Mumbai), Noida and Gurgaon (counter-magnets for Delhi) are Indian examples.
- New Towns
- The idea of New Towns evolved in England at the end of the 19th century. Its formal implementation was a post-WWII phenomenon aimed at reconstructing war-torn London. New Towns were designed to receive overflow population from major cities, providing employment and services within the sphere of influence while reducing pressure on the core. India’s post-independence new towns (Chandigarh, Gandhinagar, Naya Raipur) follow this concept.
- Smart Cities Mission
- India’s Smart Cities Mission (100 cities, launched 2015) explicitly recognizes the sphere of urban influence by requiring cities to prepare comprehensive plans for their Area-Based Development (ABD) zone and Pan-City Solutions. The mission aims to develop secondary and tertiary cities in India’s urban hierarchy — reducing the over-concentration of population and functions in a few mega-cities.
- PM Gati Shakti & Urban Connectivity
- India’s PM Gati Shakti National Master Plan (2021) — a multimodal connectivity initiative — directly impacts the sphere of urban influence by extending the effective commuting zone of major cities through expressways, Metro Rail extensions, and freight corridors. Greater connectivity means a larger, more integrated sphere of influence — reshaping the city-region relationship across India.
- Metropolitan Planning Regions
Conclusion
- The sphere of urban influence is the geographic expression of a fundamental truth: no city exists in isolation. Every urban centre is embedded in a web of functional relationships with its surrounding territory — drawing resources, population, and raw materials from its hinterland while supplying goods, services, employment, and cultural energy in return. The sphere of influence is the spatial fingerprint of these relationships.
- From Christaller’s elegant hexagonal complementary regions and Dickinson’s city region framework to Geddes’s conurbation and Gottmann’s megalopolis, the intellectual history of this concept reflects the progressive expansion of cities themselves — from walled medieval towns with sharply defined limits to sprawling metropolitan regions whose influence stretches across entire river basins and economic zones.
- For India, the concept is of urgent planning relevance. Mega-cities like Delhi, Mumbai, Bengaluru, and Kolkata have spheres of influence that extend far beyond their municipal boundaries — encompassing satellite towns, commuter villages, periurban fringes, and regional hinterlands. Managing these spheres through integrated metropolitan planning, green belts, counter-magnets, and new towns is not just good geography — it is the challenge that will define the quality of urban life for hundreds of millions of Indians in the decades ahead.





Well curated article.Thank you
May I know the sources, as whole aspect is not covered in Majid Husain
Sources could be rushikesh sir notes then you can also prefer internet….nd may go through topper copies
From which website you get the toppers copies
Visit: https://lotusarise.com/optional/geography-optional-toppers-answer-copy/
thanks a lot sir
This is really a good content.