

- Population ageing is the rise in the share of older people (60+ or 65+) in a population, and a matching rise in its median age. It is not the same as people living longer: a population ages mainly because fewer children are born.
- It is the late, near-universal outcome of the demographic transition. In 2024 about 10% of the world’s people were aged 65+, against 5% in 1950. Japan and Europe are already “super-aged”; India crossed the 7% “ageing” threshold in 2024.
- Ageing reshapes the age composition of the population: it raises the old-age dependency ratio, shrinks the labour force and creates a geriatric challenge of pensions, health and long-term care.
Concept and Measures

Key Terms
- Ageing population: a population whose elderly share is rising. Individual ageing (growing old) is a biological process; population ageing is a demographic one.
- Gerontology: the study of ageing and of older people. Geriatrics: the branch of medicine that deals with the health care of the elderly.
- Geriatric population: people aged 60+ in India (the definition used by the National Policy on Older Persons, 1999, and the Census); 65+ in most international statistics.
- Ageing of the aged: faster growth of the oldest-old (80+) than of the elderly as a whole. In India the 80+ population is projected to grow by 279% between 2022 and 2050, against 134% for all those aged 60+ (India Ageing Report 2023).
- Feminisation of ageing: women outnumber men at older ages because they live longer. Many of them are widowed, poor and dependent.
Measures of Ageing
| Measure | Formula / threshold | World 2024 | Japan 2024 | India 2024 |
|---|---|---|---|---|
| Share aged 65+ | P65+ ÷ P × 100 | 10.2% | 29.8% | 7.1% |
| Median age (2025) | Age dividing population in half | 31 | 50 | 29 |
| Old-age dependency ratio | P65+ ÷ P15–64 × 100 | 16 | 51 | 11 |
| Ageing index | P65+ ÷ P0–14 × 100 | 41 | 260 | 29 |
| Potential support ratio | P15–64 ÷ P65+ | 6.4 | 2.0 | 9.6 |
- Thresholds used to class societies by the 65+ share:
- Ageing society: 7%.
- Aged society: 14%.
- Super-aged society: 21% (Japan from 2007; Italy, Germany, Portugal, Greece and Finland since).
- The old-age dependency ratio measures the burden of the elderly on the working ages. The ageing index compares the old with the young and is the most sensitive single index of ageing.
- Life expectancy at 60 and healthy life expectancy (years lived in good health) show how long, and how well, the elderly live.
- In India a person aged 60 can expect to live another 18.3 years: 19 for women and 17.5 for men (India Ageing Report 2023).
- Prospective age (Warren Sanderson and Sergei Scherbov, 2005) counts age by remaining life expectancy rather than years lived. If people aged 70 today are as healthy as people aged 60 were in 1970, then “old” begins later. On this measure ageing looks less alarming than on fixed thresholds.
Causes of Population Ageing
Fertility Decline: Ageing from the Base
- The main cause. When births fall, each new cohort is smaller than the one before, so the pyramid narrows at the base and the older share rises.
- Fertility has fallen below the replacement level of about 2.1 in two-thirds of the world’s population.
- South Korea has the lowest fertility in the world: a total fertility rate of 0.72 in 2023 and 0.75 in 2024.
- Japan, Italy, Spain and China are near 1.0–1.3. India was at 1.9 in 2024 (Sample Registration System, SRS).
- Fertility decline has well-known causes: education and employment of women, urbanisation, later marriage, contraception, the cost of raising children and, in China, the one-child policy (1980–2015).
- The determinants are discussed under fertility measures and determinants.
Rising Longevity: Ageing from the Top
- Falling mortality at older ages keeps more people alive into their 80s and 90s.
- World life expectancy at birth reached about 73 years in 2024. It is above 84 in Japan and about 70–72 in India (SRS 2017–21 gives 69.8).
- In the early stages of the transition, falling mortality saves mostly infants, which makes a population younger. Only once infant mortality is low do further gains come at old ages and add to ageing.
- The epidemiological transition from infectious to chronic diseases is the health side of the same change. It is traced under epidemiological and health transition.
Migration
- Migration is age-selective, so it can age or rejuvenate a region quickly:
- Out-migration of the young ages the source region. Examples are rural Japan, Eastern Europe (Bulgaria, Latvia, Lithuania), the Uttarakhand hills, and Kerala, whose young men work in the Gulf.
- In-migration of workers keeps the destination young. The Gulf states (65+ share under 2%), Singapore and Australia are examples.
- Retirement migration creates elderly concentrations: Florida, Arizona, the Spanish Mediterranean coast, and hill and coastal towns in India.
- Replacement migration (immigration to offset ageing) is used by Germany, Canada and Australia. It can slow ageing but cannot stop it, because the migrants themselves grow old.
Population Momentum and Baby Booms
- Large past cohorts move up the pyramid. The baby-boom generation (born 1946–64 in the USA and Europe) is now retiring, which is raising old-age dependency there sharply in the 2020s.
- India’s large cohorts of the 1970s–1990s will produce the same surge in its elderly numbers after 2040.
World Pattern
Distribution
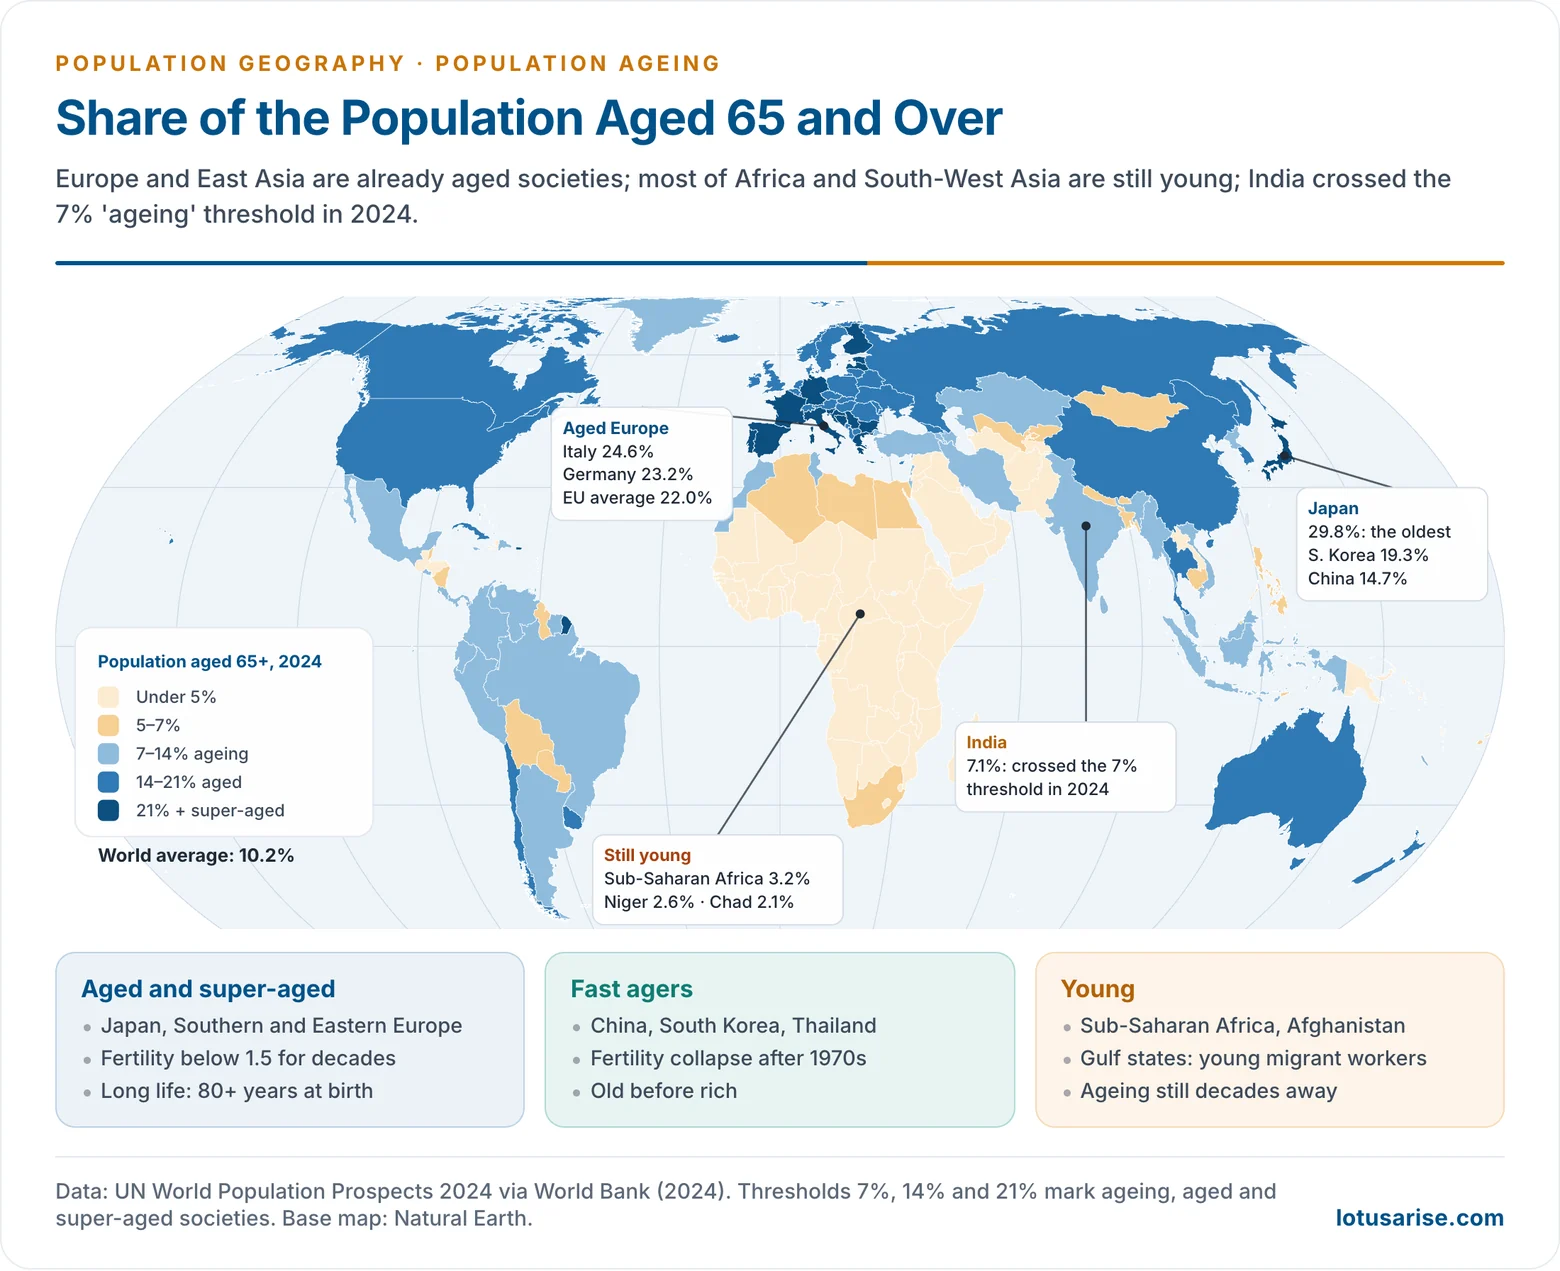
- Most aged: Japan (29.8% aged 65+ in 2024; median age about 50), followed by Italy (24.6%), Portugal, Greece, Finland and Germany (23.2%). The European Union as a whole is at 22.0%.
- Fast-ageing East Asia: South Korea (19.3%), Hong Kong, Taiwan, Thailand (15.4%) and China (14.7%).
- North America, Russia and Australia: 17–18%.
- Intermediate: Latin America (Brazil 11.0%), South-East Asia, Sri Lanka (12.1%) and India (7.1%).
- Youngest: Sub-Saharan Africa (3.2%; Niger 2.6%, Chad 2.1%), Afghanistan, Yemen and the Gulf states (UAE 1.8%, Qatar 1.7%).
- The world’s 65+ population was about 830 million in 2024. UN World Population Prospects 2024 projects that by the late 2070s people aged 65+ will outnumber children under 18.
Speed of Ageing
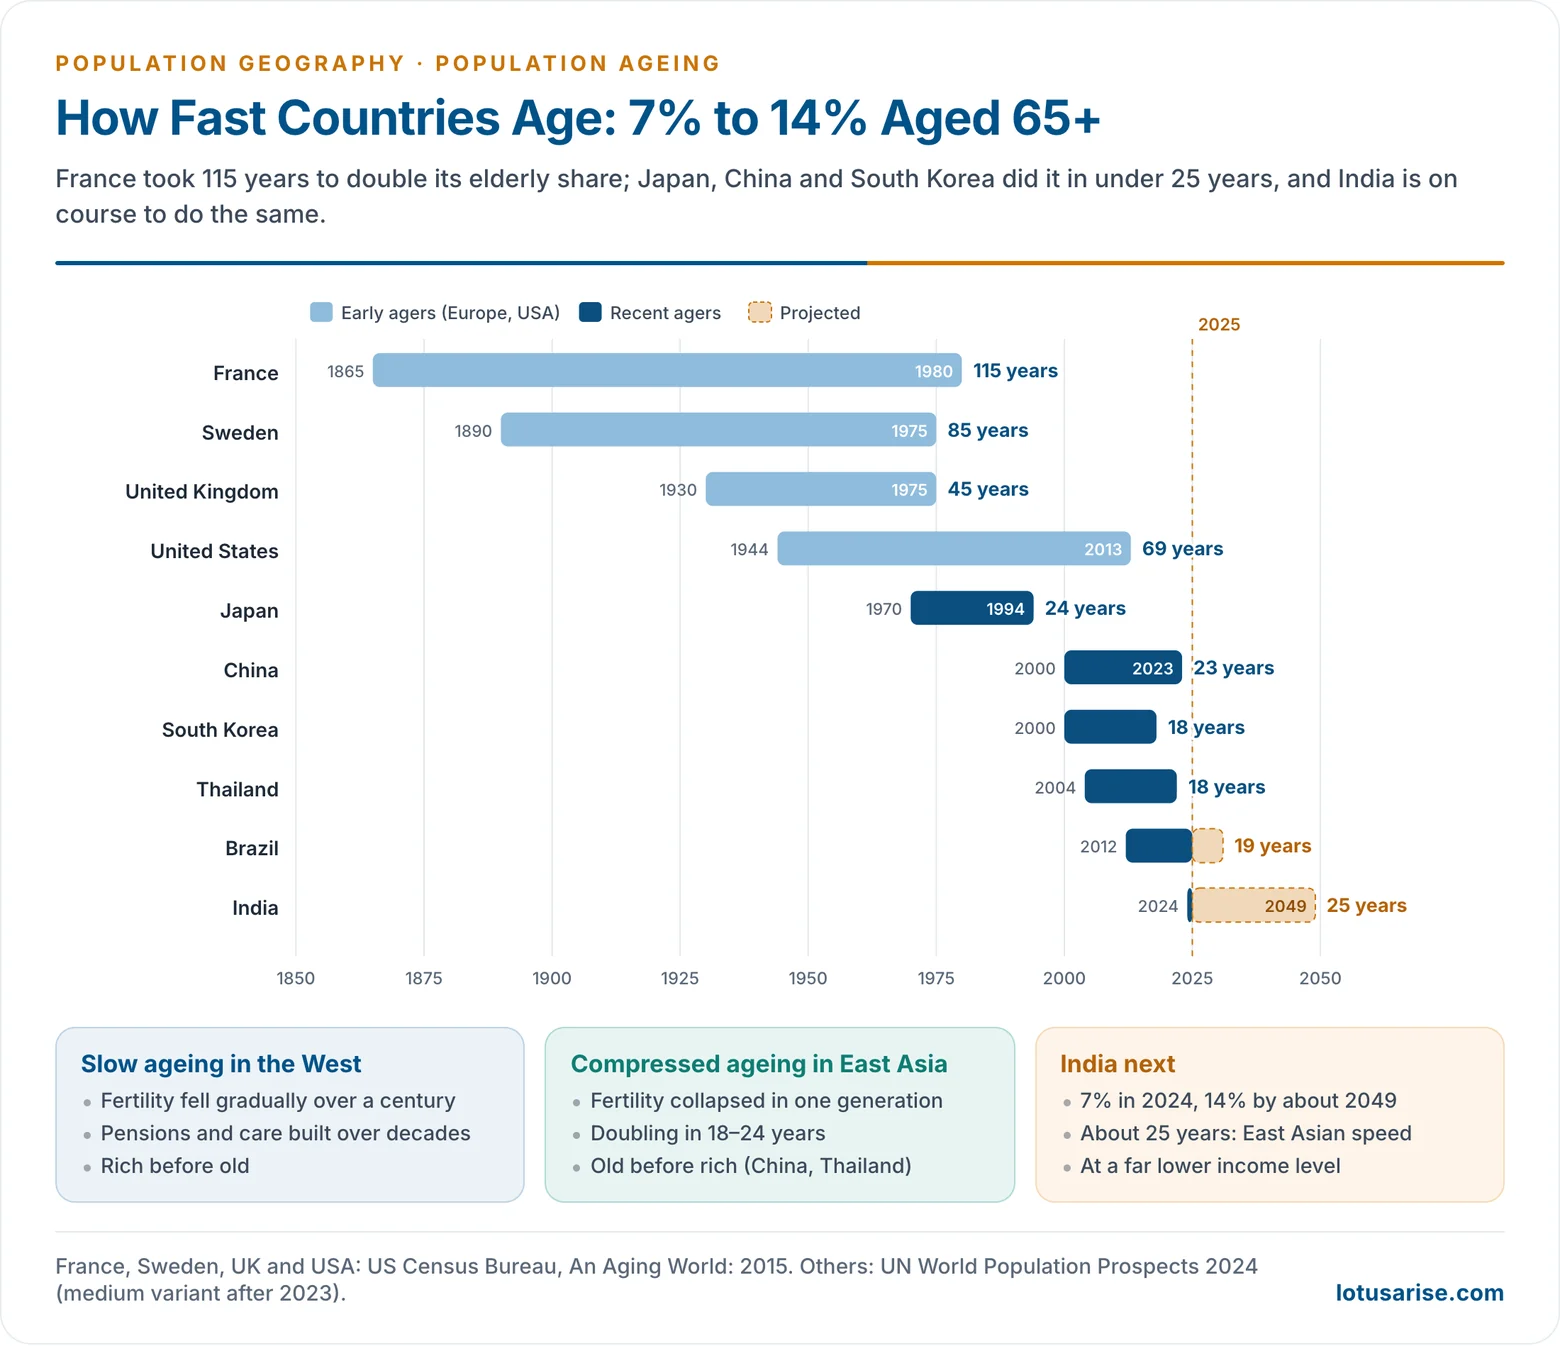
- The speed of ageing is measured by the number of years the 65+ share takes to double from 7% to 14%:
- France took 115 years (1865–1980) and Sweden 85. The United States took 69 and the United Kingdom 45.
- Japan took 24 (1970–1994), China 23 (2000–2023) and South Korea only 18 (2000–2018).
- India is projected to take about 25 years (2024–2049).
- Europe aged slowly, over a century of gradual fertility decline. It built its pension and care systems as it aged, so it became rich before it became old.
- East Asia’s fertility collapsed within one generation, so it is ageing in compressed time.
- China, Thailand and India are growing old before they become rich: they will have Japanese levels of ageing at a fraction of Japan’s income.
| Country | 65+ share 2024 | Total fertility | Main features | Main responses |
|---|---|---|---|---|
| Japan | 29.8% | About 1.2 | Oldest large country; population falling since about 2010 | Long-term care insurance (2000), later retirement, care robots, foreign care workers |
| Italy, Germany | 23–25% | About 1.2–1.4 | Old Europe; shrinking workforce | Pension reform, retirement age 67, immigration |
| South Korea | 19.3% | 0.72 (2023) | Fastest ageing in the world | Cash incentives for births, basic pension |
| China | 14.7% | About 1.0 | One-child legacy; old before rich | Two- and three-child policies; retirement age raised from 2025 |
| India | 7.1% | 1.9 (2024) | Early stage; south ages first | Pensions, health schemes for 70+, care policy |
Old-Age Dependency over Time
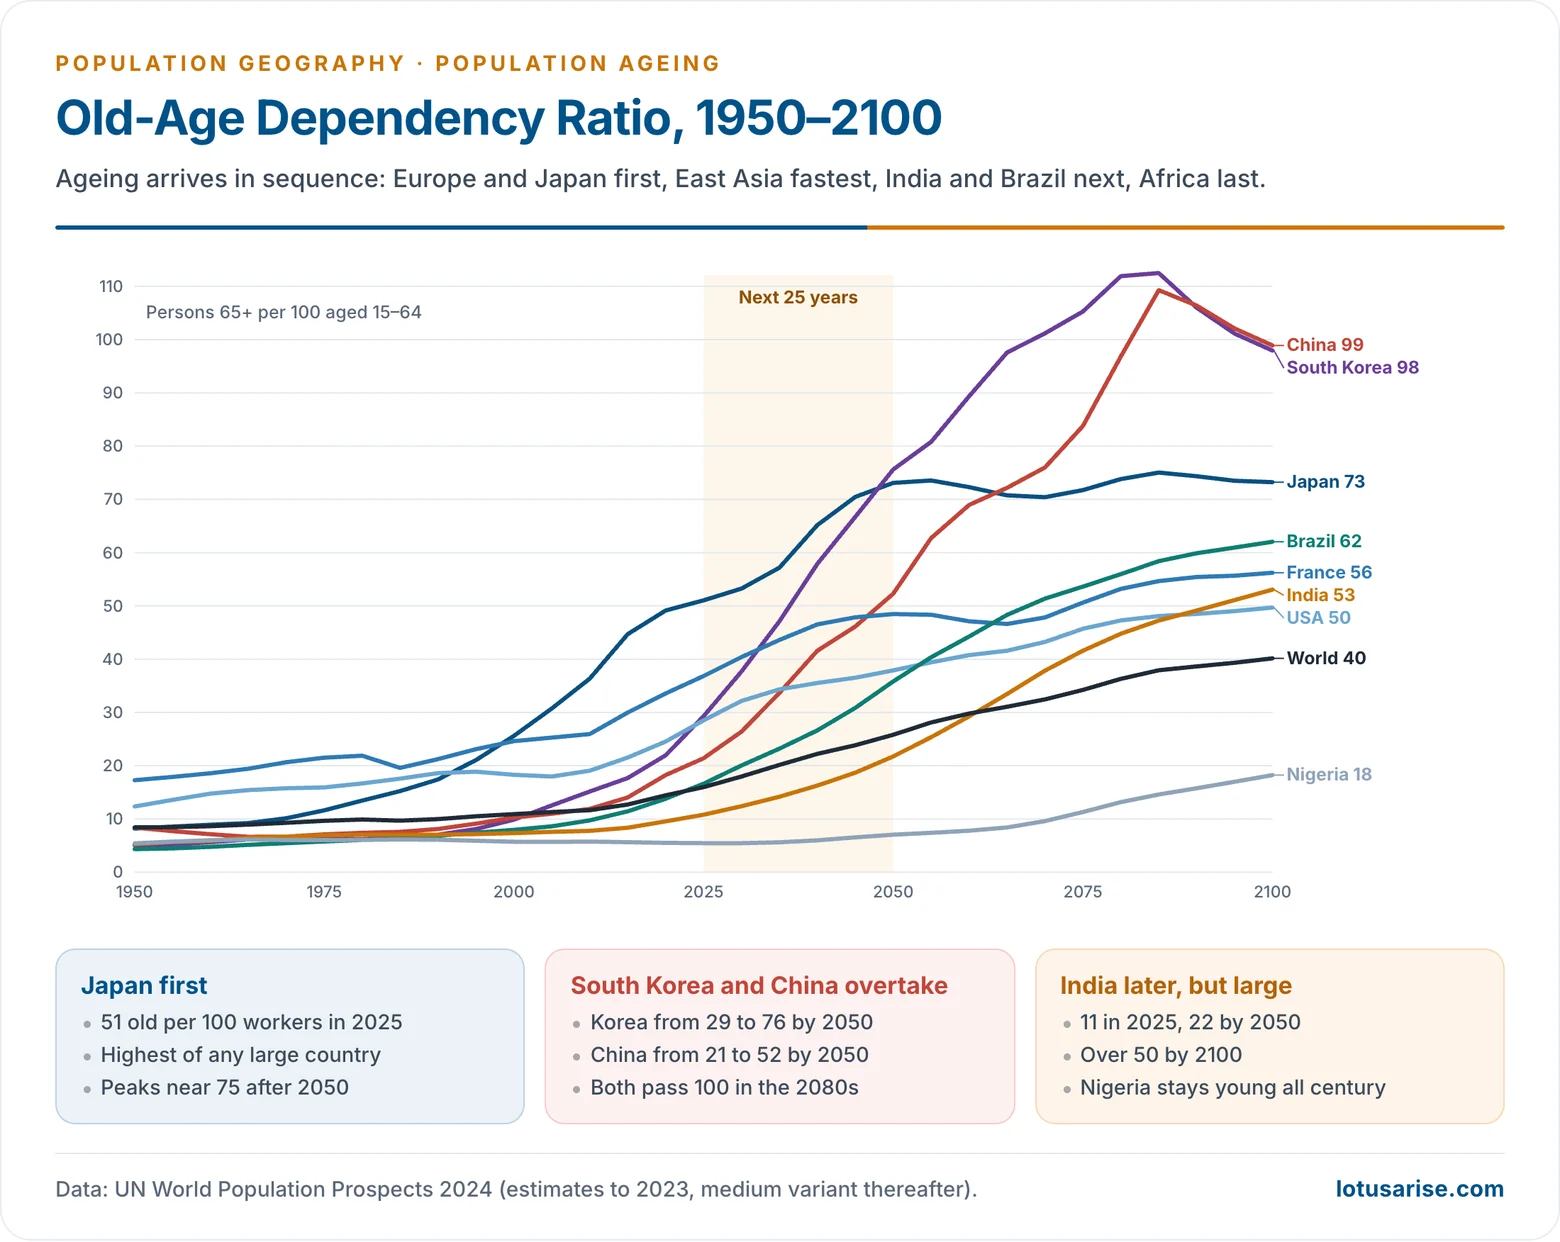
- Ageing reaches countries in sequence. Japan’s old-age dependency ratio passed 50 in 2025. South Korea’s is projected to rise from 29 to 76 by 2050, and China’s from 21 to 52.
- India’s ratio is projected to double from 11 to 22 by 2050. Nigeria’s stays below 20 through the century.
- The world thus has rapid growth in some places (Sub-Saharan Africa) and rapid ageing in others (East Asia, Europe). Both are problems, but they need opposite policies.
Ageing in India
Level and Trend
- Census 2011: 103 million people aged 60+ (8.6%). The elderly sex ratio was 1033 women per 1000 men.
- India Ageing Report 2023 (International Institute for Population Sciences and UNFPA):
- 149 million aged 60+ on 1 July 2022, 10.5% of the population.
- 15% by 2036, and 347 million (20.8%) by 2050. The elderly will outnumber children by mid-century, and they will form over 36% of the population by 2100.
- Ageing index: 39 older persons per 100 children (2021). Old-age dependency ratio: 16 per 100 aged 15–59 (2021); about 20 in the south.
- SRS 2024: the 60+ share was 9.7%, with Kerala highest at 15.1%. In Kerala, 79% of all deaths now occur at ages 60+.
- NFHS-6 (2023–24): 12.9% of household members were aged 60+, against 11.8% in NFHS-5. The share was higher in rural (13.0%) than in urban areas (12.7%).
- As a household survey, it counts the usually resident population. It misses working-age migrants who live away, so its elderly share runs higher than in projections.
- The first census since 2011 has its population reference date on 1 March 2027. Until then, these projections and surveys are the best guide.
Regional Pattern
- India’s ageing is regionally staggered, because the states are at different stages of the demographic transition:
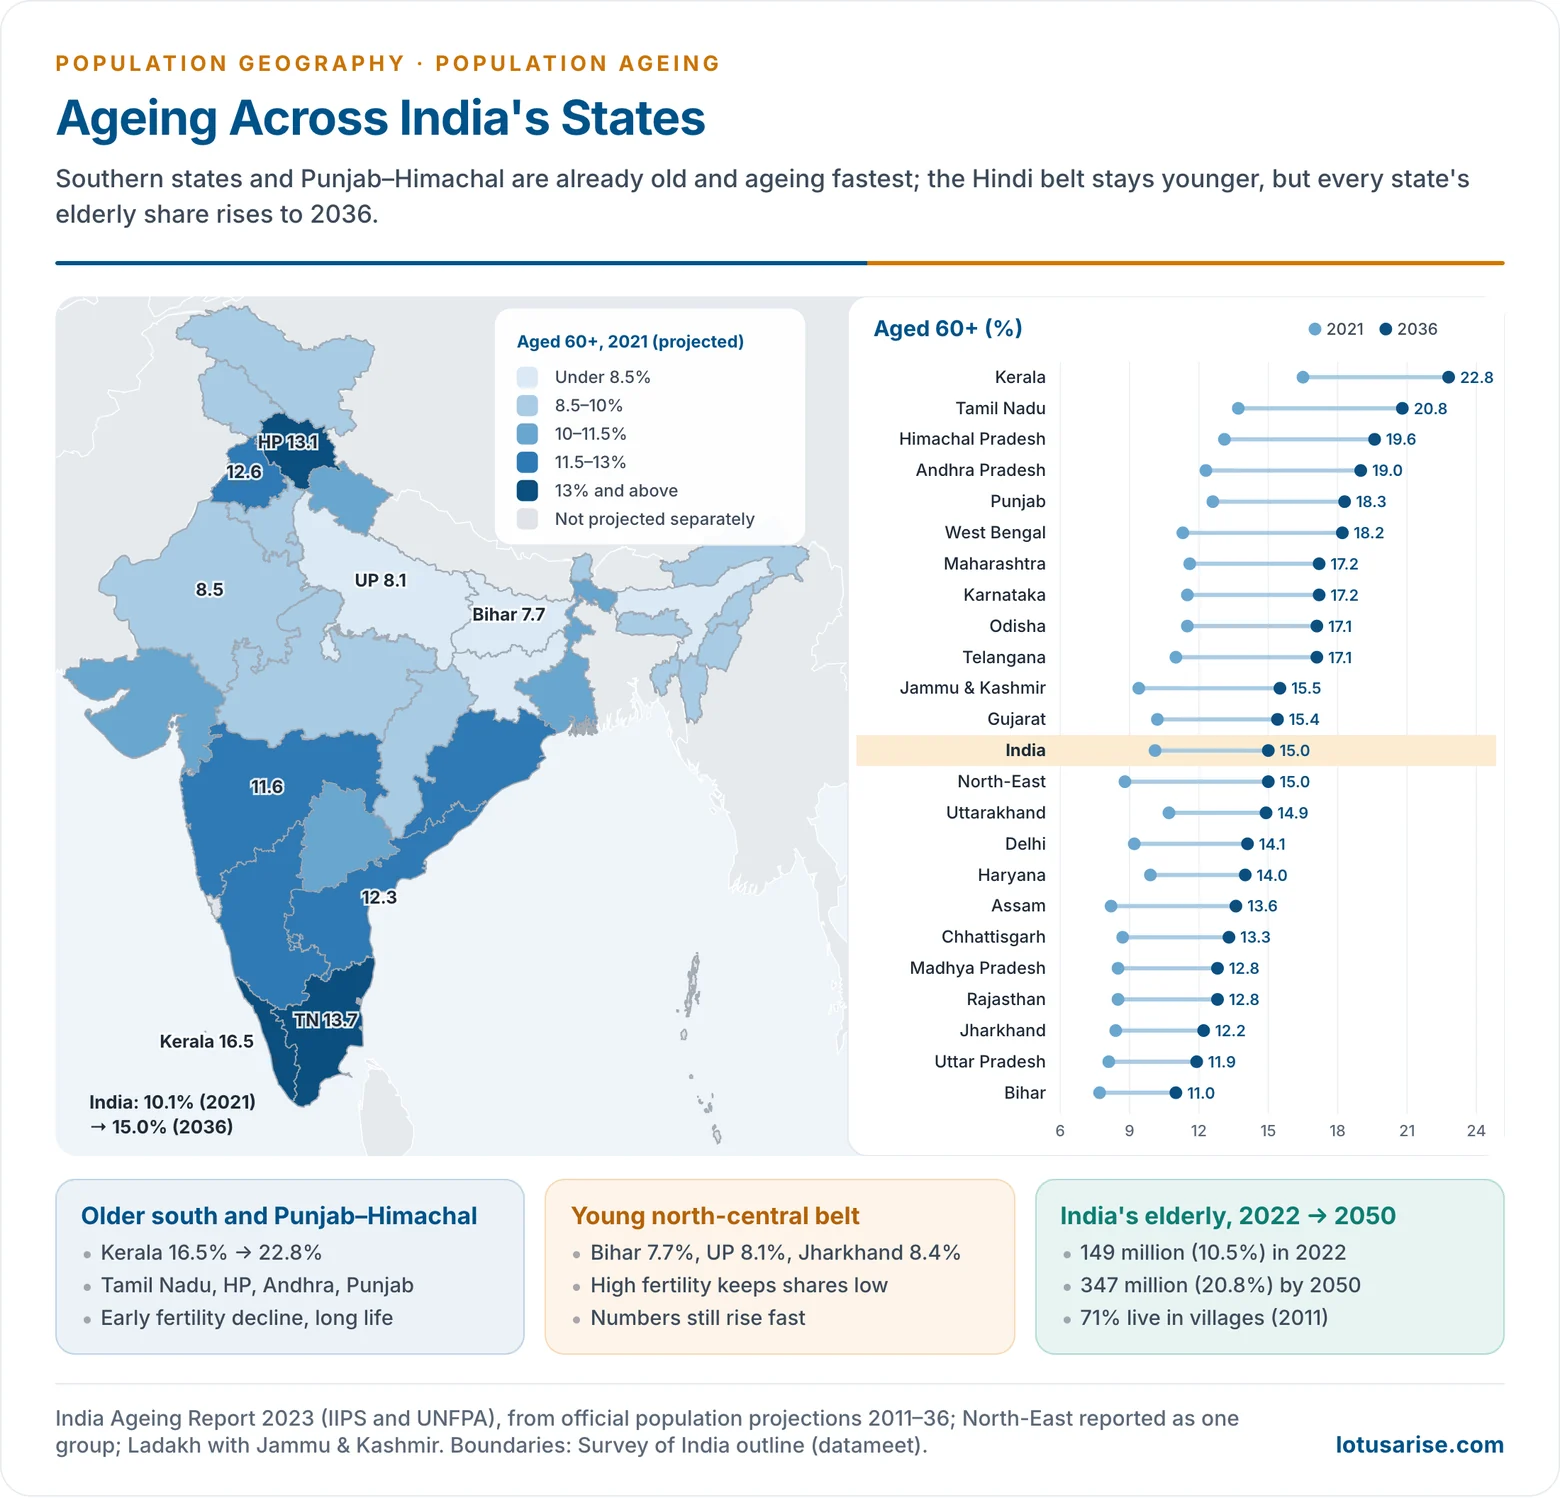
- Oldest: Kerala (16.5% aged 60+ in 2021, projected to reach 22.8% in 2036), Tamil Nadu (13.7%), Himachal Pradesh, Andhra Pradesh and Punjab.
- These states had early fertility decline, long life expectancy and, in Kerala and the hills, out-migration of the young.
- Youngest: Bihar (7.7%), Uttar Pradesh (8.1%), Jharkhand, Rajasthan and Madhya Pradesh. Fertility is still near or above replacement there.
- Oldest: Kerala (16.5% aged 60+ in 2021, projected to reach 22.8% in 2036), Tamil Nadu (13.7%), Himachal Pradesh, Andhra Pradesh and Punjab.
- Ruralisation: about 71% of older persons live in villages (Census 2011). Rural areas lose their young to the cities and have far fewer geriatric services.
- Feminisation: older women outnumber older men, and widowhood is far more common among them. Life expectancy at 60 is 23 years for women in Himachal Pradesh and 22 in Kerala, about 4 years more than for men.
Consequences: The Geriatric Challenge
Economic
- Shrinking labour force and slower growth: Japan’s working-age population has been falling since the mid-1990s, and its total population since about 2010. Labour shortages are now acute in its care, construction and farm sectors.
- Fiscal burden: pensions, health care and long-term care take a rising share of public spending, while the tax base of workers shrinks.
- Pay-as-you-go pension systems are hit hardest, because their support ratios are falling.
- Savings and consumption: households run down savings in retirement. Demand shifts towards health care, care services and leisure: the “silver economy“.
- Old before rich: in India most older people have no pension.
- About 18.7% of the elderly have no income. Over 40% are in the poorest wealth quintile (India Ageing Report 2023).
- 37% of people aged 60+ are still in the labour force (PLFS 2025), mostly in informal and farm work.
Social
- Changing living arrangements: joint families are giving way to nuclear families. More older people live alone or only with a spouse, especially in Kerala, Tamil Nadu and Goa, where the children have migrated.
- Feminisation and widowhood: older women are more often widowed, without assets or income, and fully dependent on family.
- Elder abuse, neglect and loneliness, and a rising demand for institutional care (old-age homes, day-care centres).
- Intergenerational strain: fewer working adults support more elderly parents (the “sandwich generation“).
Health
- Ageing brings the double burden of chronic disease and disability. The Longitudinal Ageing Study in India (LASI Wave 1, 2017–18) found:
- About 75% of the elderly have one or more chronic diseases.
- About 40% have some disability, and about 20% have mental health problems.
- About 30% of those aged 60+ show depressive symptoms.
- Hypertension (32%) and diabetes (14%) are the most common diagnosed conditions.
- Demand rises for geriatric specialists, long-term care and palliative care, which India has in short supply.
Spatial and Political
- Rural depopulation: Japan’s “marginal villages”, where over half the residents are 65+, and the emptying villages of Spain, Italy and Uttarakhand.
- School closures and surplus infrastructure in ageing areas, with rising demand for accessible housing and transport.
- The “grey vote”: older voters gain political weight, which makes pension reform politically difficult.
Opportunities
- A silver dividend: healthy older people can keep working, volunteering and caring for grandchildren.
- The growing market for health care, assistive devices and care services creates new jobs.
- Healthy ageing reduces the burden. This is the logic of the UN Decade of Healthy Ageing (2021–2030).
Policy Responses
International
- UN Principles for Older Persons (1991): independence, participation, care, self-fulfilment and dignity.
- Madrid International Plan of Action on Ageing (2002), adopted at the Second World Assembly on Ageing.
- UN Decade of Healthy Ageing (2021–2030), led by the World Health Organization.
- National responses:
- Pro-natalist policies (child allowances, parental leave, childcare) in France, the Nordic countries, South Korea and China. They are compared under population policy.
- Raising the retirement age: Germany to 67; China from January 2025, men from 60 to 63, gradually over 15 years.
- Immigration of workers and care staff (Germany, Canada, Japan’s skilled-worker visas from 2019).
- Long-term care insurance (Germany 1995, Japan 2000), automation and care robots in Japan.
India
- National Policy on Older Persons (1999): financial security, health care, shelter and protection from abuse.
- Maintenance and Welfare of Parents and Senior Citizens Act (2007): makes children and heirs legally responsible for maintaining parents, through maintenance tribunals.
- Indira Gandhi National Old Age Pension Scheme (under the National Social Assistance Programme): a monthly central pension for elderly people living below the poverty line, topped up by the states.
- National Programme for Health Care of the Elderly (2010): geriatric wards and clinics from district hospitals down to health centres.
- Ayushman Bharat PM-JAY: extended in 2024 to all citizens aged 70+, whatever their income, with cover of ₹5 lakh a year (Ayushman Vay Vandana card).
- Atal Vayo Abhyuday Yojana: the umbrella scheme of the Ministry of Social Justice and Empowerment.
- It funds old-age homes and Rashtriya Vayoshri Yojana (assistive devices).
- It also runs the Elderline helpline (14567).
- States: Kerala and Tamil Nadu run the most developed elderly-care and pension systems, being the first to age.
- Gaps: low pension amounts; no universal pension for informal workers; shortage of geriatric doctors; few long-term care facilities; weak enforcement of the 2007 Act.
The Way Ahead for India
- Use the remaining demographic window (to about 2050) to build universal pensions and long-term care before ageing peaks.
- Health: primary care for non-communicable diseases, more geriatric training, and home- and community-based care.
- Work: flexible retirement and re-employment of older people, and raising women’s work participation to widen the tax base.
- Regional planning: the south and the hills need care infrastructure now. The north-central states need it in 20–30 years.
Previous Year Questions
2013What are Geriatrics? What are the problems associated with Geriatric population?2015Discuss the social and spatial ramifications of increasing longevity.2016Describe the regional pattern of Life Expectancy in the world and bring out the challenges faced by developing countries due to increasing life expectancy.2017“There are considerable demographic similarities between West European nations and Japan.” Explain.2019Assess the challenges for countries with the largest shares of aged populations.2021Aging population has adverse social and economic consequences. Explain with examples.2025“The global demographic landscape is evolving with rapid population growth in some places and rapid ageing in others.” Elucidate with examples.




