- Mortality (Latin mors, death) is the occurrence of deaths in a population. With fertility and migration it is one of the three components of population change.
- The UN and WHO define death as the permanent disappearance of all evidence of life at any time after live birth: the cessation of vital functions without possibility of resuscitation.
- Death is counted only after a live birth. Abortions and stillbirths are foetal deaths, measured separately, so that the interval between birth and death is life.
- Mortality is studied for its effect on the size, age structure and growth of population, and as one of the most reliable indicators of development.
Concept and Significance

Mortality in Population Dynamics
- Before the modern transition, mortality set the pace of growth. Births were always high; deaths rose and fell with famines, epidemics and wars.
- The decline of mortality started modern growth:
- In Europe in the 18th–19th centuries, better food supply, sanitation and later medicine cut death rates while birth rates stayed high, and populations multiplied.
- In developing countries after 1950, imported public health (DDT, vaccines, antibiotics, safe water) cut deaths far faster than in Europe, giving the “population explosion” of 1950–1990.
- This sequence of falling deaths followed by falling births is the core of the demographic transition; the change in the causes of death is the epidemiological transition.
Mortality as an Indicator of Development
- Early-age mortality, the deaths of infants, children and mothers, is the most sensitive indicator of health care, nutrition, sanitation and women’s status. Most of these deaths are preventable at low cost.
- The world has therefore set mortality targets for decades:
- World Summit for Children (1990): reduce under-five mortality by one-third, or to 70 per 1000, by 2000.
- ICPD, Cairo (1994): long-term targets for infant, child and maternal mortality within reproductive health.
- Millennium Development Goals (2000): Goal 4 to cut under-five mortality by two-thirds between 1990 and 2015; Goal 5 to cut maternal mortality by three-quarters.
- Sustainable Development Goals (2015), Goal 3: by 2030, end preventable deaths of newborns and children, with neonatal mortality at most 12 and under-five mortality at most 25 per 1000 live births, and a global maternal mortality ratio below 70 per lakh live births.
- India’s National Health Policy 2017 set national targets: IMR 28 by 2019, MMR 100 by 2020, under-five mortality 23 and neonatal mortality 16 by 2025, and life expectancy 70 by 2025.
Determinants of Mortality
- Biological:
- Age: deaths are concentrated at the two ends of life.
- Sex: male mortality is higher at almost every age; the reverse in childhood where girls are neglected.
- Socio-economic: income, education (above all mothers’ education), housing, occupation and caste.
- Environmental: safe water and sanitation, indoor and outdoor air pollution, heat, malaria and other vector zones.
- Health system: immunisation, skilled birth attendance, emergency obstetric care, access to hospitals and medicines.
- Lifestyle: tobacco, alcohol, diet and inactivity drive deaths from chronic disease.
- Crises: famine, war, epidemics and disasters produce mortality peaks, such as COVID-19 in 2020–21.
Explaining the Decline of Mortality
- Thomas McKeown (1976) argued that England’s mortality fell in the 19th century mainly through better nutrition and living standards, before effective medicine existed.
- Later work gave more weight to public health: clean water, sewerage, food hygiene and the control of smallpox through vaccination.
- Samuel H. Preston (1975) showed that the curve linking life expectancy to national income shifted upwards over the 20th century. At the same income, countries in 1960 lived far longer than in 1930.
- Most of the gain came from the spread of knowledge and technology (vaccines, antibiotics, oral rehydration), not from income itself.
- This is why poor countries with strong public action, such as Sri Lanka, Costa Rica and Kerala, reached low mortality at low income.
Measurements of Mortality
- Measurement needs reliable death data by age, sex and cause. In India it comes from:
- the Civil Registration System (CRS): registration of births and deaths, now near-complete in many states;
- the Sample Registration System (SRS): annual death rates, IMR and, through verbal autopsy, causes of death;
- NFHS: infant and child mortality from birth histories;
- Medical Certification of Cause of Death (MCCD): medically certified causes, covering only a minority of deaths;
- the Census: indirect estimates from children ever born and surviving.
Crude Death Rate (CDR)
- Definition: deaths in a year per 1000 mid-year population.
- CDR = (D ÷ P) × 1000.
- Strength: simple and needs minimal data, so it is the most widely available measure.
- Limitation: it ignores age and sex composition. An old population has a high CDR even with excellent health:
- Japan 13.3 and Bulgaria 15.6 have higher CDRs than Niger 8.7 or India 6.6 (2024, UN estimates);
- the Gulf states, with young migrant workers, have the world’s lowest (UAE and Qatar about 1).
- CDR is therefore unsuitable for comparing populations of different structure.
- India: 6.4 (SRS 2024): rural 6.8, urban 5.6.
Age-Specific Death Rate (ASDR)
- Definition: deaths in an age group per 1000 people of that age group.
- ASDR(x) = (Dₓ ÷ Pₓ) × 1000; it can be calculated separately for males and females.
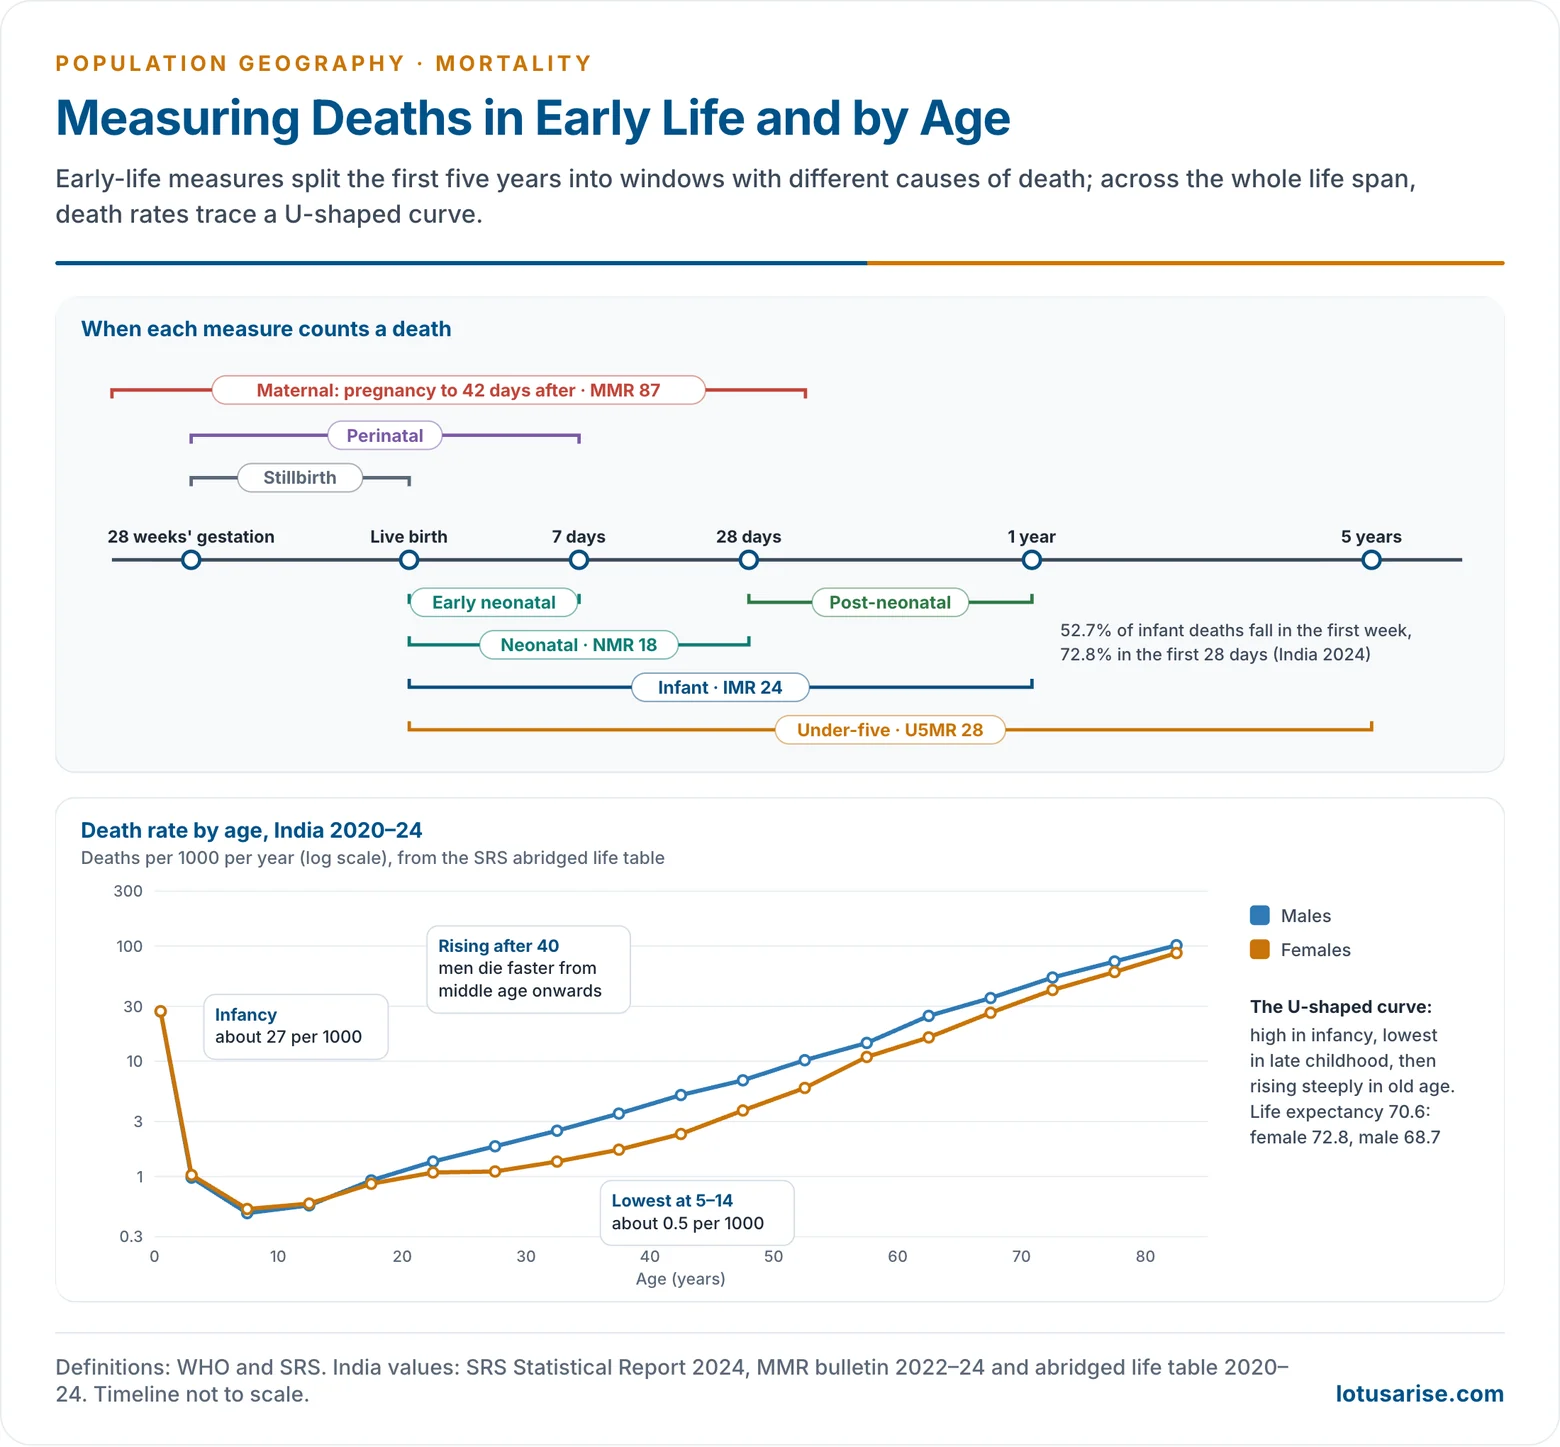
- Plotted against age, ASDRs form a U- or J-shaped curve:
- high in infancy, especially the first month;
- lowest at ages 5–14;
- rising slowly through adulthood and steeply after 60.
- The curve shifts down as health improves. The fall is largest in infancy, so the curve flattens at the young end first.
Standardised Death Rate
- To compare populations fairly, direct standardisation applies each population’s ASDRs to one standard population (for example the WHO world standard).
- The result, the age-standardised death rate, shows what the CDR would be if both populations had the same age structure. It removes the Japan–Niger paradox.
- Indirect standardisation is used for small areas, where ASDRs are unreliable. It applies standard (for example national) ASDRs to the local population to get the deaths expected.
- The standardised mortality ratio (SMR) = observed deaths ÷ expected deaths × 100. Above 100 means mortality worse than the standard.
- SMR maps by district or county are the basic tool of medical geography, used since G. Melvyn Howe’s National Atlas of Disease Mortality for the United Kingdom (1963).
Infant Mortality Rate (IMR) and Its Components
- Definition: deaths of infants under one year per 1000 live births in a year.
- IMR = (D₀ ÷ B) × 1000.
- It is regarded as the most sensitive single indicator of a society’s health and living conditions, because infants are the most vulnerable to poor nutrition, sanitation and care.
- Components by age at death:
- Early neonatal: the first 7 days.
- Neonatal mortality rate (NMR): deaths in the first 28 days per 1000 live births. Mostly endogenous causes: prematurity, low birth weight, birth asphyxia, congenital defects; reduced by better maternal and delivery care.
- Post-neonatal: from 28 days to one year. Mostly exogenous causes: diarrhoea, pneumonia, malnutrition, infections; reduced by sanitation, immunisation and nutrition.
- Perinatal mortality: stillbirths after 28 weeks of pregnancy plus early neonatal deaths, per 1000 births. It measures the quality of obstetric care.
- As IMR falls, deaths concentrate in the first week, because exogenous causes are controlled first.
- In India in 2024, 52.7% of infant deaths occurred in the first week and 72.8% in the first 28 days (SRS).
- Under-five mortality rate (U5MR): the probability of dying before age five, per 1000 live births. It is the SDG headline indicator for children.
- India (SRS 2024): IMR 24, NMR 18, U5MR 28.
Stillbirth Rate
- Definition: stillbirths (foetal deaths after 28 weeks of gestation) per 1000 live births, or per 1000 total births. SBR = (SB ÷ B) × 1000.
- Stillbirths are excluded from mortality statistics, but they reflect the same failures of antenatal and delivery care. The National Health Policy 2017 aimed to bring the stillbirth rate to single digits by 2025.
Maternal Mortality
- Maternal death (WHO, ICD-10): the death of a woman while pregnant or within 42 days of the end of pregnancy, from any cause related to or aggravated by the pregnancy or its management, but not from accidental or incidental causes.
- Maternal mortality ratio (MMR): maternal deaths per 1,00,000 live births. It measures the obstetric risk of each birth.
- MMR = (MD ÷ B) × 1,00,000.
- Maternal mortality rate (MMRate): maternal deaths per 1,00,000 women aged 15–49. It reflects both obstetric risk and how often women give birth.
- Lifetime risk of maternal death combines the two: in Sub-Saharan Africa it is still around 1 in 40, against one in several thousand in Europe.
- Maternal mortality is a cause-specific measure.
- Main causes: haemorrhage, hypertensive disorders of pregnancy, sepsis, unsafe abortion and obstructed labour, made worse by anaemia and early marriage.
- The three delays model (Sereen Thaddeus and Deborah Maine, 1994) traces most deaths to delays in deciding to seek care, in reaching a facility, and in receiving adequate care there.
- India: 87 (SRS 2022–24), down from 130 in 2014–16. Kerala, Tamil Nadu, Maharashtra, Andhra Pradesh, Telangana and Gujarat are already below the SDG target of 70; Uttar Pradesh, Madhya Pradesh, Chhattisgarh and Odisha remain far above 100.
Cause-Specific Death Rate (CSDR)
- Definition: deaths from a particular cause (a disease such as cancer, or an event such as road accidents) per 1,00,000 population.
- CSDR = (Dₛ ÷ P) × K, where K is usually 1,00,000.
- The ideal denominator is the person-years at risk; in practice the mid-year population is used, so it is an approximation.
- The proportional mortality of a cause, its share of all deaths, tracks the epidemiological transition.
- In India, non-communicable diseases caused 60.1% of deaths in 2022–24, with cardiovascular disease alone 32.1%; communicable, maternal, perinatal and nutritional conditions caused 19.7% (SRS).
Life Table and Life Expectancy
- A life table follows a hypothetical cohort of 1,00,000 births through life, subjecting it to the current ASDRs. Its columns are:
- qx: the probability of dying between age x and the next age;
- lx: the number surviving to exact age x;
- dx: deaths between x and the next age;
- Lx: person-years lived in the interval; Tx: person-years lived after age x;
- ex = Tx ÷ lx: life expectancy at age x.
- Complete life tables use single years of age; abridged tables (as published by the SRS) use five-year groups. Period tables use one period’s death rates; cohort tables follow a real generation.
- Life expectancy at birth (e0) is the average number of years a newborn would live if current mortality persisted. It is the best single summary of mortality and one of the three dimensions of the Human Development Index.
- India: 70.6 years (SRS, 2020–24); female 72.8, male 68.7.
- World: 73.5 years (2024). Its world pattern is mapped under demographic attributes.
| Measure | Numerator | Denominator | India, latest |
|---|---|---|---|
| CDR | All deaths | 1000 population | 6.4 (2024) |
| ASDR | Deaths at age x | 1000 people aged x | U-shaped by age |
| IMR | Deaths under 1 year | 1000 live births | 24 (2024) |
| NMR | Deaths under 28 days | 1000 live births | 18 (2024) |
| U5MR | Deaths under 5 years | 1000 live births | 28 (2024) |
| MMR | Maternal deaths | 1,00,000 live births | 87 (2022–24) |
| e0 | Life table | Years | 70.6 (2020–24) |
Trends and Patterns: World
Global Trends
- The global CDR has fallen to about 7.6 per 1000 (2024), and world life expectancy has risen from 51 years in 1960 to 73.5.
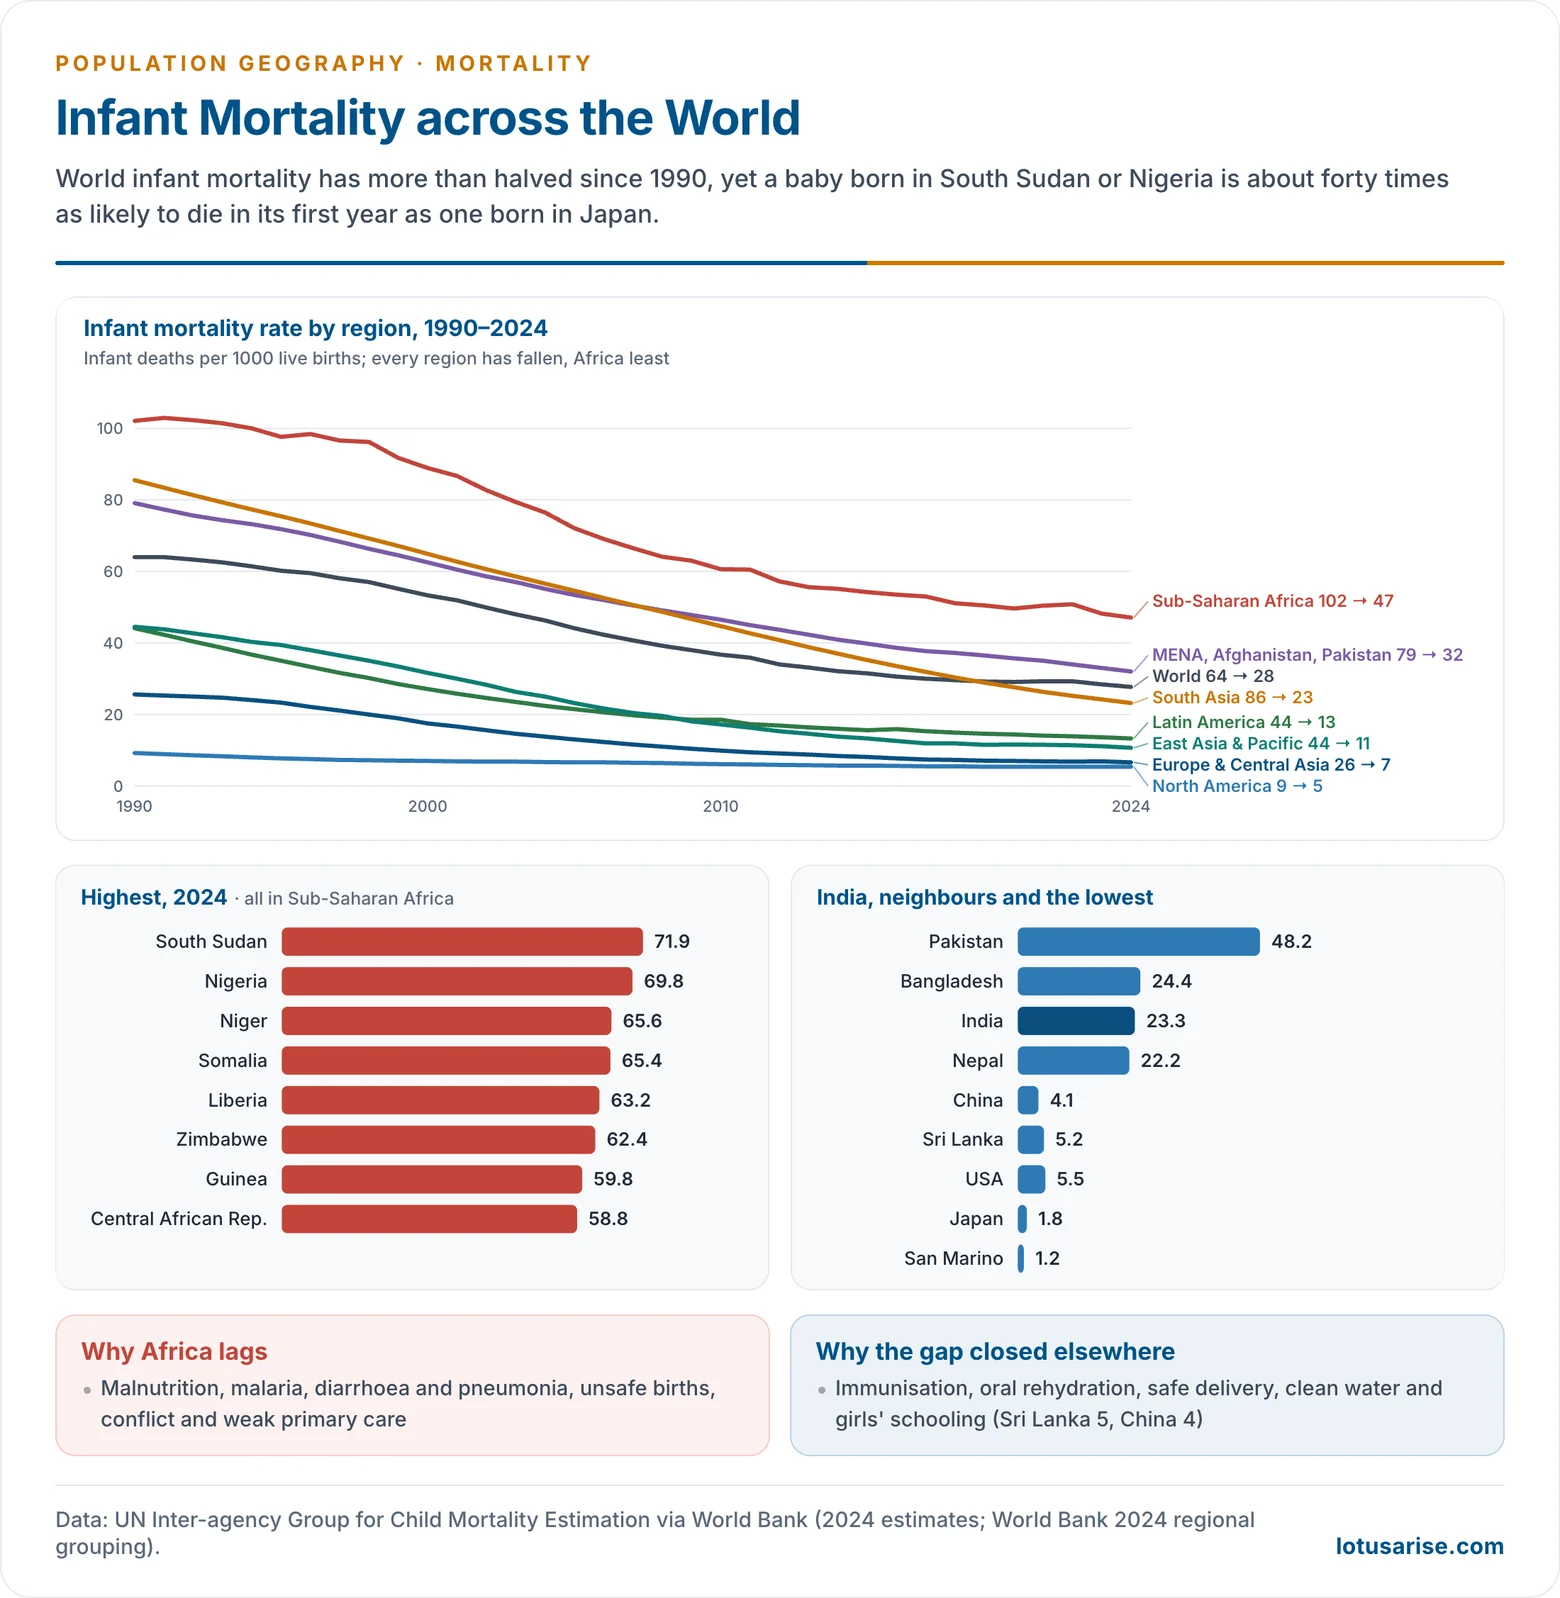
- Infant mortality fell from 64 per 1000 in 1990 to about 28 in 2024, and under-five mortality from about 93 to 37 (UN IGME via World Bank).
- Still, 4.8 million children died before their fifth birthday in 2023, 2.3 million of them in the first month (UN IGME).
- Regional IMR, 1990 → 2024:
- Sub-Saharan Africa: 102 → 47, the highest. Poverty, malnutrition, malaria, conflict and weak health systems keep it high; more than half of all under-five deaths now occur here.
- Middle East, North Africa, Afghanistan and Pakistan: 79 → 32.
- South Asia: 86 → 23, a fall of nearly three-quarters, led by India and Bangladesh.
- East Asia and the Pacific: 45 → 11, and Latin America: 44 → 13, from rapid development and public health.
- Europe and Central Asia: 26 → 7, and North America: 9 → 5, where marginal gains come from neonatal intensive care.
- Maternal mortality: the global MMR was about 197 per 1,00,000 in 2023, with some 2,60,000 maternal deaths, about 70% of them in Sub-Saharan Africa (UN MMEIG).
- Ageing is raising crude death rates in rich and middle-income countries. Deaths have exceeded births in Japan since the mid-2000s and in China since 2022, so their populations are shrinking even as health improves.
- Sex differentials: women outlive men in almost every country. The gap is widest in Russia and the former Soviet states, where alcohol, smoking, accidents and violence kill men in middle age.
Inter-Country Variations
- Highest IMR (2024): South Sudan (72), Nigeria (70), Niger (66), Somalia (65), Liberia, Zimbabwe, Guinea and the Central African Republic.
- Of the 15 countries with the highest IMR, 13 are in Sub-Saharan Africa; the others are Afghanistan and Pakistan (48).
- Nigeria alone has the highest MMR (about 990) and the largest number of child and maternal deaths in the world.
- Lowest IMR: San Marino (1.2), Estonia, Japan, Slovenia and Belarus (1.8), Finland and other Nordic countries (about 2), reflecting universal health care, nutrition and social security.
- India’s neighbours: Sri Lanka 5.2 (an outlier from early investment in health and girls’ schooling), Nepal 22, India 23 (UN estimate), Bangladesh 24, Pakistan 48.
- The pattern shows a clear inverse relationship between IMR and income, female education and human development.
Trends and Patterns: India
Long-Term Decline
- SRS series:
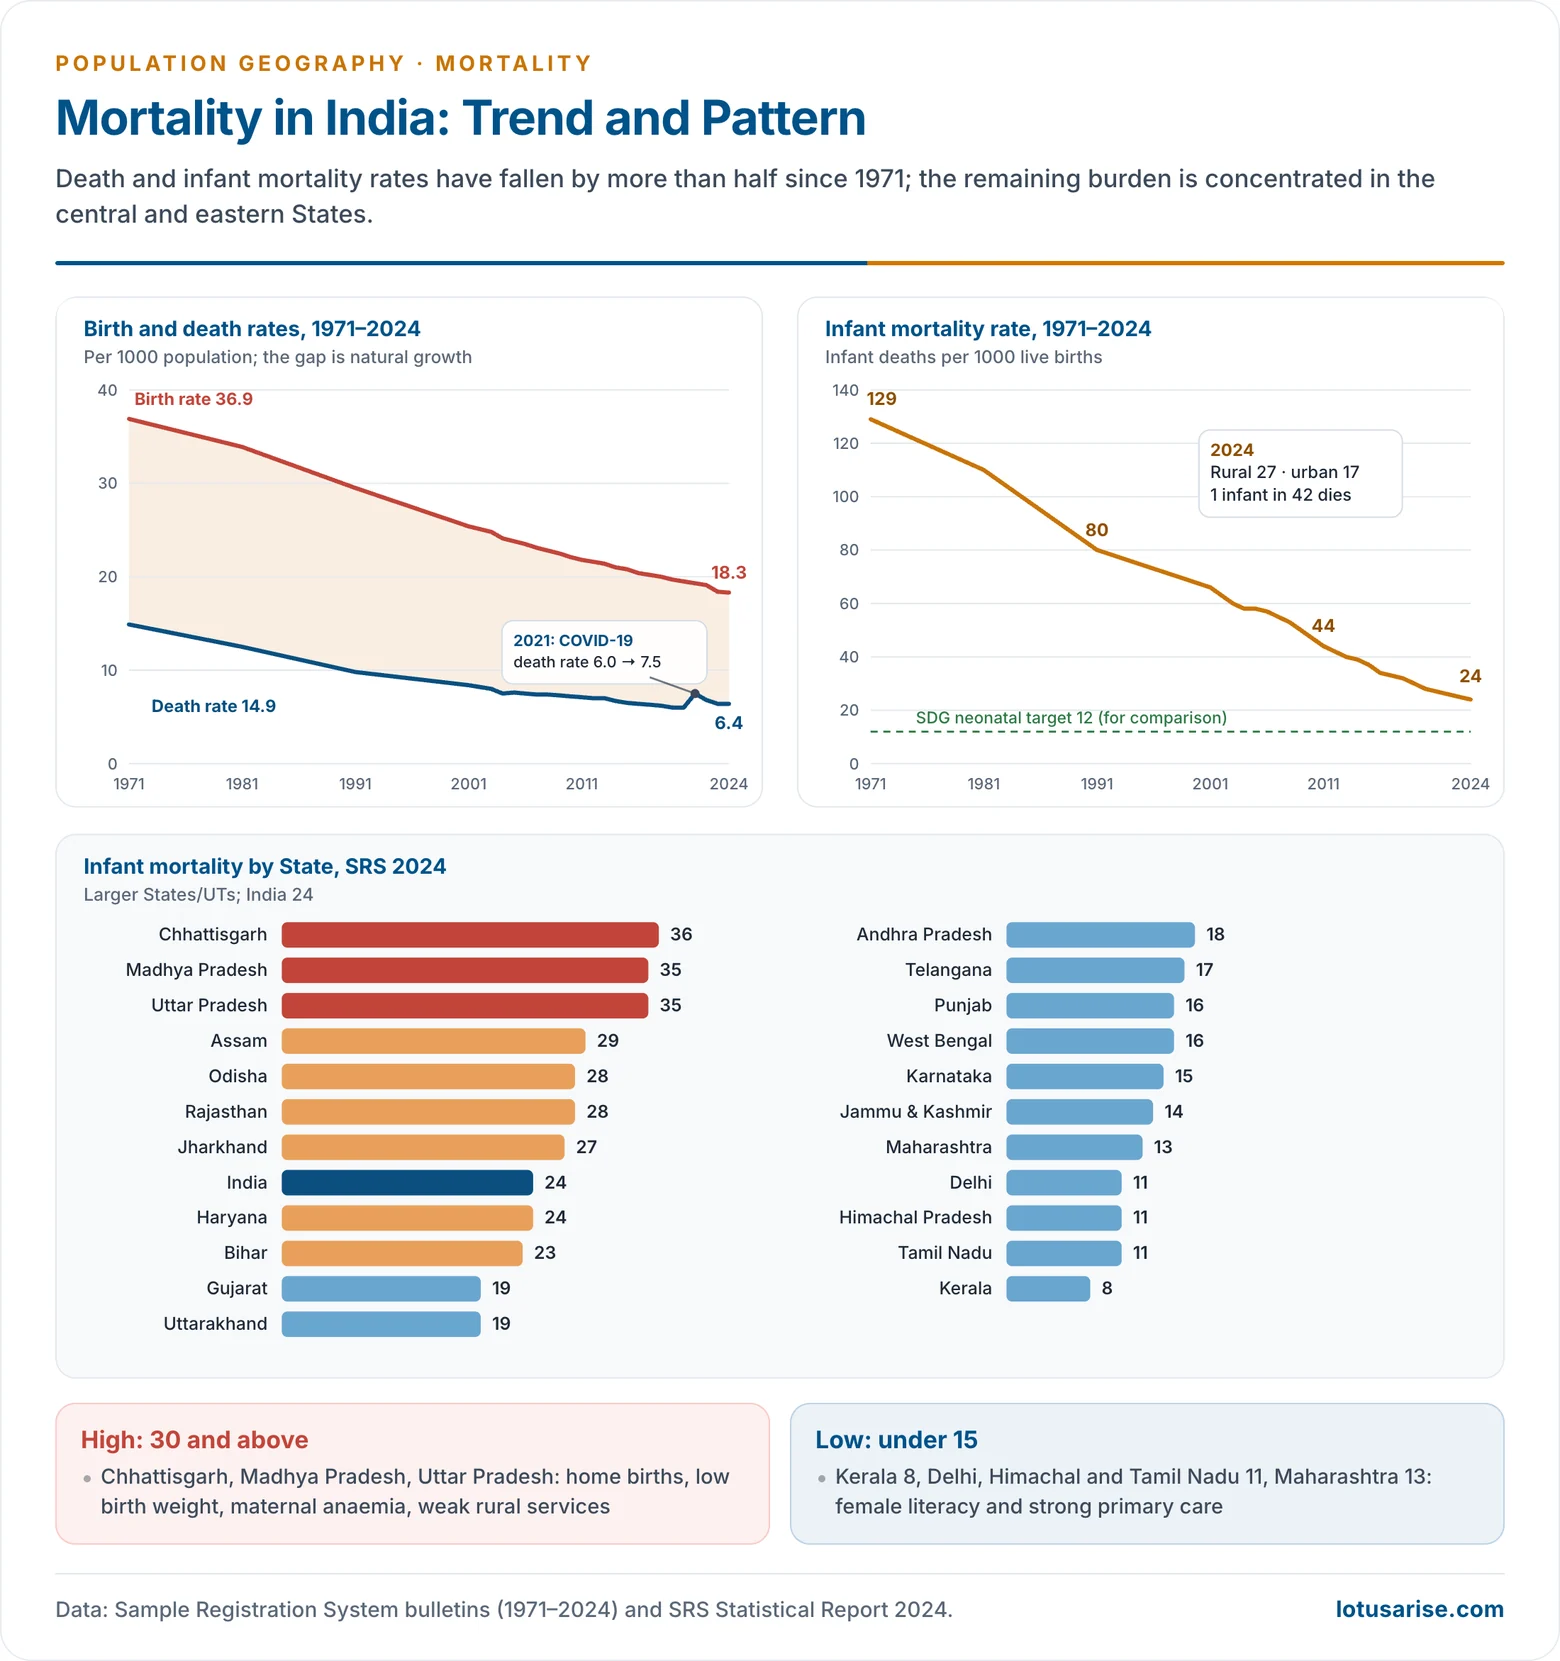
- CDR: 14.9 in 1971 → 12.5 (1981) → 9.8 (1991) → 8.4 (2001) → 7.1 (2011) → 6.4 (2024).
- IMR: 129 in 1971 → 110 (1981) → 80 (1991) → 66 (2001) → 44 (2011) → 24 (2024).
- One in every 42 infants still dies before the first birthday; one in 37 in rural areas.
- NFHS series: IMR 79 in 1992–93 (NFHS-1) to 35 in 2019–21 (NFHS-5).
- COVID-19: the SRS death rate rose from 6.0 in 2020 to 7.5 in 2021, the Delta wave year, before falling back to 6.4. The WHO (2022) estimated about 4.7 million excess deaths in India in 2020–21, an estimate the Government of India disputed.
- Life expectancy rose from 49.7 (1970–75) to 70.6 (2020–24).
Regional Pattern (SRS 2024)
- Highest IMR: Chhattisgarh 36, Madhya Pradesh and Uttar Pradesh 35, Assam 29, Odisha and Rajasthan 28, Jharkhand 27.
- Under-five mortality is highest in Madhya Pradesh and Uttar Pradesh (41).
- Lowest IMR: Kerala 8, Delhi, Himachal Pradesh and Tamil Nadu 11, Maharashtra 13.
- Already at the SDG neonatal target (12 or less): Kerala, Delhi, Himachal Pradesh, Tamil Nadu, Jammu and Kashmir, Maharashtra, Karnataka, Punjab and West Bengal.
- CDR is highest in Chhattisgarh (8.4) and Odisha (7.9), but also high in Kerala (7.3) because of its older population: a reminder that CDR measures age structure as much as health.
- Why infant mortality stays high in the lagging states:
- low birth weight and prematurity, linked to maternal anaemia and early childbearing;
- births still at home or in weak facilities, and poor newborn care;
- diarrhoea and pneumonia from unsafe water, open defecation and indoor smoke;
- low female literacy and limited access to services in tribal and remote areas.
- Programmes that drove the decline:
- Janani Suraksha Yojana (2005), a cash incentive for institutional delivery, and Janani Shishu Suraksha Karyakram (2011), free delivery care;
- the India Newborn Action Plan (2014), special newborn care units and home-based newborn care by ASHAs;
- Mission Indradhanush (2014) for full immunisation, and the Pradhan Mantri Surakshit Matritva Abhiyan (2016) for antenatal check-ups;
- LaQshya (2017) for labour-room quality and POSHAN Abhiyaan (2018) for nutrition.
- Institutional births rose to 90.6% in NFHS-6 (2023–24), from 79% in NFHS-4 (2015–16).
- Differentials:
- Rural–urban: IMR 27 rural, 17 urban (2024).
- Sex: male infant mortality is now only slightly above female, a smaller gap than biology predicts, showing residual neglect of girls.
- Social groups: child mortality is higher among Scheduled Tribes and the poorest wealth quintile (NFHS).
Key Observations
- Mortality has fallen everywhere, but unevenly: the gap between Sub-Saharan Africa and the rest is now the main fault line of world mortality.
- IMR and U5MR move inversely with income, female literacy, health spending and the strength of institutions.
- In India, most of the Empowered Action Group (EAG) states (Madhya Pradesh, Chhattisgarh, Uttar Pradesh, Odisha, Rajasthan, Jharkhand) and Assam still have the infant mortality the south had two decades ago; region-specific health interventions are needed there.
- As infant deaths fall, the policy focus shifts to neonatal care, maternal health in the high-MMR states, and the rising toll of chronic disease among adults. The comparison of these indicators across countries is carried in health indicators and population problems.
Previous Year Questions
2012Write short note on Status of infant mortality rate in the world.2025Analyze the role of demographic transition theory in explaining variations in fertility and mortality rates globally.