

Demography:

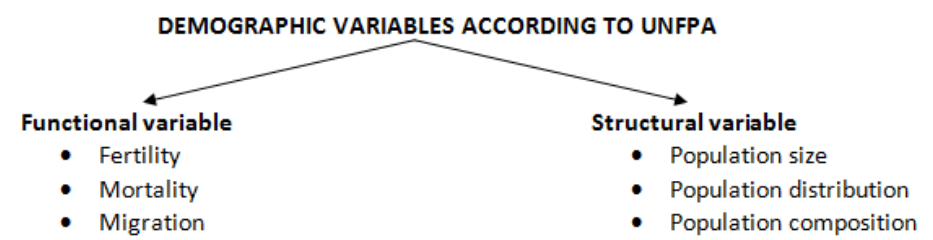
- Demography (from Demos = people and Graphein = to describe) refers to the scientific and statistical study of human population, focusing on its size, structure, distribution, and dynamics over space and time.
- It forms the core of Population Geography, as it helps in understanding how populations change, move, and interact with resources and settlements.
- Demography primarily examines the three fundamental processes of population change:
- Fertility (Birth Rates):
- Determines the rate at which new individuals are added to the population
- Influences population growth and age structure
- Mortality (Death Rates):
- Reflects health conditions, nutrition, and healthcare systems
- Affects life expectancy and population stability
- Migration:
- Represents spatial mobility of population
- Causes redistribution of population across regions
- Fertility (Birth Rates):
- Several statistical indicators are crucial for analysing population characteristics:
- Population Size and Growth:
- Total number of people and rate of increase or decline
- Population Density:
- Number of persons per unit area, indicating pressure on resources
- Age Structure:
- Distribution across age groups (young, working-age, elderly), affecting:
- Dependency ratio
- Workforce availability
- Distribution across age groups (young, working-age, elderly), affecting:
- Sex Ratio:
- Balance between males and females, reflecting:
- Social conditions
- Gender equity
- Balance between males and females, reflecting:
- Fecundity/Fertility:
- Reproductive capacity and actual birth rates
- Mortality Indicators:
- Death rate, infant mortality rate, life expectancy
- Population Size and Growth:
Demographic Attributes
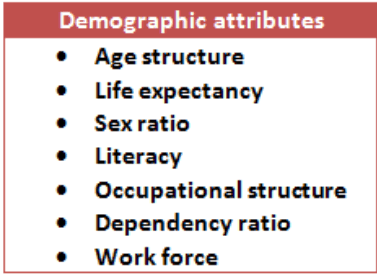
- Demographic attributes refer to the measurable characteristics that define the composition and quality of a population, which are essential for both geographical analysis and policy formulation:
- Age:
- Determines the proportion of:
- Children, working population, and elderly
- Crucial for planning education, employment, and healthcare
- Determines the proportion of:
- Gender (Sex Composition):
- Indicates social status of women and gender balance
- Ethnicity:
- Reflects cultural diversity and social stratification
- Income Levels:
- Shows economic status and inequality within population
- Education Level:
- Determines human capital, awareness, and development potential
- Occupation Structure:
- Indicates economic activities and level of development (primary, secondary, tertiary sectors)
- Household Composition:
- Includes family size, type (joint/nuclear), and dependency structure
- Age:
- There are two types of demographic attributes:
- Formal Demography or Quantitative data such as sex ratio, literacy ratio
- Social Demography; Qualitative or socio, economic, the political aspect of data such women participation in politics, etc.
Significance of Demography
- Demography is crucial for both governments and private institutions, as it provides a basis for planning and forecasting:
- Public Policy and Planning:
- Urban planning, housing, healthcare, education, and infrastructure
- Economic Development:
- Labour force planning, market demand, consumption patterns
- Social Development:
- Gender policies, poverty alleviation, welfare schemes
- Settlement Geography:
- Understanding distribution and growth of rural and urban settlements
- Public Policy and Planning:
- In Population and Settlement Geography, demographic attributes help in:
- Analysing spatial variations in population distribution
- Understanding regional inequalities and development patterns
- Studying urbanisation, migration, and settlement hierarchy
- Demography thus acts as a bridge between population processes and spatial organisation.
Age Structure
- Age structure refers to the distribution of population across different age groups, usually classified as:
- 0–14 years (young/dependent population)
- 15–64 years (working or economically active population)
- 65+ years (aged/dependent population)
- It is a crucial demographic indicator because it helps in predicting future population growth, labour supply, dependency burden, and economic potential of a country.
- Age structure, along with life expectancy, reflects the quality of human resources in a country, as it indicates:
- Availability of working population
- Level of dependency burden
- Stage of demographic transition
- A balanced age structure suggests:
- Efficient utilisation of resources
- Sustainable economic growth
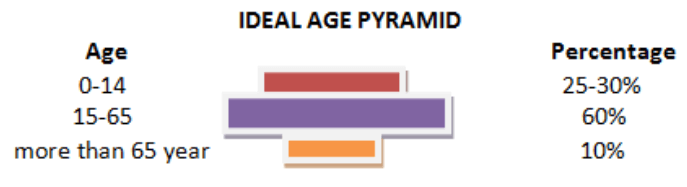
- An ideal population structure is often represented through a population pyramid, where:
- 0–14 age group:
- Should constitute around 25–30% of total population
- Ensures future workforce availability
- 15–64 age group (working population):
- Should comprise about 60% or more
- Indicates strong productive base
- 65+ age group:
- Should remain below 10%
- Reflects lower dependency burden
- 0–14 age group:
- Such a structure is considered demographically efficient, as it ensures:
- High productivity
- Manageable dependency ratio
- Age structure is commonly represented using a population pyramid, which shows:
- Age groups on vertical axis
- Male and female population on either side
- Types of pyramids indicate demographic stage:
- Expansive Pyramid:
- Broad base, high birth rate (developing countries)
- Stationary Pyramid:
- Balanced structure (stable population)
- Constrictive Pyramid:
- Narrow base, ageing population (developed countries)
- Expansive Pyramid:
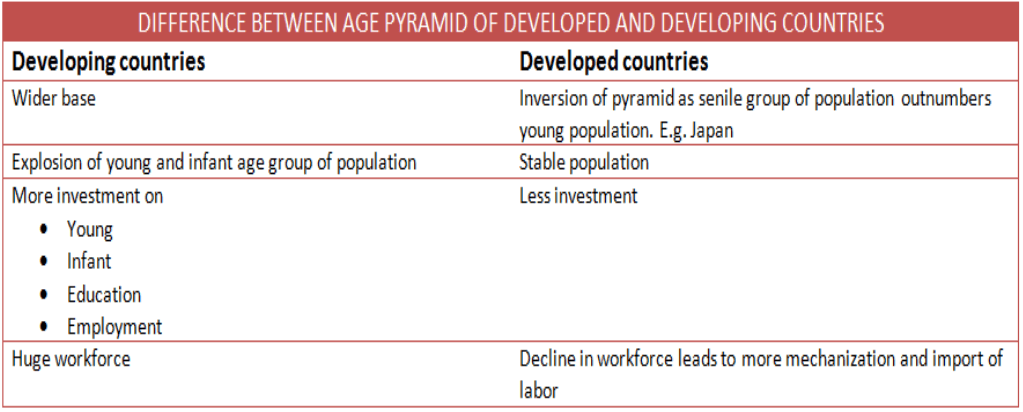
- In reality, most countries today show imbalanced age structures:
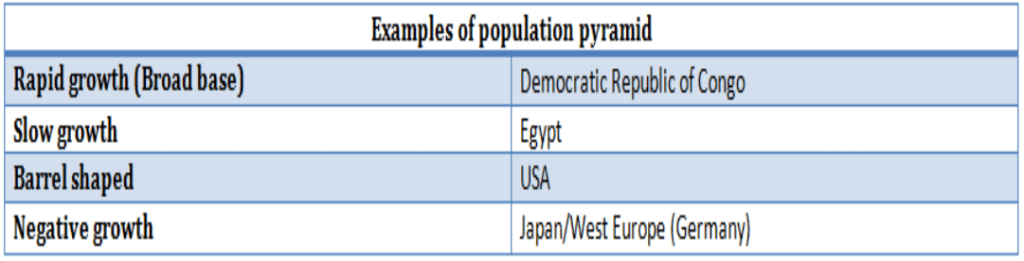
- Developing countries (e.g., India):
- Large proportion of young and adult population
- Result of historically high birth rates
- Developed countries (e.g., Japan, Europe):
- Increasing aged population
- Due to low fertility and high life expectancy
- Developing countries (e.g., India):
Population Pyramid (Age–Sex Pyramid)
- A population pyramid (or age pyramid) is a graphical representation of the age and sex composition of a population, where:
- Age groups are shown on the vertical axis
- Males and females are plotted on opposite sides
- It is considered one of the most effective tools in population geography because it provides a clear visual understanding of demographic structure, growth trends, and future prospects.
- Population pyramids help in:
- Understanding age composition and dependency ratio
- Assessing future population growth trends
- Identifying labour force availability
- Analysing stage of demographic transition
- Planning for education, employment, healthcare, and social security
Types of Population Pyramids (Based on Demographic Transition)
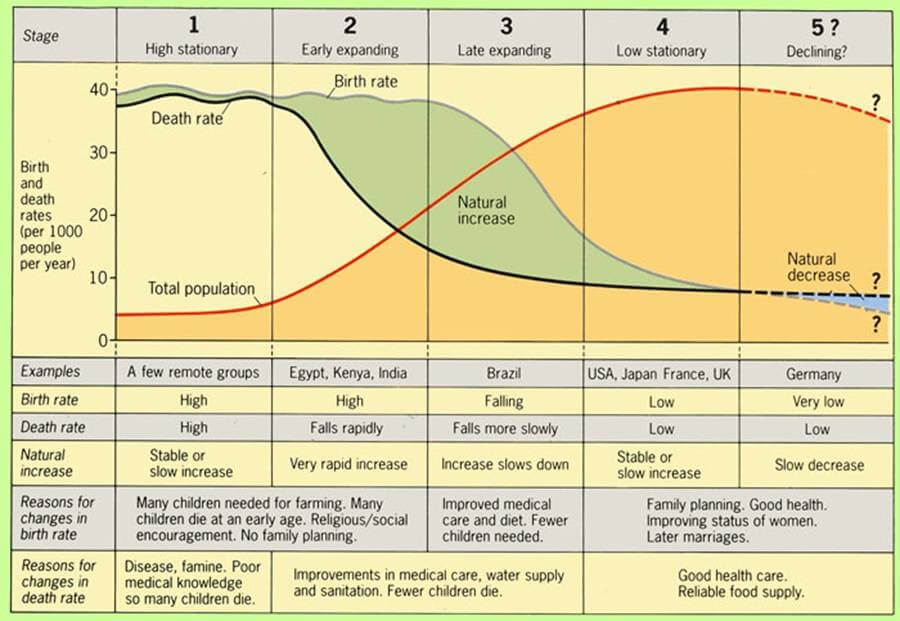
- Population pyramids broadly correspond to the stages of Demographic Transition Theory (DTT), reflecting changes in fertility, mortality, and development.

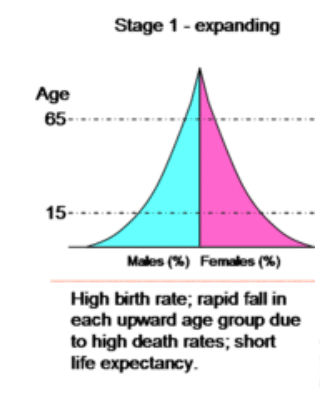
1. Primitive Demographic Profile (Expansive Pyramid)
- This pyramid corresponds to the first stage of demographic transition, characterized by:
- High birth rate and high death rate, resulting in fluctuating population growth
- Frequent occurrence of epidemics, famines, and low life expectancy
- Predominance of agrarian and traditional society
- The pyramid shows:
- A broad base, indicating a large number of children
- A narrow and sharply tapering top, indicating fewer elderly
- This type is typical of:
- Pre-industrial societies
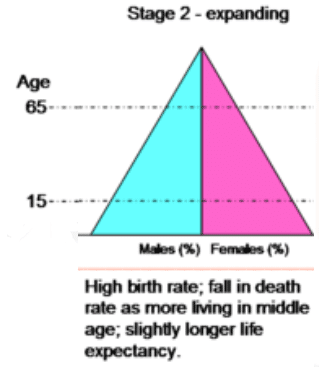
2. Early Expanding Stage (Expansive but Taller Pyramid)
- This corresponds to the second stage of demographic transition, where:
- Death rate declines sharply due to:
- Improved food supply
- Medical advancements
- Birth rate remains high, leading to rapid population growth
- Death rate declines sharply due to:
- The pyramid shows:
- A broad base, similar to stage 1
- Increased height, reflecting improved life expectancy
- Historically observed during:
- Industrial Revolution in Europe
- Note:
- Both primitive and early expanding pyramids are often described as “expansive”, showing rapid population growth.
3. Barred-Shaped Pyramid (Late Expanding Stage)
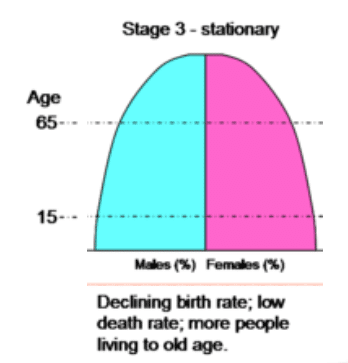
- This corresponds to the third stage of demographic transition, characterized by:
- Declining birth rate due to:
- Education
- Urbanization
- Changing social values
- Low and stable death rate
- Declining birth rate due to:
- The pyramid shows:
- A bulge in the middle (working-age population)
- A narrowing base, indicating declining fertility
- Key implication:
- Presence of youth bulge, which can:
- Become a demographic dividend if employment is available
- Otherwise lead to unemployment and social tensions
- Presence of youth bulge, which can:
- Typical of:
- Developing countries like India (current phase)
4. Inverted Pyramid (Declining/Stable Population Stage)
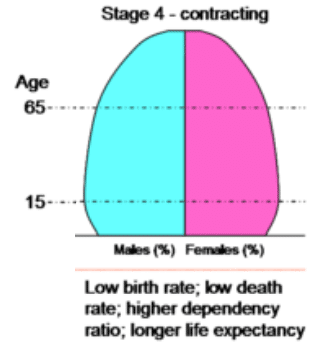
- This corresponds to the fourth stage of demographic transition, where:
- Birth rate declines significantly and equals or falls below death rate
- Population growth becomes stable or declining
- The pyramid shows:
- A narrow base, indicating low fertility
- A wider top, indicating ageing population
- Associated with:
- High levels of urbanization, industrialization, and tertiary sector dominance
- Typical of:
- Developed countries like Japan, Germany, Italy
Significance of Age Pyramid (Population Pyramid)
- Population pyramids are an important analytical tool because they help in identifying the proportion of economically dependent population, i.e., those below 15 years and above 65 years, who depend on the working-age population for their survival and well-being. This provides a clear understanding of the burden on the productive population.
- They are also useful in calculating the dependency ratio, which measures the ratio between dependent population (0–14 and 65+) and the working population (15–64). A higher dependency ratio indicates greater economic pressure on the workforce, while a lower ratio indicates better economic potential and productivity.
- Age pyramids provide valuable insights for human resource planning, as they reveal the size and composition of the available labour force, helping governments and planners estimate:
- Future employment needs
- Skill development requirements
- Sectoral workforce distribution
- They are essential for age-specific analysis of population, which is crucial for:
- Educational planning (based on child population)
- Healthcare planning (based on infant and elderly population)
- Pension and social security policies (based on ageing population)
- Population pyramids are also important for scientific, technical, and commercial planning, as they help in:
- Forecasting market demand (youth vs ageing population)
- Planning infrastructure such as schools, hospitals, housing
- Designing targeted welfare and development programmes
- Thus, the age pyramid forms a core component of population analysis, as it connects demographic structure with economic planning, social development, and policy formulation.

Life Expectancy / Longevity
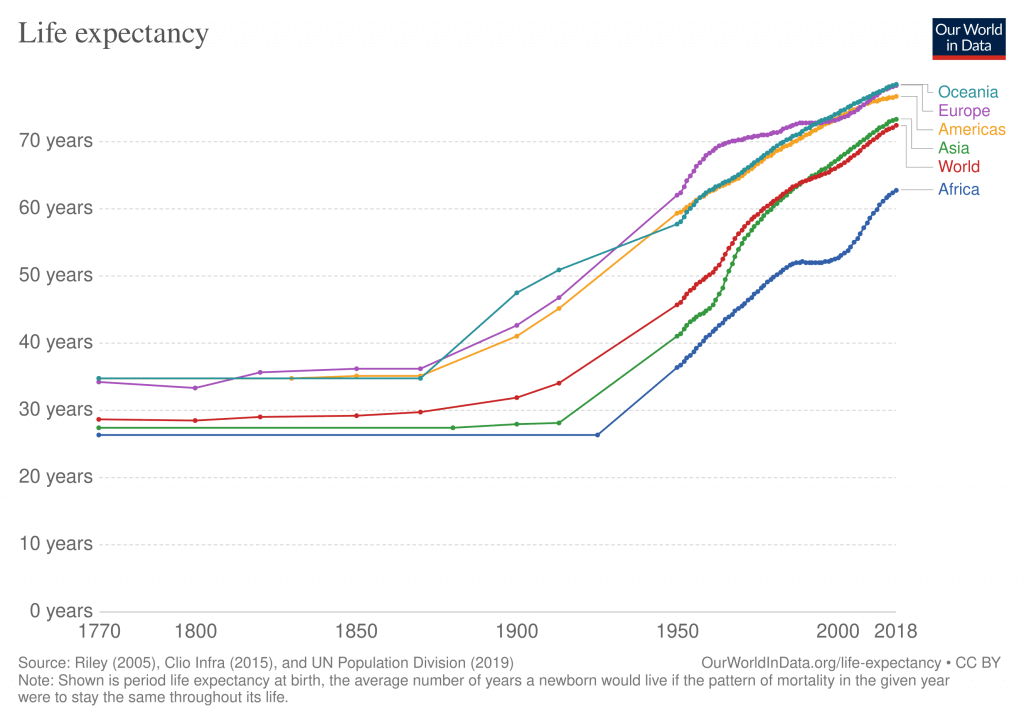
- Life expectancy (longevity) refers to the average number of years a person is expected to live, usually calculated through life tables, either:
- At birth (Life Expectancy at Birth), or
- At a specific age group
- It is a key indicator of:
- Quality of life
- Level of socio-economic development
- Effectiveness of healthcare systems
Determinants of Life Expectancy
- Life expectancy is influenced by a combination of biological, socio-economic, political, and environmental factors, which operate together:
- Gender Differences
- Biologically, females tend to live longer than males due to:
- Genetic advantages
- Hormonal protection
- However, in many developing societies, this advantage is reduced because of:
- Early marriage
- High maternal mortality rate (MMR)
- Female infanticide and neglect
- Malnutrition and limited healthcare access
- Biologically, females tend to live longer than males due to:
- Access to Healthcare
- Availability of modern medical facilities, vaccination, and institutional care significantly increases life expectancy.
- Inequality in access leads to:
- Higher life expectancy among rich and urban populations
- Lower life expectancy among poor and rural populations
- Nutrition, Hygiene and Lifestyle
- Healthy lifestyle practices contribute positively to longevity, including:
- Balanced diet and proper nutrition
- Regular exercise
- Good sanitation and hygiene
- Conversely, unhealthy habits reduce life expectancy:
- Smoking and tobacco use
- Alcohol abuse
- Sedentary lifestyle
- Poor food safety
- Healthy lifestyle practices contribute positively to longevity, including:
- Socio-Economic Conditions
- Higher income and education levels lead to:
- Better living standards
- Improved healthcare access
- Increased awareness
- Thus, developed regions generally have higher life expectancy than developing regions
- Higher income and education levels lead to:
- Crime and Social Environment
- High crime rates and unsafe environments:
- Increase mortality risks
- Reduce average life span
- High crime rates and unsafe environments:
- Political Stability and Conflict
- Regions affected by:
- War
- Civil conflict
- Political instability
- tend to have lower life expectancy due to:
- Violence
- Breakdown of healthcare systems
- Displacement
- Example: Conflict-affected regions like Syria
- Regions affected by:
- Genetic Factors
- Genetics influence susceptibility to major diseases such as:
- Heart disease
- Cancer
- Diabetes
- Stroke
- Thus, hereditary factors also play a role in determining longevity
- Genetics influence susceptibility to major diseases such as:
Effect of Life Expectancy on Population Pyramid
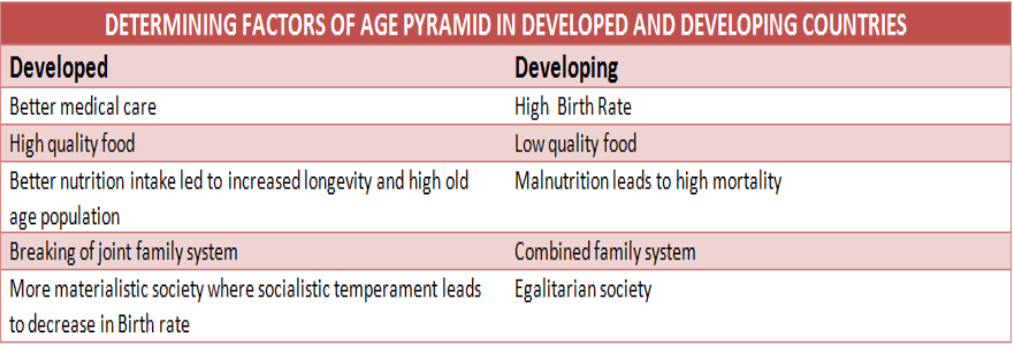
- Life expectancy directly influences the shape and height of the population pyramid:
- Low life expectancy:
- Pyramid has a low height and narrow top
- Indicates fewer elderly people
- High life expectancy:
- Pyramid becomes taller with a broader top
- Indicates ageing population
- Low life expectancy:
- Thus, life expectancy is a key factor in determining:
- Age structure
- Dependency ratio
Global Patterns
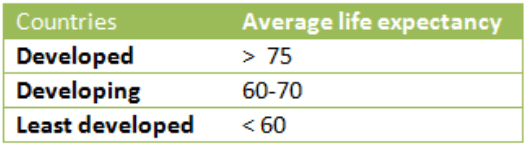
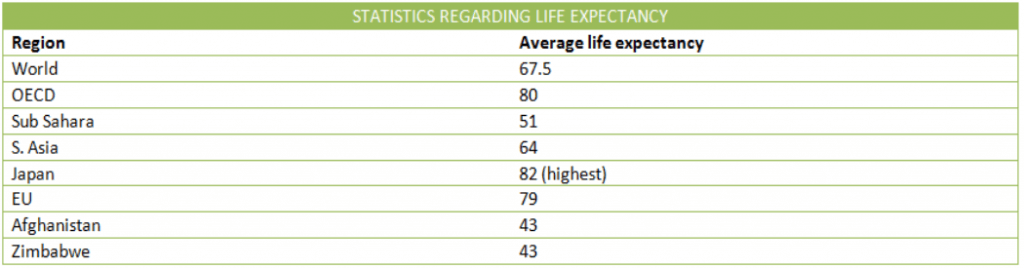
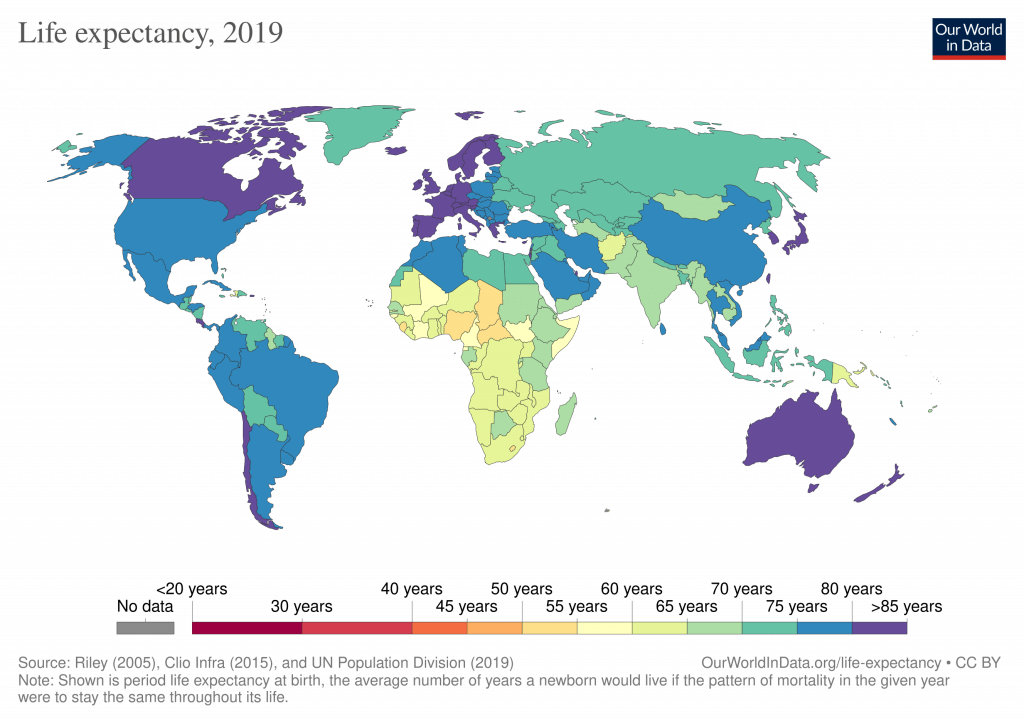
- Countries with high life expectancy (80+ years) include:
- Norway, Sweden, Switzerland, France, Spain, Italy
- Japan, Singapore, Hong Kong, Australia, New Zealand
- These countries share common features:
- Advanced healthcare systems
- High standard of living
- Strong social security systems
Geographical Significance
- Life expectancy helps in:
- Assessing level of development and human well-being
- Understanding regional inequalities
- Planning for:
- Healthcare infrastructure
- Pension systems
- Ageing population policies
Literacy Rate
- Literacy rate refers to the proportion of population that is able to read, write, and understand in any language, and it is one of the most important indicators of socio-economic development and standard of living.
- It has a two-way relationship with development, as:
- Higher literacy leads to:
- Better employment opportunities
- Improved health awareness
- Lower fertility rates
- At the same time, economic development improves:
- Access to education
- Educational infrastructure
- Higher literacy leads to:
- Literacy enhances:
- Participation in economic activities
- Cultural awareness and social progress
- Educated parents, especially mothers, are more:
- Conscious about child health, nutrition, and education
- Likely to adopt family planning measures
- Female literacy is particularly significant because:
- It directly influences:
- Fertility rates
- Infant mortality
- Overall human development
- India has witnessed a rapid rise in female literacy, which is a positive demographic trend
- It directly influences:
Crude Birth Rate (CBR)
- Crude Birth Rate refers to the number of live births per 1000 population in a year.
- It is an important indicator of:
- Population growth
- Fertility behaviour of society
- High CBR is usually associated with:
- Developing countries
- Low literacy and limited access to healthcare
Crude Death Rate (CDR)
- Crude Death Rate refers to the number of deaths per 1000 population in a year.
- It reflects:
- Health conditions
- Medical facilities
- Nutrition and living standards
- Declining CDR indicates:
- Improvement in healthcare and sanitation
Total Fertility Rate (TFR)
- Total Fertility Rate refers to the average number of children a woman is expected to have during her reproductive life span.
- A TFR of 2.1 is considered the replacement level, meaning:
- Population replaces itself without growth or decline
- High TFR leads to:
- Rapid population growth
- Declining TFR is associated with:
- Higher literacy (especially female literacy)
- Urbanization
- Better access to contraception
Sex Ratio
- Sex Ratio is defined as the number of females per 1000 males in a population.
- It is a sensitive indicator of:
- Gender equality and social conditions
- An unfavourable sex ratio reflects:
- Gender discrimination, such as:
- Female foeticide
- Female infanticide
- Domestic violence
- Neglect of female health and education
- Gender discrimination, such as:
- A balanced or favourable sex ratio indicates:
- Better status of women
- More equitable social development
Fecundity
- Fecundity refers to the biological capacity of an individual or a population to produce offspring, and it highlights the potential for reproduction rather than actual reproductive performance.
- In demographic analysis, fecundity is important because:
- Not all individuals contribute equally to population growth
- Certain age groups, particularly women in reproductive age (15–49 years), have a greater influence on population increase
- Fecundity is generally measured through:
- Age-Specific Birth Rates (ASBR)
- Number of births per woman in a given time period
- Number of births per 1000 population over a period
- It is influenced by:
- Biological factors: age, health, nutrition
- Social factors: age at marriage, cultural norms
- Economic factors: standard of living, education
- It is important to distinguish:
- Fecundity (potential ability to reproduce)
- Fertility (actual number of children born)
- Thus, fecundity provides a theoretical upper limit of reproduction, while fertility reflects real demographic behaviour.
Morbidity
- Morbidity refers to the state of being diseased or unhealthy within a population, and it measures the frequency or incidence of illness in a given geographical area over a specific period of time.
- The morbidity rate indicates:
- The proportion of people suffering from a particular disease
- The overall health burden of a population
- Morbidity includes a wide range of health conditions:
- Acute diseases: sudden onset, short duration (e.g., heart attack, infections)
- Chronic diseases: long-term conditions (e.g., cancer, diabetes, respiratory disorders)
- Injuries and disabilities
- High morbidity levels indicate:
- Poor health conditions
- Inadequate healthcare facilities
- Lower productivity of the population
- Morbidity is influenced by:
- Nutrition and sanitation
- Access to healthcare
- Environmental conditions
- Lifestyle factors (smoking, diet, physical activity)

Net Reproductive Rate (NRR)
- Net Reproductive Rate (NRR) is a refined demographic indicator that measures the average number of daughters that would be born to a woman (or cohort of women) during her lifetime, after accounting for female mortality rates. In simple terms, it reflects the extent to which a generation of women is replacing itself in the next generation, making it a more precise indicator than crude birth rate or even total fertility rate.
- Unlike Total Fertility Rate (TFR), which measures the average number of children born per woman, NRR specifically focuses on:
- Female births only (since they contribute to future reproduction)
- Survival of females through reproductive ages
- Thus, NRR integrates both:
- Fertility (births)
- Mortality (survival chances of females)
- It answers a crucial question in population geography:
- “Is the current generation of women adequately replacing itself?”
- Interpretation of NRR Values
- NRR = 1
- Each generation of women is exactly replacing itself
- Indicates population stability (zero population growth) in the long run
- NRR > 1
- More daughters are being produced than needed for replacement
- Indicates population growth
- NRR < 1
- Fewer daughters are being produced
- Indicates population decline
- NRR = 1
- Relationship with Replacement Level Fertility
- Replacement level fertility (TFR ≈ 2.1) corresponds to:
- NRR ≈ 1 in most populations
- However, NRR is more accurate because:
- It accounts for female mortality rates, which vary across regions
- Replacement level fertility (TFR ≈ 2.1) corresponds to:
Determinants of NRR
- NRR is influenced by a combination of demographic and socio-economic factors:
- Fertility levels (TFR):
- Higher fertility increases NRR
- Female mortality rates:
- Higher mortality reduces NRR as fewer women survive to reproductive age
- Sex ratio at birth:
- Skewed sex ratios affect the number of daughters born
- Healthcare and nutrition:
- Better health increases survival rates and thus NRR
- Education and status of women:
- Higher female literacy generally lowers fertility but improves survival
- Fertility levels (TFR):





sir a great thanks to you
THANKS
Your notes are great!!!
Thanks a lot.
Thanks Sir
Very good and content rich materials. Thank you for your tremendous help.
Thank you!
Thanks 🙏🙏🙏
Alot sir
Thanks sir ,nice content for optional
Thanks a lot sir