

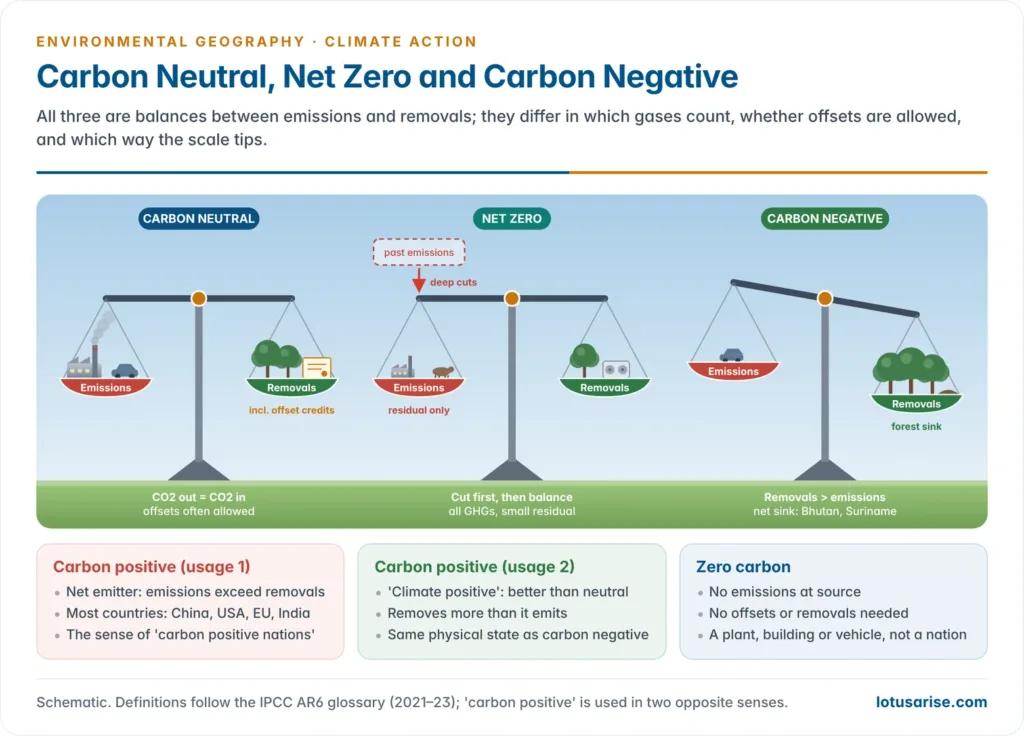
- Carbon neutrality is the state in which the carbon dioxide a country, city, company or product releases is balanced by the carbon dioxide it removes from the atmosphere, so its net addition is zero.
- The broader goal of net zero applies the same balance to all greenhouse gases, and, at the scale of the whole planet, it is the only way to stop global warming from rising further.
- The idea entered the climate regime through Article 4.1 of the Paris Agreement (2015), which asks the world to reach a “balance between anthropogenic emissions by sources and removals by sinks” in the second half of this century, on the basis of equity.
- It sits at the meeting point of physical and human geography: sources and sinks are spatial (coal belts, forests, oceans, peatlands), while responsibility and capacity differ sharply between the industrialised North and the developing South.
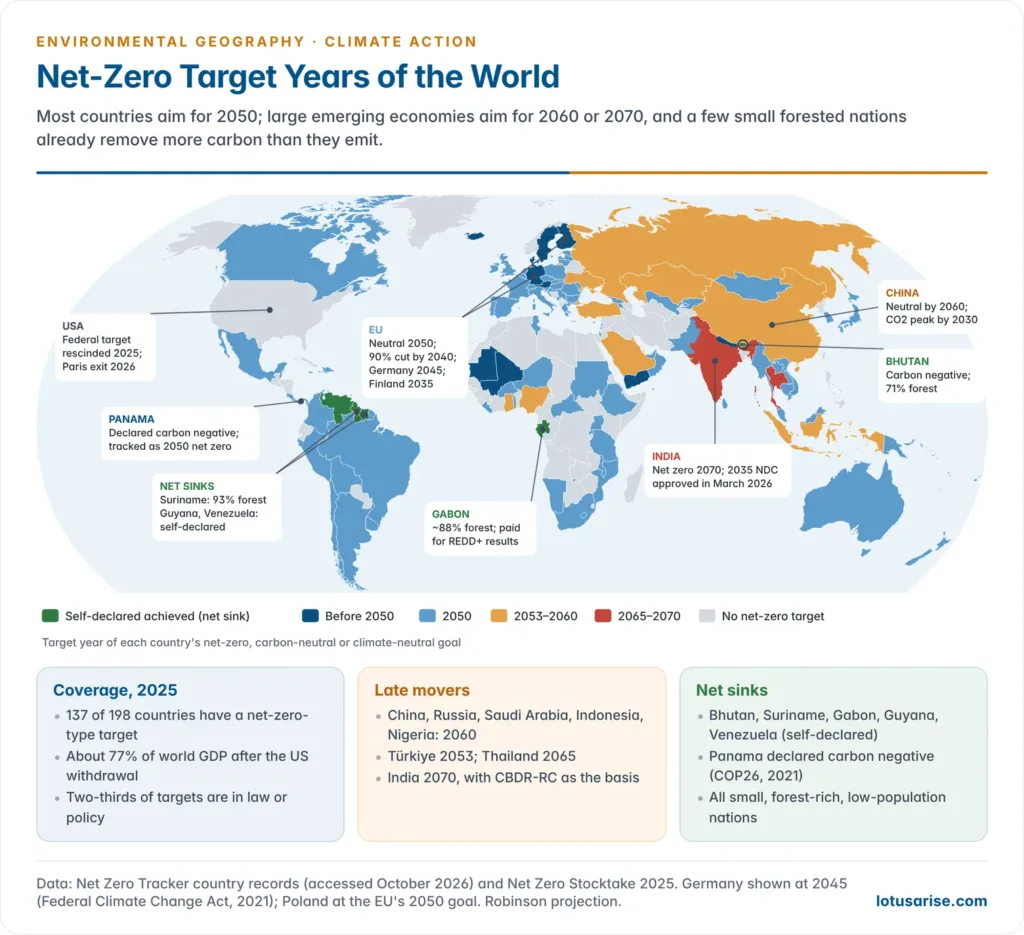
- Today 137 of 198 countries have a net-zero or similar target, a handful of small forested nations already absorb more than they emit, and India has committed to net zero by 2070.
Concepts and the Science of Net Zero

Carbon neutral, net zero and related terms
- The Intergovernmental Panel on Climate Change (IPCC), in its Sixth Assessment Report (AR6, 2021–23), gives the standard definitions:
- Carbon neutrality: anthropogenic CO2 emissions associated with a subject (a country, organisation, product or event) are balanced by anthropogenic CO2 removals.
- Net zero CO2 emissions: the same balance reached at the global scale over a specified period.
- Net zero GHG emissions: emissions of all greenhouse gases, weighted by a metric such as the 100-year Global Warming Potential (GWP-100), are balanced by removals.
- Climate neutrality: a state in which human activities have no net effect on the climate system, counting non-CO2 gases, aerosols and changes in surface albedo, not only carbon.
- The terms are not interchangeable:
- Carbon neutrality may be claimed by an organisation after buying offsets.
- A credible net-zero target demands deep cuts first, with removals only for the hard-to-abate residue.
| Term | Gases covered | What is balanced | Typical use |
|---|---|---|---|
| Carbon neutral | CO2 only | Emissions = removals, often including purchased offsets | Products, events, firms (ISO 14068-1:2023) |
| Net zero CO2 | CO2 | Global anthropogenic emissions = removals | IPCC pathways, temperature stabilisation |
| Net zero GHG | All Kyoto gases (CO2e) | Weighted emissions = removals | Most national targets (UK, EU, India) |
| Climate neutral | All climate forcers | No net warming effect | EU Climate Law, aviation debates |
| Carbon negative | CO2 or CO2e | Removals exceed emissions | Bhutan, Suriname, Panama |
| Zero carbon / absolute zero | CO2 | No emissions at source, no offsets | Power plants, buildings, vehicles |
- Scopes of accounting (from the corporate GHG Protocol) decide what is counted:
- Scope 1: direct emissions from owned sources;
- Scope 2: emissions from purchased electricity and heat;
- Scope 3: all other value-chain emissions, often the largest share.
- National accounts are territorial: a country counts emissions within its borders, not the emissions embodied in its imports or in the fossil fuels it exports. This is why an oil exporter can still claim a net sink.
“Carbon positive”: two opposite meanings
- The phrase is used in two contradictory ways, so any answer must define it first:
- Carbon positive = net emitter. Here “positive” means a positive net balance of emissions: the country adds more carbon to the air than it removes. China, the USA, the EU and India all fall in this group, which is the sense of the contrast “carbon positive and carbon negative nations”.
- Carbon positive = climate positive. In corporate and building usage, “carbon positive” (also “climate positive”) means doing better than neutral: removing more CO2 than one emits, which is the same as carbon negative.
- The physical content is unambiguous even when the label is not: what matters is the sign of net emissions (sources minus sinks).
The carbon budget
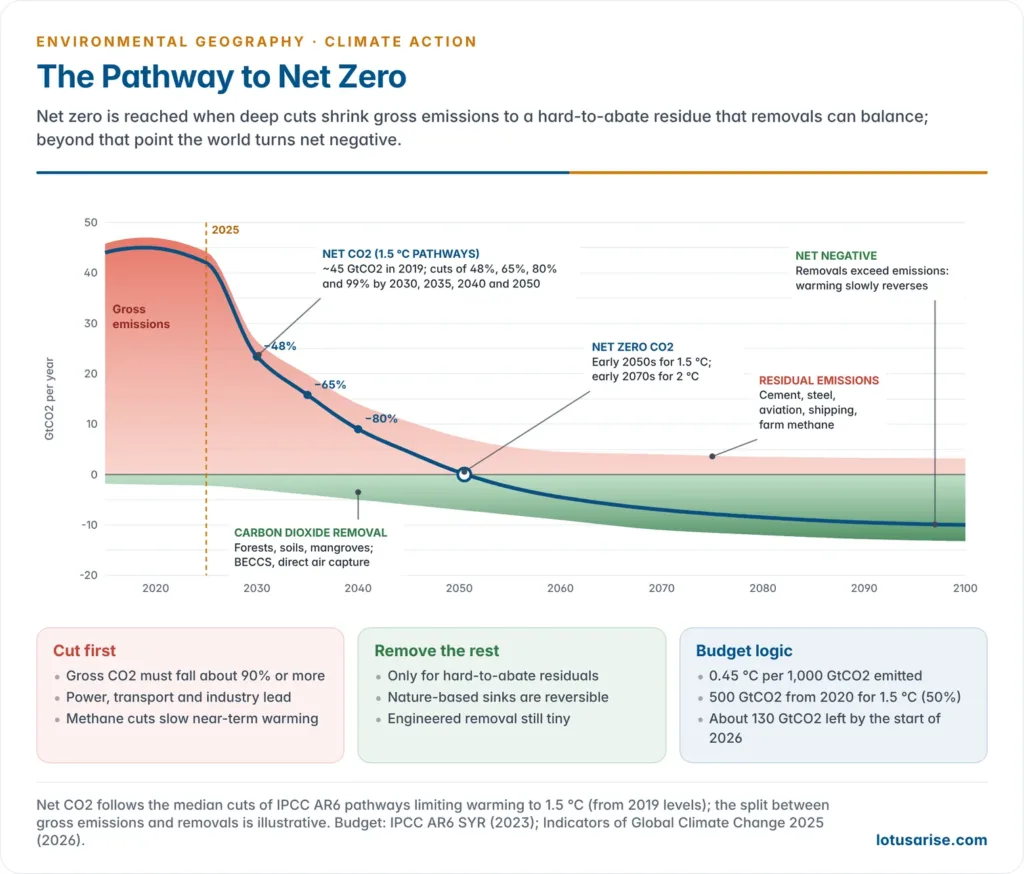
- Global warming rises almost in a straight line with cumulative CO2 emissions. AR6 assesses the transient climate response to cumulative emissions (TCRE) at about 0.45 °C per 1,000 GtCO2 (likely range 0.27–0.63 °C).
- Because CO2 accumulates, warming stops only when net CO2 emissions reach zero. Every tonne emitted before then adds to the total, so the remaining carbon budget is finite.
- Historical emissions: humans released about 2,400 ± 240 GtCO2 between 1850 and 2019, and about 42% of it came after 1990.
- Remaining budget (IPCC AR6 Synthesis Report, 2023), from the beginning of 2020:
- 500 GtCO2 for a 50% chance of limiting warming to 1.5 °C;
- 1,150 GtCO2 for a 67% chance of staying below 2 °C.
- Annual updates by Piers M. Forster and colleagues (the Indicators of Global Climate Change series) show how fast it is shrinking:
- Start of 2025: only about 130 GtCO2 left for a 50% chance of 1.5 °C; human-induced warming had reached 1.36 °C in 2024 and was rising at about 0.27 °C per decade.
- Start of 2026: the 2026 update again put the remainder at about 130 GtCO2, roughly three years of current CO2 emissions, with human-induced warming at 1.37 °C in 2025.
- The 1.5 °C budget is therefore practically exhausted; the 2 °C budget, and the timing of net zero, now decide how much warming the world locks in.
When must the world reach net zero?
- AR6 modelled pathways give the timing:
- 1.5 °C (over 50%) with no or limited overshoot: net zero CO2 in the early 2050s, and net zero GHG in the early 2070s.
- 2 °C (over 67%): net zero CO2 in the early 2070s.
- Methane and nitrous oxide from rice, livestock and fertiliser cannot fall to zero, so net zero GHG comes later than net zero CO2. Both require steep near-term cuts:
| Cut from 2019 levels (1.5 °C pathways) | 2030 | 2035 | 2040 | 2050 |
|---|---|---|---|---|
| All greenhouse gases | 43% | 60% | 69% | 84% |
| CO2 | 48% | 65% | 80% | 99% |
- Residual emissions are the emissions still left at net zero: process CO2 from cement and steel, aviation and shipping, and agricultural methane and nitrous oxide. These must be counterbalanced by removals.
- Net negative emissions after net zero would slowly reverse warming, and this is the only route back if 1.5 °C is overshot.
Carbon sinks and carbon dioxide removal
- A sink is any reservoir that takes up more carbon than it releases. Natural sinks absorb roughly half of the CO2 humans emit each year:
- Land (forests, soils, grasslands) takes up a little under a third.
- Ocean takes up about a quarter, through dissolution and the biological pump. This is the uptake that drives ocean acidification.
- Sinks are under strain:
- Drought, fire and deforestation weaken them; parts of the south-eastern Amazon have turned into a net source.
- Warmer oceans absorb less CO2.
- A net-zero plan that leans on natural sinks is therefore fragile, because the same warming it seeks to stop erodes the sinks.
- Carbon dioxide removal (CDR) means deliberate human activity that takes CO2 out of the air and stores it. It does not include the natural, unmanaged uptake of the ocean.
| Type | Methods | Storage permanence | Issues |
|---|---|---|---|
| Nature-based (conventional) | Afforestation and reforestation, agroforestry, soil carbon, peatland and wetland restoration | Decades to centuries; reversible by fire, pests, land-use change | Land competition, monitoring, leakage |
| Blue carbon | Mangroves, salt marshes, seagrass | High per hectare; vulnerable to clearing | Small area, coastal pressure |
| Hybrid | Biochar; bioenergy with carbon capture and storage (BECCS) | Centuries or more | Land, water and food trade-offs |
| Engineered (novel) | Direct air capture with storage (DACCS), enhanced rock weathering, ocean alkalinity enhancement | Millennia, if stored geologically | Very high cost and energy demand |
- Scale: humans now remove about 2 GtCO2 a year, almost all through forests. Novel methods such as DACCS remove less than one-thousandth of that.
- The Orca (2021) and Mammoth (2024) direct air capture plants in Iceland store CO2 as rock in basalt.
- Carbon capture and storage (CCS) on a power plant or cement kiln is not removal: it only reduces fresh emissions, and is often confused with CDR.
Levers of the transition to net zero
- Energy (power, industry, transport and buildings) produces about three-quarters of global GHG emissions, so the energy transition is the core of every net-zero plan. It has three pillars:
- Decarbonised electricity from renewables, hydro and nuclear, backed by storage and grids;
- Electrification of transport, heating and industrial heat;
- Efficiency and lower demand.
- Costs have collapsed: between 2010 and 2019 the unit costs of solar power fell by about 85%, of wind power by about 55% and of lithium-ion batteries by about 85% (AR6, Working Group III).
- COP28, Dubai (2023) agreed to triple renewable capacity and double the rate of energy-efficiency gains by 2030, and to transition away from fossil fuels in energy systems.
| Sector | Main levers | Examples |
|---|---|---|
| Power | Renewables, storage, grids, nuclear; coal phase-down | Solar and wind are now the cheapest new power in most countries |
| Industry | Efficiency, electrification, green hydrogen, carbon capture for cement | Hydrogen-based “green steel”; clinker substitution in cement |
| Transport | Electric vehicles, rail and public transport, biofuels, sustainable aviation fuel | Rail freight corridors; electric buses |
| Buildings and cities | Efficient design, heat pumps, cool roofs, compact urban form | Energy codes; district cooling |
| Agriculture and land | Halting deforestation, restoration, low-methane rice and livestock, soil carbon | Alternate wetting and drying of paddy |
| Demand and lifestyles | Diets, mobility choices, longer-lived products | India’s LiFE mission |
- Demand-side measures alone could cut end-use emissions by 40–70% by 2050 (AR6, Working Group III), without lowering well-being.
- Methane is the fastest lever for slowing near-term warming. The Global Methane Pledge (COP26, 2021) aims at a 30% cut by 2030 from 2020 levels; India has not joined it, citing rice and livestock livelihoods.
Why Carbon Neutrality Is Essential for Environmental Conservation
- It is the precondition for stopping warming. Conservation that ignores climate fails because every ecosystem’s climate envelope keeps moving while emissions continue.
- Species are already shifting poleward and upslope, and protected areas cannot move with them.
- Ecosystem thresholds are close:
- Warm-water coral reefs are projected to decline by 70–90% at 1.5 °C and by more than 99% at 2 °C (IPCC Special Report on 1.5 °C, 2018).
- The share of species at very high risk of extinction rises from up to 14% at 1.5 °C to up to 18% at 2 °C and 29% at 3 °C (AR6, Working Group II).
- The Himalayan cryosphere, the Arctic and mountain ecosystems lose ice, permafrost and specialist species fastest.
- It protects the sinks themselves. Forests, peatlands and oceans are both conservation targets and carbon stores. Unchecked warming can push the Amazon and boreal forests past tipping points, releasing their carbon and amplifying warming.
- Biodiversity and climate goals are now one agenda:
- Target 8 of the Kunming-Montreal Global Biodiversity Framework (2022) asks countries to minimise climate impacts on biodiversity through mitigation and nature-based solutions.
- REDD+ results-based payments turn standing forests into an income, which is how Gabon and Guyana fund conservation.
- Co-benefits reach beyond climate:
- Phasing out coal and oil cuts air pollution (PM2.5, sulphur dioxide, ozone) and its health burden.
- Lower demand for land, minerals and water from cleaner, more efficient systems reduces pressure on habitats.
- Intergenerational equity: today’s emissions commit future generations to centuries of sea-level rise. Net zero is the only stable end state for a sustainable relationship between society and the atmosphere.
- The caveat: neutrality pursued carelessly can harm conservation.
- Monoculture plantations on grasslands, BECCS that competes with food, and offset projects that dispossess forest communities are all net-zero “solutions” with ecological costs.
Carbon Markets and Offsets
Pricing carbon: taxes and trading
- Net zero needs emissions to carry a price. The two classic market-based instruments of environmental policy are:
- Carbon tax: a fixed price per tonne, with the quantity left to the market. Sweden’s carbon tax (1991) is among the highest.
- Emissions trading: a fixed quantity, with the price left to the market. It takes two forms:
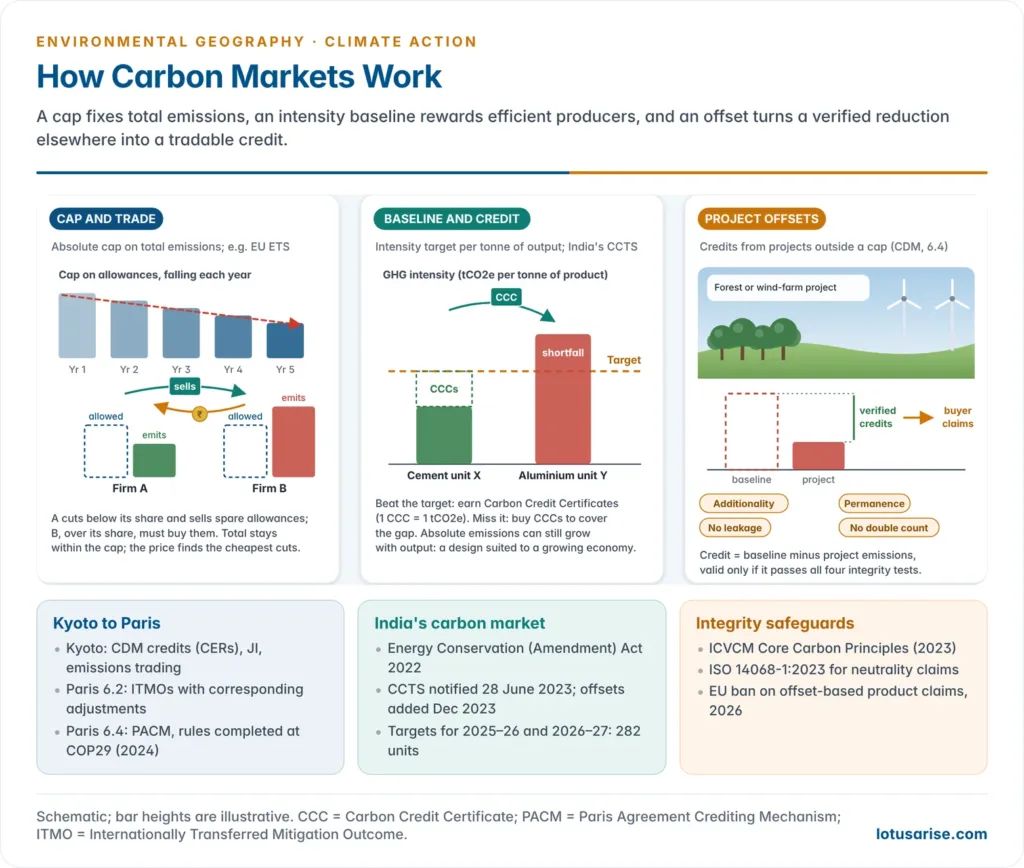
- Cap and trade: a declining absolute cap on total emissions; allowances are auctioned or allocated and traded. The EU Emissions Trading System (EU ETS, 2005) is the model.
- Baseline and credit: each unit gets an intensity benchmark; units that beat it earn credits, and laggards must buy them. India’s Carbon Credit Trading Scheme follows this design.
- Offsetting: a project outside the regulated system (a wind farm, cookstoves, forest protection) earns credits for verified reductions or removals, which a buyer uses to compensate for its own emissions.
- Carbon pricing instruments now cover about a quarter of global emissions, mostly through emissions trading systems in the EU, China, the UK, Korea and California.
From Kyoto’s CDM to Paris Article 6
- Kyoto Protocol (1997; in force 2005) created three flexibility mechanisms for developed (Annex I) countries:
- Clean Development Mechanism (CDM): projects in developing countries earned Certified Emission Reductions (CERs). India was second only to China in registered CDM projects, mostly in renewables and industrial efficiency.
- Joint Implementation (JI): projects between developed countries.
- International Emissions Trading: trading of national allowances.
- Weaknesses: doubtful additionality, a glut of cheap credits, a price collapse after 2012, and no obligations on major developing emitters.
- Paris Agreement, Article 6 rebuilt markets for a world where every country has a target (NDC):
- Article 6.2: cooperative approaches. Countries trade Internationally Transferred Mitigation Outcomes (ITMOs) bilaterally, with corresponding adjustments so that a tonne is never counted by both buyer and seller. Switzerland’s purchases from Ghana and Thailand were among the first.
- Article 6.4: the Paris Agreement Crediting Mechanism (PACM), a UN-supervised successor to the CDM.
- Its credits are A6.4 Emission Reductions.
- 5% of the proceeds go to the Adaptation Fund, and at least 2% of credits are cancelled for overall mitigation in global emissions.
- Article 6.8: non-market approaches such as technology and capacity cooperation.
- COP29, Baku (November 2024) adopted the standards on methodologies and on removals for Article 6.4 on its opening day, and closed with the remaining Article 6 rules. This completed the Paris rulebook after nine years of negotiation.
- By COP30 in Belém (November 2025) the mechanisms had moved from rule-making to implementation: CDM activities transitioning to the PACM, new methodologies, and bilateral 6.2 deals.
The voluntary market and the integrity problem
- Voluntary carbon markets let companies and individuals buy offsets outside any legal obligation. They are certified by private standards such as Verra (VCS) and the Gold Standard.
- Every credit must pass four tests:
- Additionality: the reduction would not have happened anyway.
- Permanence: the stored carbon stays stored; forests can burn.
- No leakage: protecting one forest must not push logging elsewhere.
- No double counting: one tonne is claimed once.
- Failures exposed:
- A 2023 investigation of Verra-certified rainforest (REDD+) credits concluded that most did not represent real reductions, because inflated deforestation baselines had overstated the threat to the forests.
- Many corporate “carbon neutral” labels rested on such credits.
- Responses:
- The Integrity Council for the Voluntary Carbon Market set Core Carbon Principles (2023).
- ISO 14068-1:2023 standardised carbon-neutrality claims, requiring a reduction plan before offsetting.
- The UN Secretary-General’s High-Level Expert Group report Integrity Matters (2022) says net-zero pledges must not rely on cheap credits in place of cuts, and must exclude new fossil-fuel supply.
- The EU’s Directive 2024/825 bans product claims of “climate neutral” or “reduced impact” based on offsetting, from 27 September 2026.
- The Oxford Principles for Net Zero Aligned Offsetting (2020, revised 2024) advise a shift from avoided-emission credits to removals with durable storage as net zero approaches.
India’s Carbon Credit Trading Scheme (CCTS), 2023
- Legal basis: the Energy Conservation (Amendment) Act, 2022 empowered the Centre to set up a carbon market. The CCTS was notified on 28 June 2023 and amended in December 2023 to add an offset mechanism.
- Institutions:
- The National Steering Committee for the Indian Carbon Market governs the scheme.
- The Bureau of Energy Efficiency (BEE) administers it.
- Grid Controller of India keeps the registry.
- The Central Electricity Regulatory Commission (CERC) regulates trading on the power exchanges.
- Compliance mechanism (baseline and credit):
- Obligated entities in energy-intensive sectors receive GHG emission intensity targets (tCO2e per tonne of product).
- A unit that beats its target earns Carbon Credit Certificates (CCCs), where 1 CCC = 1 tCO2e. A unit that misses it must buy CCCs.
- The Greenhouse Gases Emission Intensity Target Rules, 2025 set targets for 2025–26 and 2026–27, against a 2023–24 baseline, for 282 units in aluminium, cement, chlor-alkali and pulp and paper. Further sectors, including petroleum refining, petrochemicals and textiles, are being brought in.
- Offset mechanism: non-obligated entities can register projects (renewables, mangroves, agroforestry, green hydrogen and others) under BEE-approved methodologies and earn CCCs.
- Lineage:
- The scheme grows out of the Perform, Achieve and Trade (PAT) scheme (2012), which traded energy-saving certificates.
- It readies Indian exporters for the EU Carbon Border Adjustment Mechanism (CBAM), whose definitive phase began on 1 January 2026. CBAM charges embedded carbon in imported steel, aluminium, cement, fertilisers, electricity and hydrogen.
- The Green Credit Programme (notified 12 October 2023) is a separate, voluntary scheme under the Environment (Protection) Act, 1986.
- It rewards environmental actions such as tree plantation on degraded land, water conservation and mangrove restoration with green credits, administered by the Indian Council of Forestry Research and Education (ICFRE).
- Its credits are not carbon credits and do not count towards an NDC.
Efforts by Nations
Carbon-negative nations
- Only a few small, heavily forested countries with small populations and little heavy industry remove more CO2 than they emit. Bhutan, Suriname and Panama signed a joint declaration at COP26, Glasgow (November 2021) as the world’s carbon-negative countries. In it they called for finance, preferential trade and carbon pricing to reward net sinks.
Bhutan
- Constitutional forest rule: Article 5 of the Constitution of Bhutan (2008) requires at least 60% of the land to stay under forest “for all time”. Actual cover is about 71%.
- Balance: its forests absorb more than 9 million tonnes of CO2 a year, against emissions of under 4 million tonnes.
- Measures:
- At COP15 in Copenhagen (2009) Bhutan pledged to remain carbon neutral for all time, and its NDCs repeat the pledge.
- Almost all of its electricity comes from run-of-the-river hydropower. Surplus power is exported to India, displacing coal-based generation there.
- More than half of the country lies in protected areas and biological corridors, financed for the long term through the Bhutan for Life fund (2017).
- Its development philosophy is Gross National Happiness, with environmental conservation as one of its pillars. It also limits mass tourism through a high Sustainable Development Fee.
Suriname
- About 93% forest cover, among the highest of any country. It is a classic “high forest, low deforestation” (HFLD) nation of the Guiana Shield.
- Measures:
- Its NDC commits to keeping 93% forest cover.
- The Central Suriname Nature Reserve (UNESCO World Heritage Site, 2000) protects about 1.6 million ha of rainforest.
- It seeks REDD+ and Article 6 finance to reward standing forests.
- Pressure: small-scale gold mining and roads in the interior threaten the balance.
Panama
- About 65% forest cover and more than 165,000 ha of mangroves, the most diverse mangroves in the Americas.
- Measures:
- Panama declared itself carbon negative on the basis of its national greenhouse-gas inventory.
- It joined the COP26 declaration, and its NDC and long-term low-carbon strategy to 2050 aim to keep the status through forest restoration, protected areas, Indigenous territorial management and conservation of the Panama Canal watershed.
- Status is a matter of accounting: independent trackers list Panama’s goal as net zero by 2050 rather than as achieved. This shows how land-sector (LULUCF) estimates decide such claims.
Other net-sink claimants
| Country | Forest cover | Basis of claim | Key measure |
|---|---|---|---|
| Gabon | About 88% | Forest removals exceed emissions | First African country paid for verified REDD+ results (Norway–CAFI deal of 2019, up to US$150 million) |
| Guyana | About 85% | Low deforestation; self-declared net zero | Low Carbon Development Strategy; world’s first jurisdictional forest credits (2022), sold to Hess for at least US$750 million |
- A critical point: Guyana is also one of the world’s fastest-growing oil producers. Territorial accounting leaves out the exported emissions of the oil it sells.
Net-emitting (“carbon positive”) nations: targets and measures
- The global picture (Net Zero Tracker, Net Zero Stocktake 2025):
- 137 of 198 countries now have net-zero or similar targets, up from 124 in 2020.
- These cover about 77% of world GDP, down from 93% after the US federal government withdrew its target. Including the US states that kept their commitments raises coverage to 83%.
- About two-thirds of the targets are written into law or official policy.
- 1,245 of the world’s largest companies also have targets, but only 7% meet all the tracker’s integrity criteria.
- Most targets cluster at 2050:
- Finland 2035, Austria and Iceland 2040, and Germany and Sweden 2045 aim earlier.
- Large emerging economies aim later: China, Russia, Saudi Arabia, Indonesia and Nigeria 2060, Türkiye 2053 and India 2070.
| Country or bloc | Target | Legal status | Main measures |
|---|---|---|---|
| European Union | Climate neutrality 2050; 55% net cut by 2030 and 90% by 2040 (vs 1990) | European Climate Law (2021), amended for 2040 | Fit for 55 package; EU ETS (2005), extended to buildings and road transport from 2028; CBAM from 2026; Directive 2024/825 against offset-based claims |
| United Kingdom | Net zero 2050; 81% cut by 2035 (vs 1990) | Climate Change Act 2008, amended 2019 (first major economy) | Five-yearly carbon budgets; UK ETS (2021); coal power ended 2024 |
| China | CO2 peak before 2030; carbon neutrality before 2060 | Policy (“dual carbon” goals, 2020) | 2035 NDC: net GHG 7–10% below peak; national ETS (2021) widened in 2025 to steel, cement and aluminium; world’s largest solar and wind build-out |
| United States | Net zero 2050 target rescinded (2025) | Paris withdrawal effective 27 January 2026 | Action continues in states such as California (cap and trade) |
| Japan | Net zero 2050 | In law (2021) | 2035 NDC: 60% cut (vs 2013); GX green-transformation bonds |
| India | Net zero 2070 | Policy (LT-LEDS, 2022) | Panchamrit; 2035 NDC; CCTS; green hydrogen |
- The EU’s 2040 target allows a small share (up to 5 percentage points) to be met with high-quality international Article 6 credits from 2036. Critics see this as a weakening of the domestic effort.
- Germany brought its date forward from 2050 to 2045 in 2021, after its Constitutional Court ruled that the earlier law unfairly shifted the burden of cuts onto the young.
India’s pathway to net zero 2070
India’s position
- The third-largest emitter in absolute terms, but a low per-capita emitter: about 2 tonnes of CO2 per person, less than half the world average. Its share of cumulative emissions since 1850 is under 5%, against about 18% of the world’s population.
- Fourth Biennial Update Report (December 2024):
- Emissions in 2020 were 2,959 MtCO2e excluding land use. Forests and other land removed about 520 MtCO2e, roughly a sixth of this, giving net emissions of 2,437 MtCO2e.
- Energy accounted for about 76% of gross emissions.
- Equity stance:
- India invokes common but differentiated responsibilities and respective capabilities (CBDR-RC) and the right to its fair share of the remaining carbon space.
- Developed countries, which used most of the budget, should reach net zero well before 2050 and go net negative.
Commitments
- Panchamrit (COP26, Glasgow, 1 November 2021):
- 500 GW of non-fossil capacity by 2030;
- 50% of energy requirements from renewables by 2030;
- a cut of one billion tonnes in projected emissions to 2030;
- carbon intensity below 45% of the 2005 level by 2030;
- net zero by 2070.
- The Long-Term Low-Emission Development Strategy (LT-LEDS, COP27, November 2022) sets out seven transitions:
- low-carbon electricity;
- integrated transport;
- urban design and buildings;
- decoupled industrial growth;
- CO2 removal and engineering solutions;
- forests and vegetation;
- finance and technology.
| NDC | Emissions intensity of GDP (vs 2005) | Non-fossil share of installed power capacity | Additional carbon sink (forest and tree cover) |
|---|---|---|---|
| 2015 (for 2030) | 33–35% lower | 40% | 2.5–3 billion t CO2e |
| 2022 update (for 2030) | 45% lower | 50% | 2.5–3 billion t CO2e |
| 2026 NDC (for 2035; Cabinet approval March 2026) | 47% lower | 60% | 3.5–4.0 billion t CO2e (from 2005) |
- Progress:
- Emissions intensity fell 36% between 2005 and 2020.
- Non-fossil sources reached 52.57% of installed capacity by February 2026; the 50% target was met in mid-2025, five years early.
- An additional sink of 2.29 billion t CO2e had been created by 2021 (India State of Forest Report 2023).
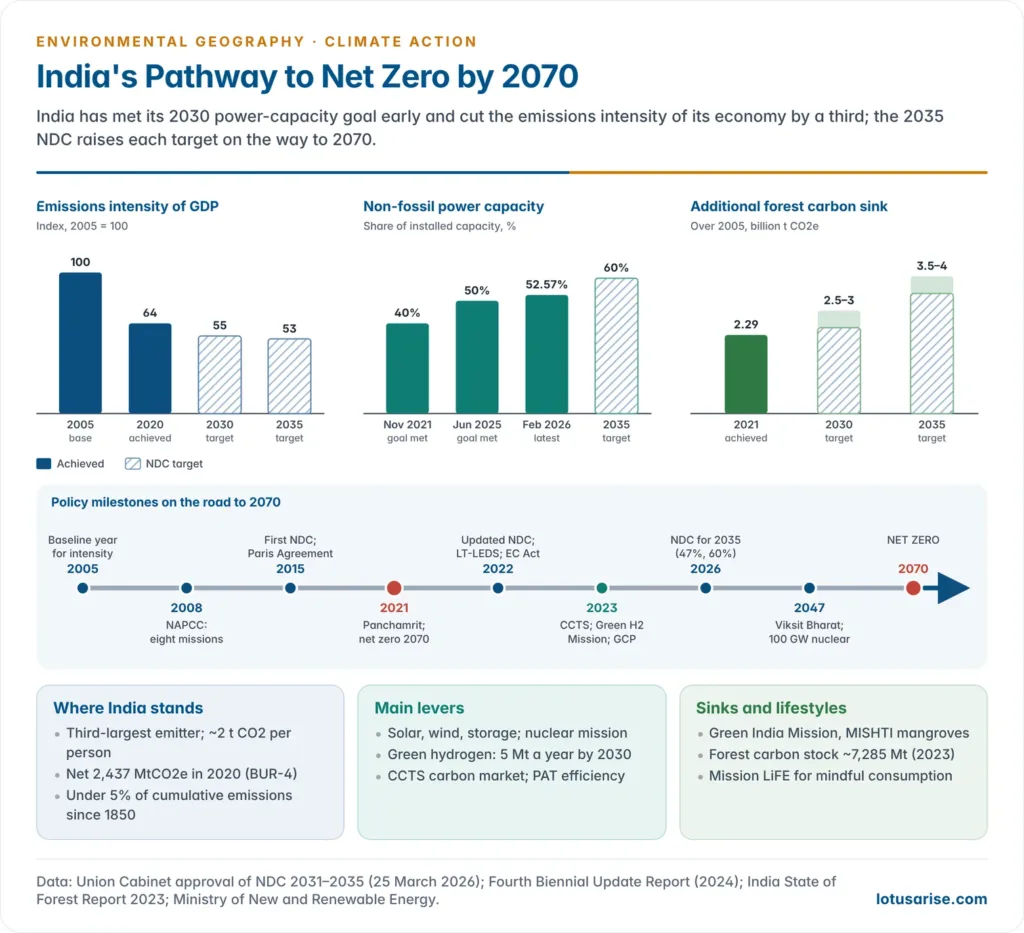
Measures
- Clean power: rapid growth of solar and wind power, solar parks and rooftop solar under PM Surya Ghar (2024). A Nuclear Energy Mission (2025) aims at 100 GW by 2047.
- Green hydrogen: the National Green Hydrogen Mission (January 2023) targets 5 million tonnes a year by 2030 for refineries, fertilisers and steel.
- Efficiency and markets: PAT, the CCTS, energy-efficient appliances (star labelling) and the Energy Conservation Building Code.
- Sinks:
- The Green India Mission, agroforestry and the MISHTI mangrove programme (2023) expand sinks.
- Forest and tree cover held a carbon stock of about 7,285 million tonnes in 2023.
- Transport: e-mobility incentives, ethanol blending (20% in petrol reached in 2025), and Indian Railways’ goal of net zero by 2030.
- Behaviour: Mission LiFE (Lifestyle for Environment, launched October 2022) promotes “mindful consumption” as India’s contribution to demand-side mitigation.
- Sub-national and local efforts:
- The vision of a carbon-neutral Ladakh (2020).
- Cochin International Airport, the world’s first fully solar-powered airport (2015).
- Meenangadi panchayat in Wayanad, Kerala, which began a carbon-neutral panchayat project in 2016 with tree banking.
- Gaps:
- Coal still generates around 70% of electricity, and new coal capacity is being added for peak demand.
- The 2035 NDC gives no absolute emissions peak year.
- Climate finance from developed countries remains far below India’s estimated needs.
Critical Evaluation
- The ambition gap: national pledges, even if fully met, still put the world on course for well above 1.5 °C. The implementation gap between targets and policies is wider still.
- Quality over quantity:
- Many targets lack interim milestones, sectoral plans or clarity on offsets and removals.
- Only a small share of corporate pledges meet basic integrity tests, which feeds greenwashing.
- Over-reliance on removals: national pledges alone imply about 1.2 billion ha of land for tree planting and other removals (Land Gap Report, 2022), which threatens food security, biodiversity and land rights.
- Removals should neutralise residual emissions, not delay cuts.
- Equity and justice:
- A uniform “net zero by 2050” ignores historical responsibility.
- Offsets bought by rich polluters from the South can amount to carbon colonialism: cheap land and forests are locked up for distant buyers, often without the free, prior and informed consent of forest peoples.
- Accounting loopholes:
- LULUCF credits allow forest-rich states to claim neutrality.
- Territorial accounting ignores consumption-based and exported emissions.
- Carbon leakage, and border measures like CBAM, raise trade-equity disputes with developing exporters.
- The way forward:
- Deep, early cuts in fossil fuels, the “transition away” agreed at COP28 (2023).
- Methane action.
- Protection of existing natural sinks before new plantations.
- High-integrity Article 6 markets.
- Finance and technology transfer to the South.
- Just transitions for coal regions such as Jharkhand, Chhattisgarh and Odisha.
- For geography, carbon neutrality is a spatial question of sources, sinks and responsibilities. The forested periphery (Bhutan, the Guiana Shield, the Congo Basin) holds the sinks that the industrial core depends on, so a just net-zero world must pay for the services the periphery provides.
Previous Year Questions
2024How is carbon neutrality essential for future environmental conservation ? Describe various efforts taken by nations in this regard.2023Discuss the green energy initiatives of India as a signatory nation to the Paris Agreement.2021Explaining the concept of carbon neutrality, describe the measures taken by carbon positive and negative nations.2021How is energy transition seen as an instrument for achieving zero carbon by 2050?




