

- Rural–urban distribution is the division of a population between villages and the countryside on one side and towns and cities on the other.
- It reflects the dominant economic activity, the settlement form and the level of development.
- Rural areas are tied to primary activities: agriculture, forestry, fishing.
- Urban areas concentrate secondary and tertiary activities: industry, trade, services and administration.
- The distribution is uneven and dynamic. Industrialisation, urbanisation, migration, technology and state policy keep shifting people from the first group to the second.
Measuring the Rural–Urban Split

What Counts as Urban
- There is no single world definition of “urban”. Each country uses its own criteria, so national figures are not strictly comparable:
- Administrative status: places with a municipality or corporation (India’s statutory towns, most of Latin America).
- Population size: from 200 inhabitants in Denmark to 50,000 in Japan.
- Density and economic character: India’s census towns need 5,000 people, 400 persons per km² and 75% of male main workers outside agriculture, tests that underlie the Indian classification of settlements.
- The rural–urban continuum is a better description of reality than a sharp dichotomy. Large villages near cities are often more urban in function than small towns, so the contrast between rural and urban settlement is a matter of degree.
- The UN World Urbanization Prospects 2025 added a harmonised measure, the Degree of Urbanisation:
- City: a contiguous area with at least 1,500 people per km² and 50,000 people in all.
- Town: a cluster of at least 300 people per km² and 5,000 people.
- Rural area: everything else.
- On this common yardstick the world in 2025 was 45% city, 36% town and 19% rural. By national definitions it was 58% urban. National definitions under-count urban people wherever dense, large villages are still classed as rural, as in South Asia and Sub-Saharan Africa.
| Measure | Definition | World, 2025 | India, 2025 |
|---|---|---|---|
| National definitions | Each country’s own criteria | 57.8% urban | 35.7% urban |
| Degree of Urbanisation: cities | 1,500/km² and 50,000 people | 45% | 40% |
| Degree of Urbanisation: towns | 300/km² and 5,000 people | 36% | 44% |
| Degree of Urbanisation: rural | The rest | 19% | about 16% |
Common Measures
- Level of urbanisation: the urban population as a percentage of the total population.
- Urban–rural ratio: urban population divided by rural population.
- Tempo of urbanisation: the difference between the urban and the rural growth rates. The urban share rises only when towns grow faster than villages.
- Share of the world’s urban population: shows where urban people actually live, independent of how urbanised a country is.
Global Scenario
The Urban Transition
- In 1950 the world was 29% urban: 0.72 billion urban against 1.78 billion rural people.
- The urban population overtook the rural population in 2007.
- By 2025, 4.76 billion people (57.8%) were urban and 3.47 billion (42.2%) rural (UN WUP 2025, national definitions).
- The UN’s 2018 revision gave about 56% for 2020 and 68% by 2050. The 2025 revision projects 67% by 2050. The world’s rural population is expected to peak in the 2040s and then decline.
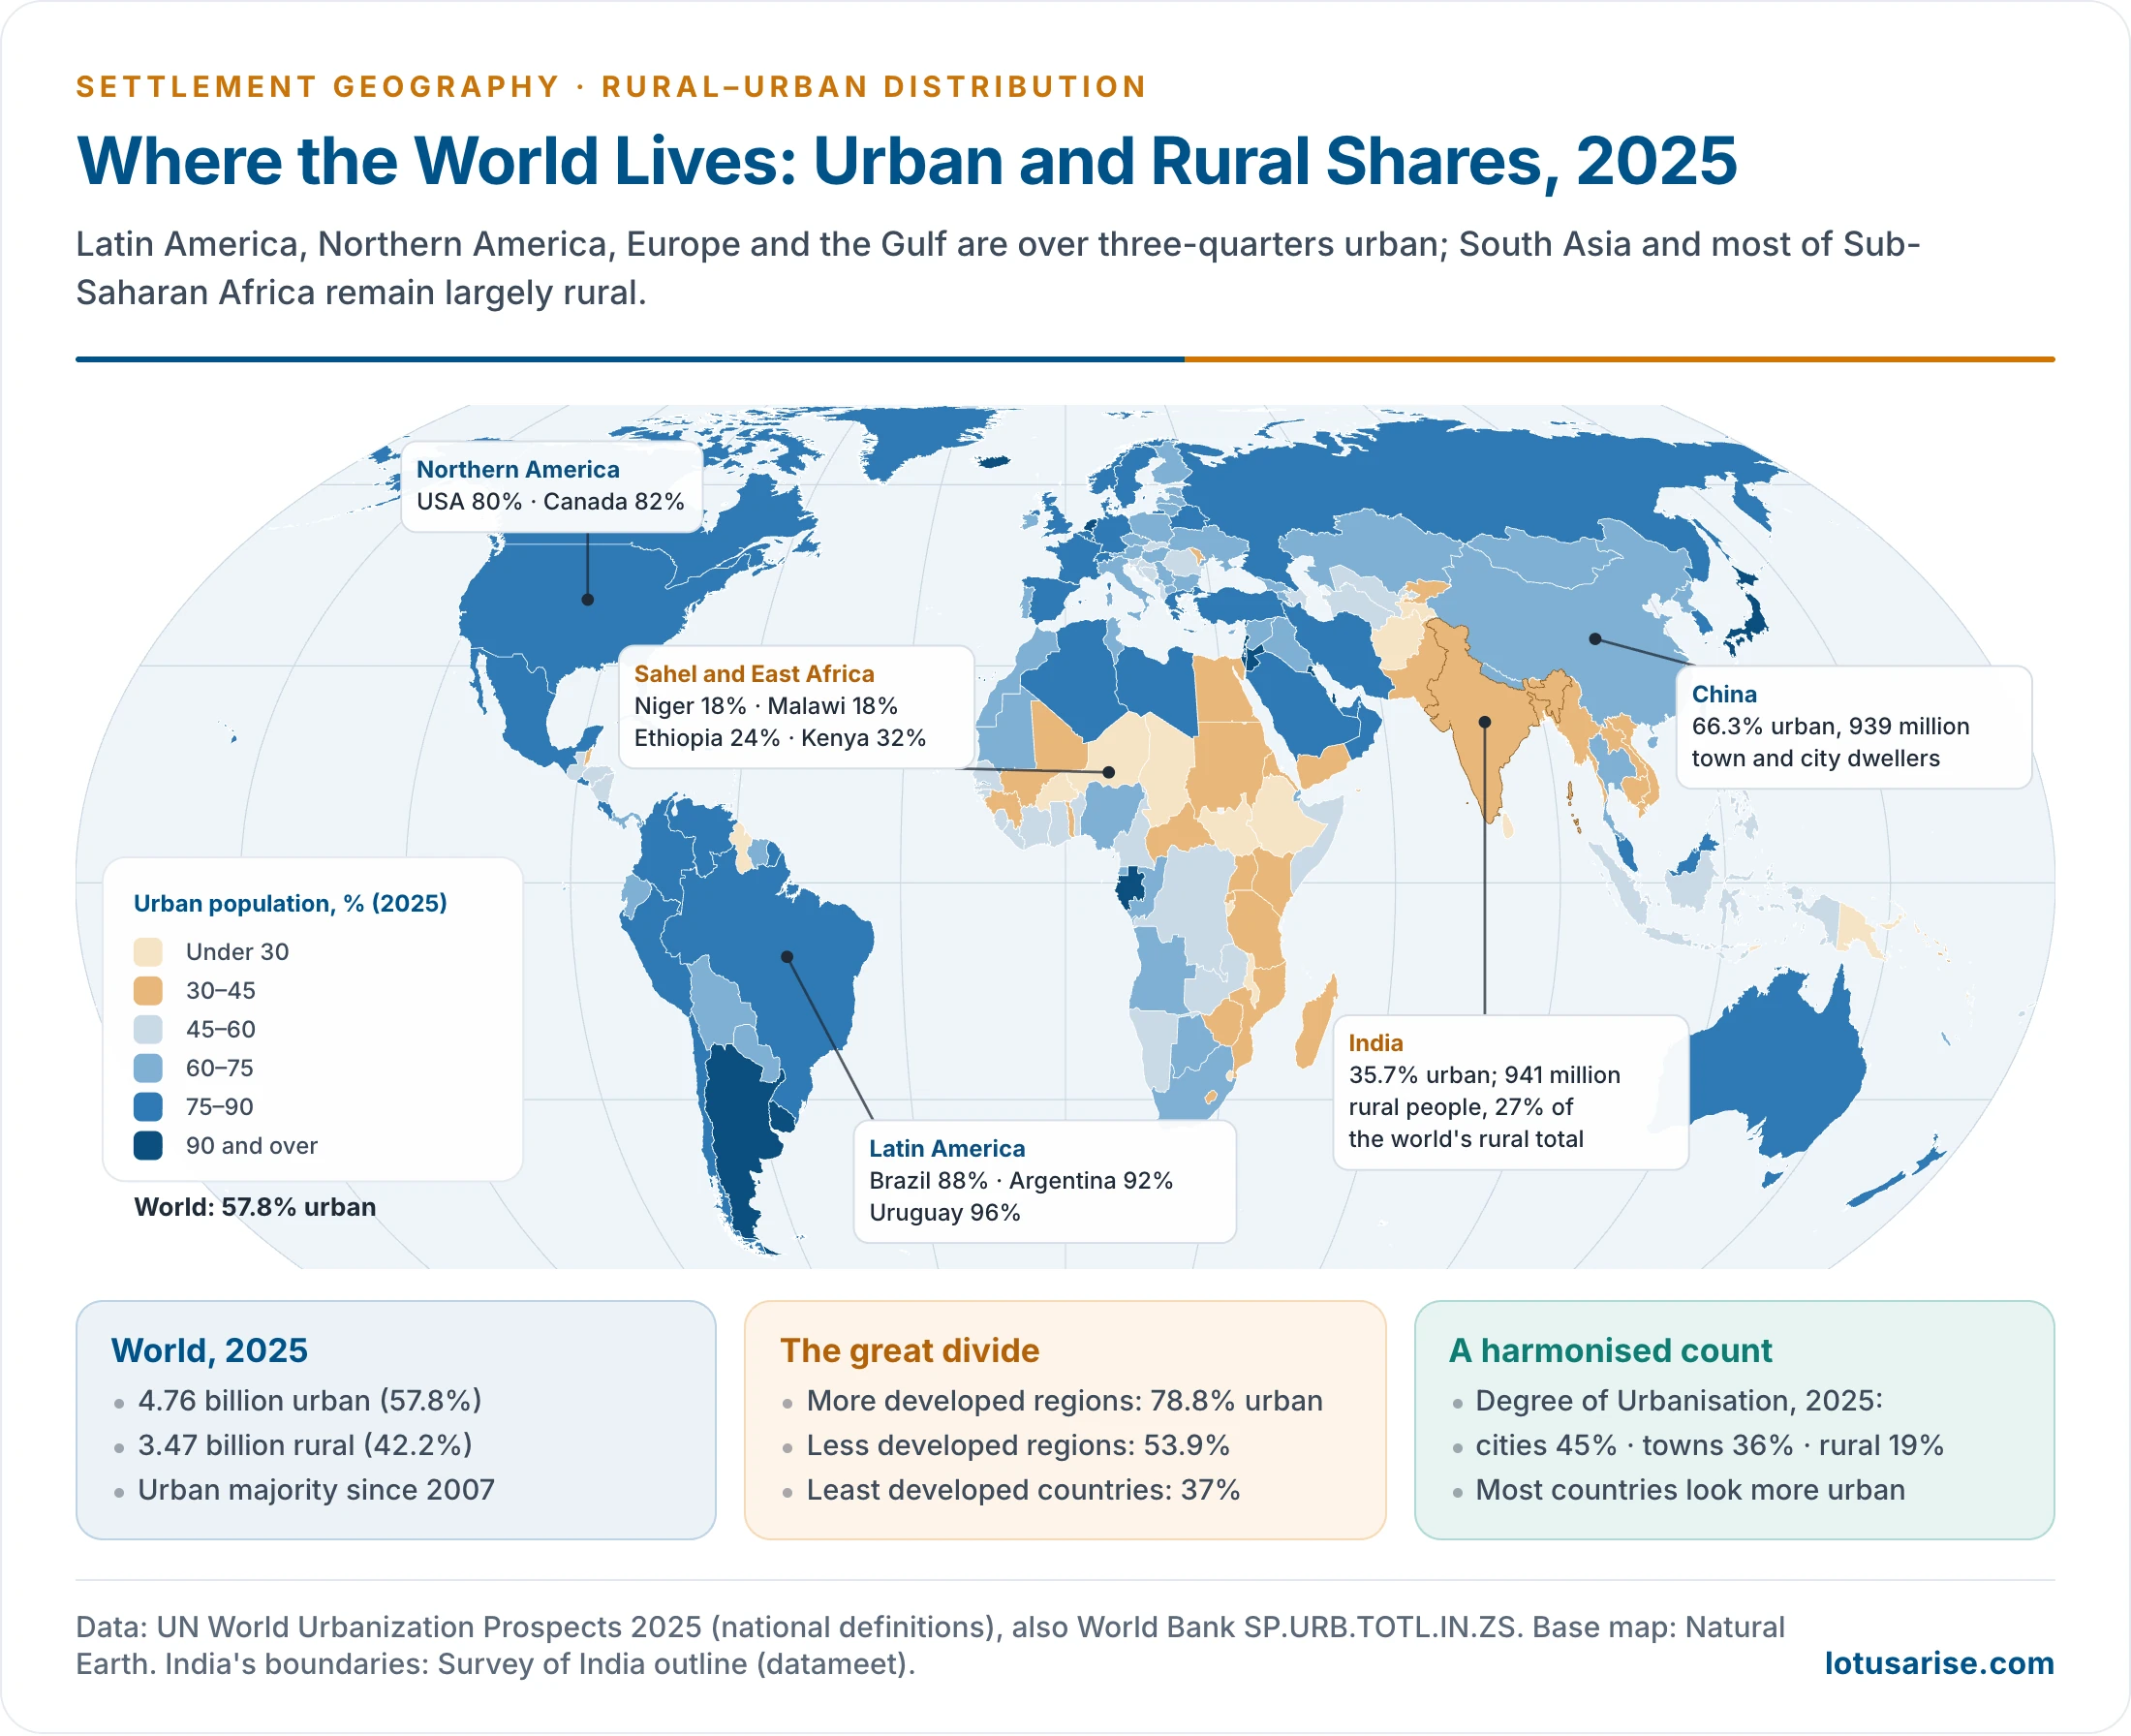
Regional Variation
- Highly urbanised (over 75%):
- Latin America and the Caribbean (82%): early primate-city growth and migration-led urbanisation. Brazil 88%, Argentina 92%, Uruguay 96%.
- Northern America (80%) and Europe (75%): early industrialisation, mature service economies.
- Moderately urbanised:
- Oceania (68%): highly urban Australia and New Zealand, rural Pacific islands.
- Asia (54%): sharp internal contrasts. Japan 92% and the Republic of Korea 81%, against China 66%, India 36% and Sri Lanka 20%.
- Least urbanised: Africa (46%).
- It is the only continent where rural people still outnumber urban people.
- It is also the fastest urbanising. Niger, Malawi and Ethiopia are under 25% urban.
- City-states such as Singapore, Hong Kong, Monaco, Kuwait and Bahrain are fully urban. They have no rural hinterland.
| Continent | Urban, 1950 (%) | Urban, 2025 (%) | Urban, 2050 (%) | Rural population, 2025 (million) |
|---|---|---|---|---|
| Northern America | 64 | 80 | 87 | 76 |
| Latin America & Caribbean | 42 | 82 | 88 | 123 |
| Europe | 51 | 75 | 81 | 183 |
| Oceania | 59 | 68 | 73 | 15 |
| Asia | 16 | 54 | 65 | 2,243 |
| Africa | 15 | 46 | 60 | 830 |
Level Versus Size
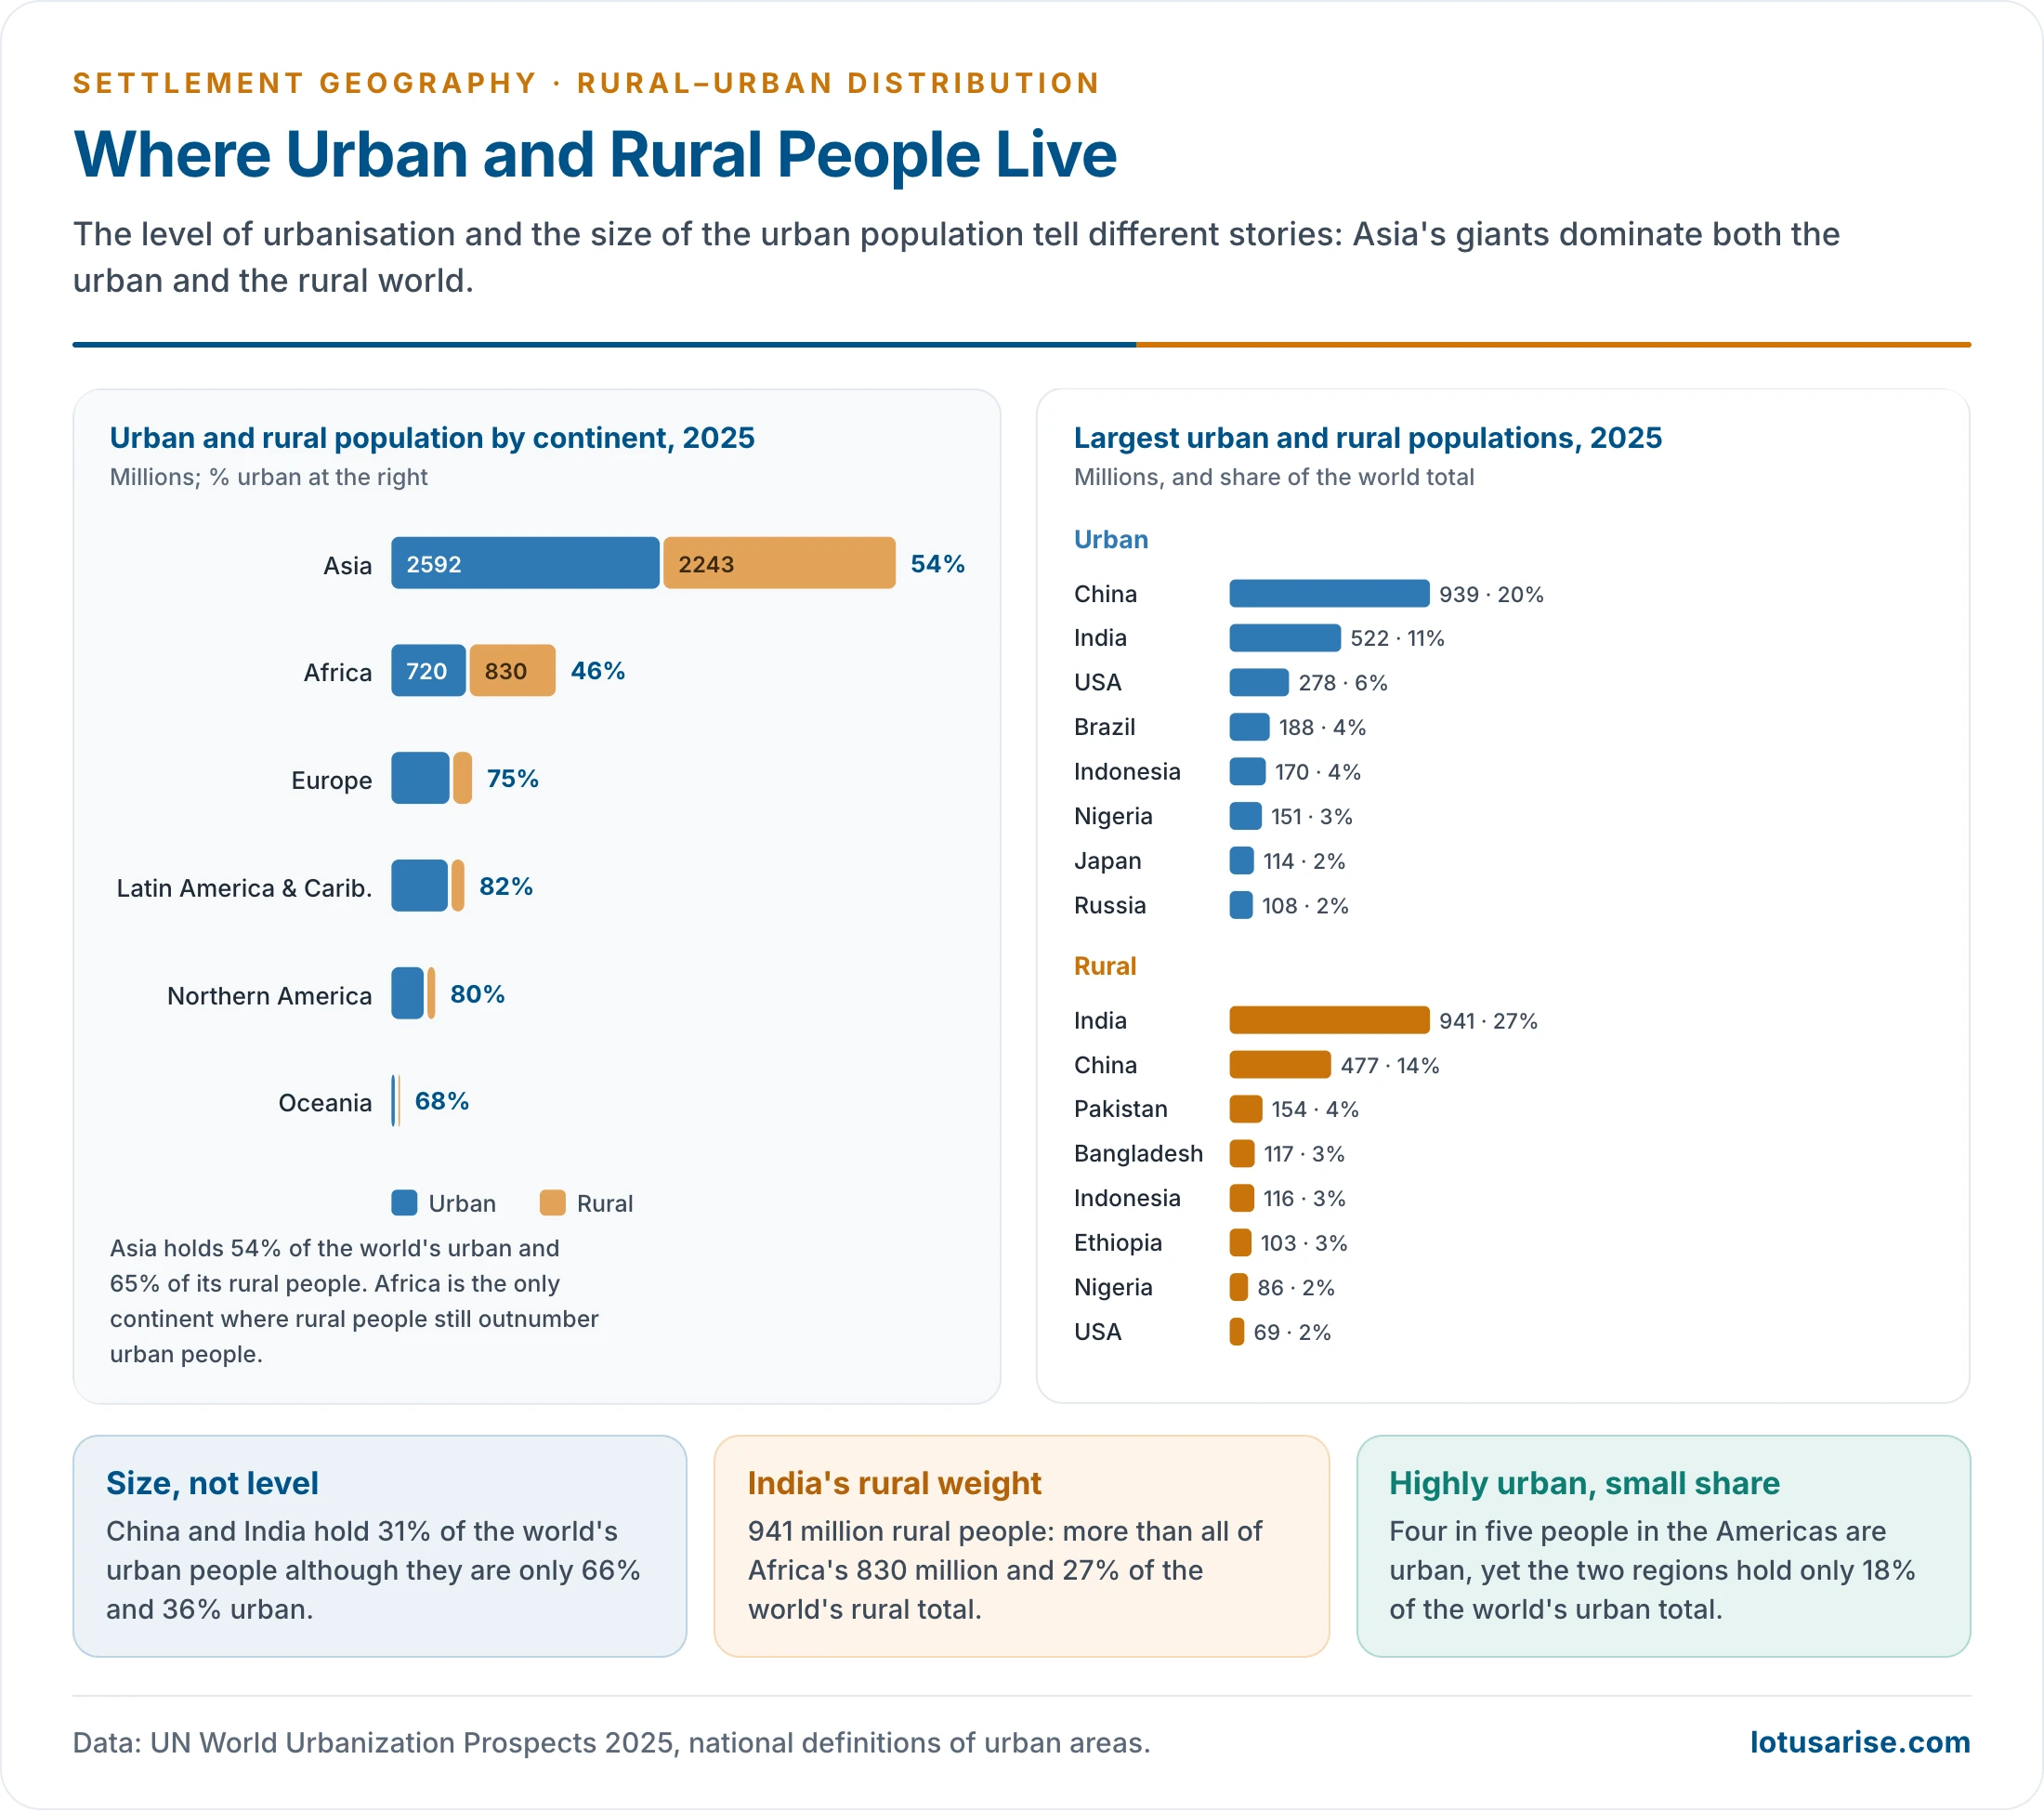
- The level of urbanisation and the size of the urban population give different pictures.
- China (939 million urban, 20% of the world total) and India (522 million, 11%) together hold 31% of the world’s urban people, though they are only 66% and 36% urban.
- Highly urbanised countries such as the USA (80%), Brazil (88%) and Mexico (80%) hold far smaller shares.
| Country | Share of world population, about 2022 (%) | Urban, about 2022 (%) | Urban, WUP 2025 (%) |
|---|---|---|---|
| China | 18.5 | 60.8 | 66 |
| India | 17.7 | 35.0 | 36 |
| USA | 4.2 | 82.8 | 80 |
| Indonesia | 3.5 | 56.4 | 59 |
| Pakistan | 2.8 | 35.1 | 40 |
| Brazil | 2.7 | 87.6 | 88 |
| Nigeria | 2.6 | 52.0 | 64 |
| Bangladesh | 2.1 | 39.4 | 33 |
| Russia | 1.9 | 73.7 | about 75 |
| Mexico | 1.7 | 83.8 | 80 |
| World | 100 | 56.2 | 57.8 |
- The two columns of urban share come from different estimates, so a fall does not mean that a country became less urban.
- The rural world is even more concentrated.
- India alone has 941 million rural people, more than all of Africa and 27% of the world’s rural population.
- China (477 million), Pakistan, Bangladesh, Indonesia, Ethiopia and Nigeria follow.
- Asia holds 54% of the world’s urban and 65% of its rural people.
Developed and Developing Countries
- Developed countries:
- High urbanisation (75–90%) and slow urban growth.
- The rural population is small and mechanised, often under 20% of the total. It is shrinking in absolute numbers.
- Growth comes from services and the knowledge economy. Some regions show counter-urbanisation to small towns and the countryside.
- Examples: Japan 92%, the UK 83%, Germany 82%, the USA 80%. Earlier estimates put Germany near 77% and the USA near 83%.
- Developing countries:
- Lower but rapidly rising urban shares, and a large agrarian rural base.
- Urban growth is often driven by migration and natural increase rather than by industrial job creation. The result is informal work, slums and peri-urban sprawl.
- Examples: India 36%, Bangladesh 33%, Pakistan 40%, Kenya 32%. Nigeria (64%) has moved fast.
- The world’s less developed regions were 53.9% urban in 2025 against 78.8% in the more developed regions. The least developed countries were only 37% urban.
Indian Scenario
Rural–Urban Composition
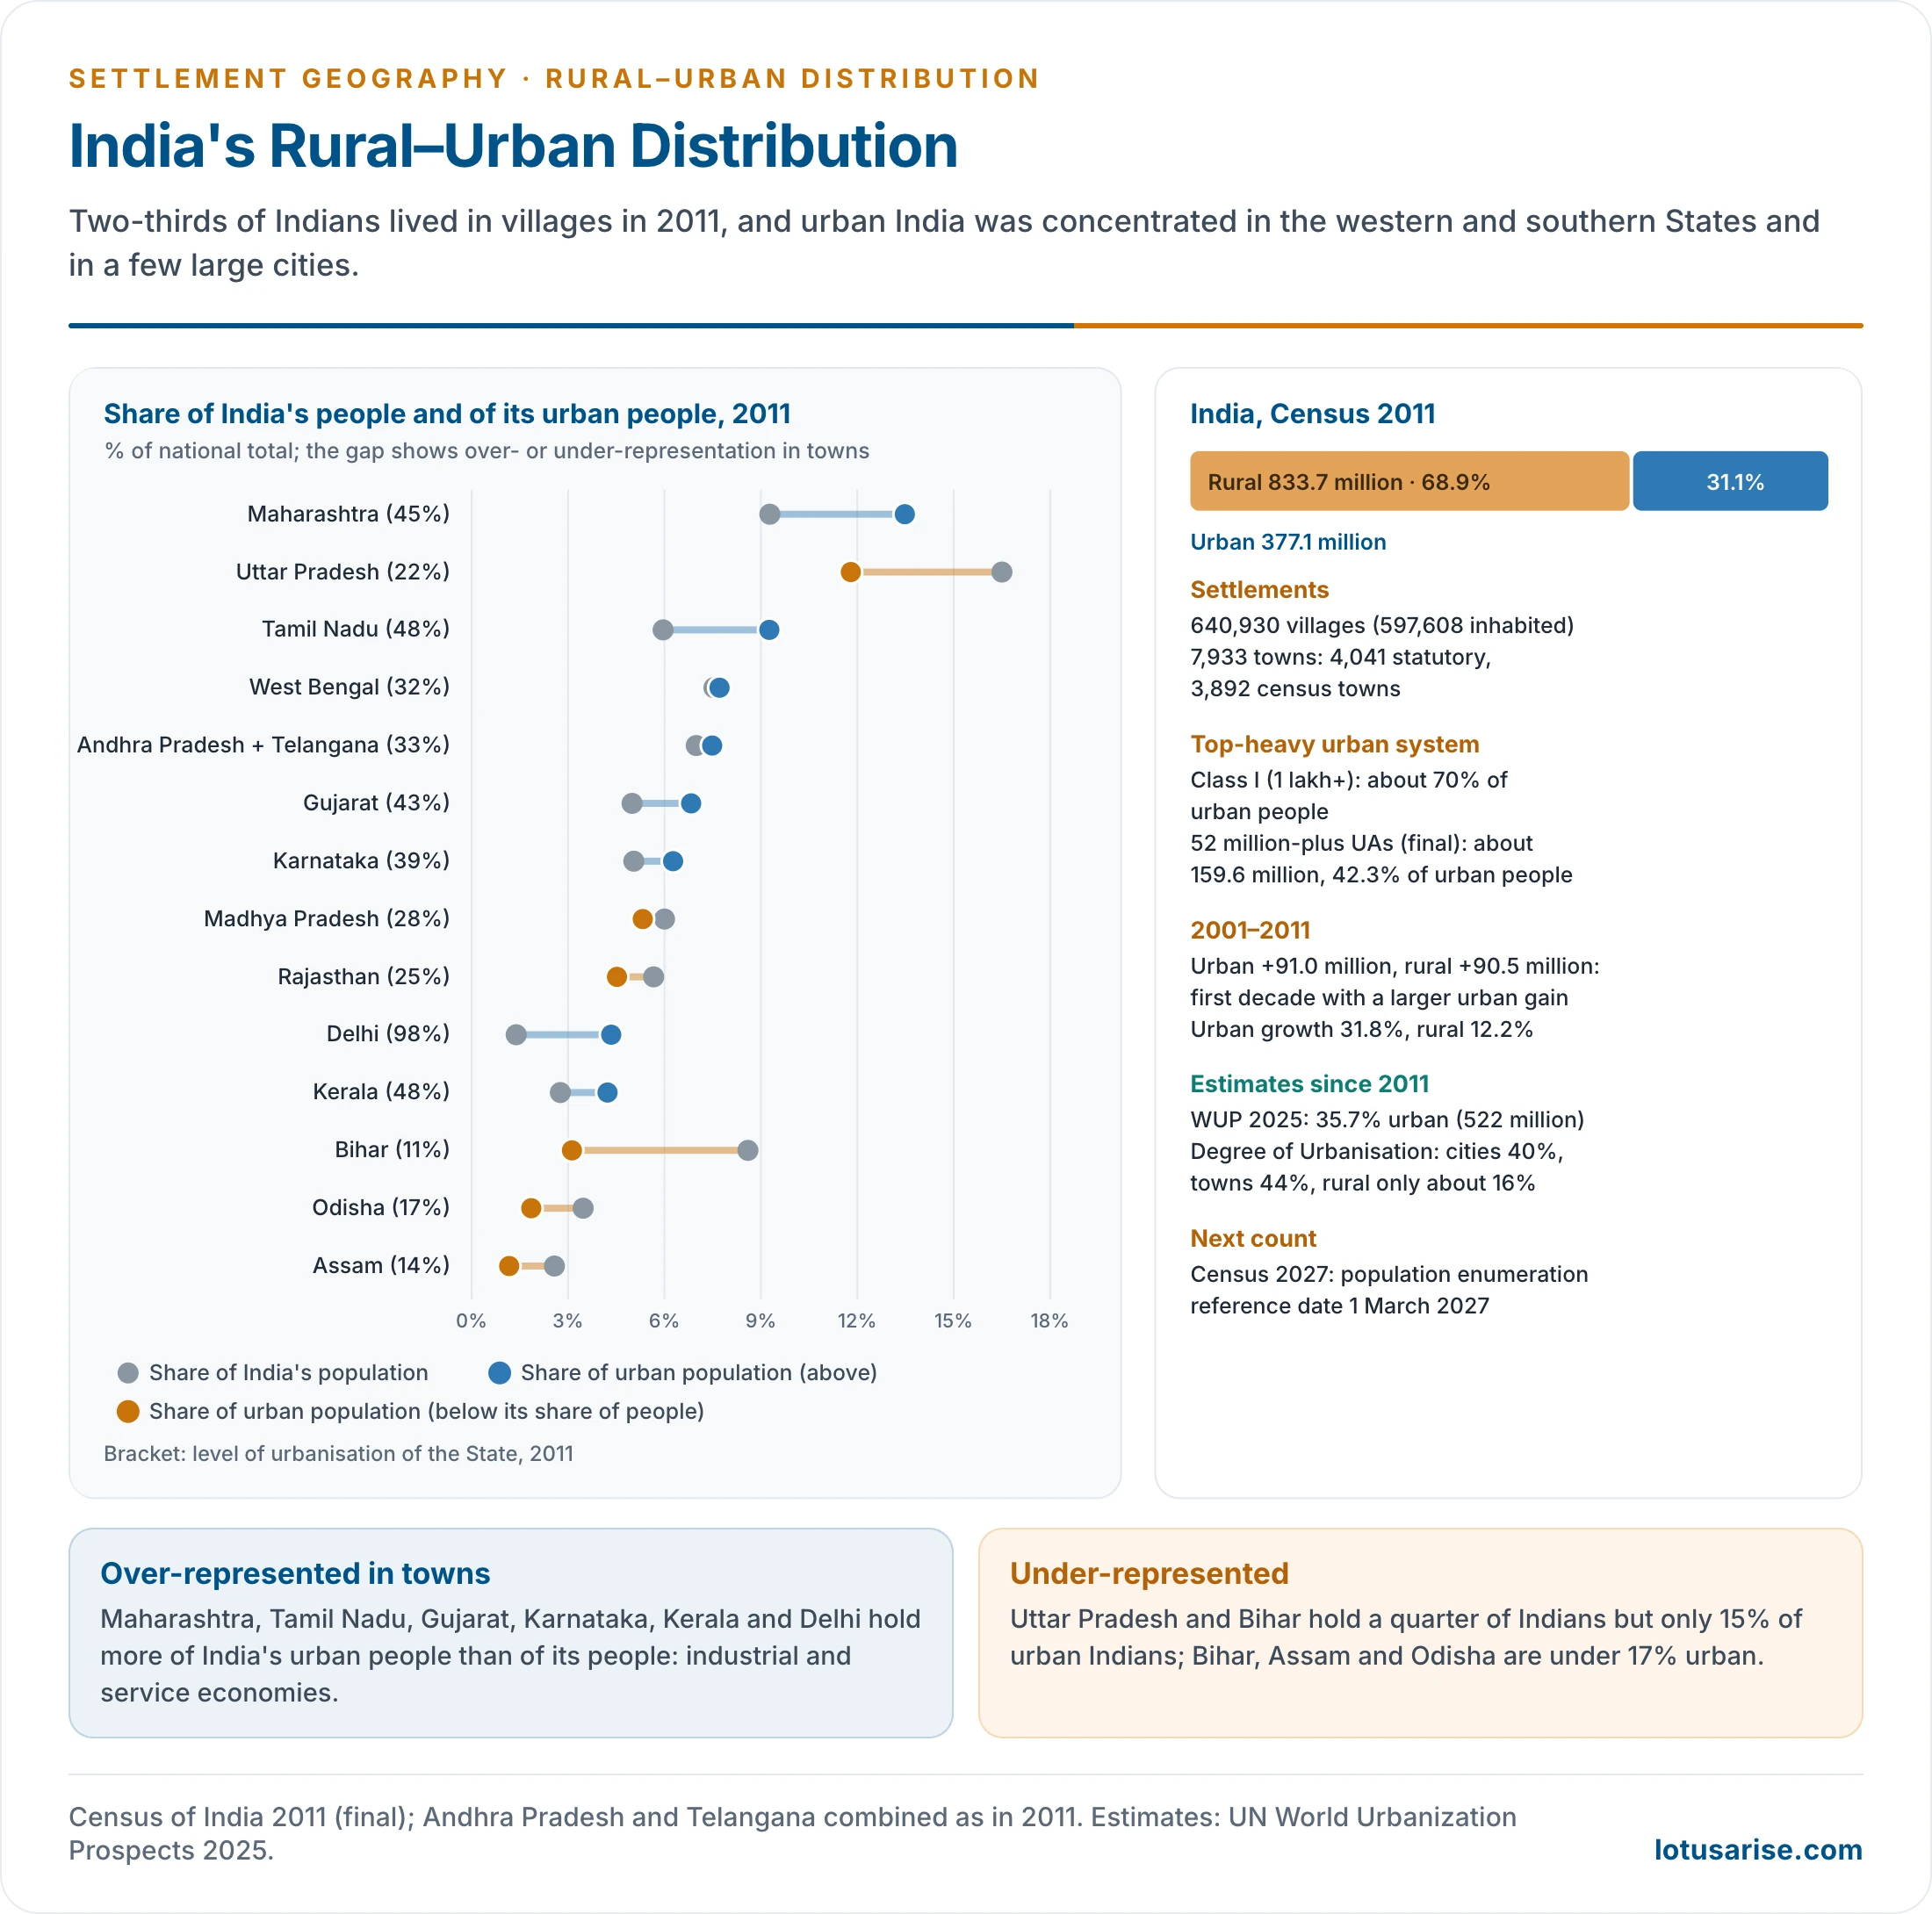
- Census 2011 counted 833.7 million rural (68.9%) and 377.1 million urban (31.14%) people.
- 31.16% is the provisional figure, still widely quoted.
- There were 640,930 villages (597,608 inhabited; the provisional total was 640,867) and 7,933 towns:
- 4,041 statutory towns, which have municipal status.
- 3,892 census towns, which are urban in character but still governed as villages.
- 2001–2011 was the first decade since Independence when the urban population grew more than the rural population in absolute numbers: +91 million against +90.5 million.
- The urban system is top-heavy:
- Class I towns (1 lakh and more) hold about 70% of urban people.
- The 52 million-plus urban agglomerations (final tables; 53 provisional) hold about 159.6 million (42.3%).
- The next census has a population reference date of 1 March 2027. Until its results, UN WUP 2025 estimates India at 35.7% urban (522 million) in 2025, rising to 43% by 2050. Other estimates for 2023–24 ran at 36–38% urban and 62–64% rural.
- On the Degree of Urbanisation yardstick, India is 40% city and 44% town. Its national definition keeps many large, dense villages “rural”.
State-Level Pattern
- Highly urbanised (over 45%): Delhi (97.5%), Chandigarh (97.3%), Puducherry (68.3%), Goa (62.2%), Mizoram (52.1%), Tamil Nadu (48.4%), Keralam (Kerala) (47.7%), Maharashtra (45.2%).
- The reasons are administrative functions, industry and ports, tourism, and in Keralam and Goa a dense rural–urban continuum of census towns.
- Moderately urbanised (30–45%): Gujarat (42.6%), Karnataka (38.7%), Punjab (37.5%), Haryana (34.9%), undivided Andhra Pradesh (33.4%), West Bengal (31.9%), Uttarakhand (30.2%).
- These have industrial corridors, port-based growth and IT hubs.
- Below the national average (25–30%): Manipur (29.2%), Nagaland (28.9%), Madhya Pradesh (27.6%), Jammu and Kashmir (27.4%), Tripura (26.2%), Sikkim (25.2%).
- Least urbanised (under 25%): Himachal Pradesh (10.0%), Bihar (11.3%), Assam (14.1%), Odisha (16.7%), Meghalaya, Uttar Pradesh (22.3%), Arunachal Pradesh, Chhattisgarh, Jharkhand and Rajasthan.
- These have agrarian or hill economies, a weak industrial base and poor infrastructure.
- Share of India’s urban people: Maharashtra (13.5%), Uttar Pradesh (11.8%) and Tamil Nadu (9.3%) lead.
- With West Bengal and undivided Andhra Pradesh, these five hold about half of urban India. Madhya Pradesh, Gujarat, Karnataka, Bihar and Rajasthan hold about another quarter.
- Uttar Pradesh and Bihar hold a quarter of Indians but only 15% of urban Indians.
| State/UT | Share of India’s urban population (%) | Urban (%) |
|---|---|---|
| Maharashtra | 13.48 | 45.22 |
| Uttar Pradesh | 11.80 | 22.27 |
| Tamil Nadu | 9.26 | 48.40 |
| West Bengal | 7.71 | 31.87 |
| Andhra Pradesh (incl. Telangana) | 7.48 | 33.36 |
| Gujarat | 6.83 | 42.60 |
| Karnataka | 6.27 | 38.67 |
| Madhya Pradesh | 5.32 | 27.63 |
| Rajasthan | 4.52 | 24.87 |
| Delhi | 4.34 | 97.50 |
| Keralam | 4.23 | 47.70 |
| Bihar | 3.12 | 11.29 |
| Punjab | 2.76 | 37.48 |
| Haryana | 2.34 | 34.88 |
| Jharkhand | 2.10 | 24.05 |
| Odisha | 1.86 | 16.69 |
| Chhattisgarh | 1.57 | 23.24 |
| Assam | 1.17 | 14.10 |
| Jammu & Kashmir (incl. Ladakh) | 0.91 | 27.38 |
| Uttarakhand | 0.81 | 30.23 |
| Goa | 0.24 | 62.17 |
| Himachal Pradesh | 0.18 | 10.03 |
| Chandigarh | 0.27 | 97.25 |
| Tripura | 0.25 | 26.17 |
| Puducherry | 0.23 | 68.33 |
| Manipur | 0.22 | 29.21 |
| Meghalaya | 0.16 | 20.07 |
| Nagaland | 0.15 | 28.86 |
| Mizoram | 0.15 | 52.11 |
| Arunachal Pradesh | 0.08 | 22.94 |
| Daman & Diu | 0.05 | 75.17 |
| Sikkim | 0.04 | 25.15 |
| Andaman & Nicobar Islands | 0.04 | 37.70 |
| Dadra & Nagar Haveli | 0.04 | 46.72 |
| Lakshadweep | 0.01 | 78.07 |
| India | 100.00 | 31.14 |
Regional Imbalance
- Western and southern India are more urban because of:
- Industrialisation: Maharashtra, Gujarat, Tamil Nadu.
- IT and services: Karnataka, Telangana, Tamil Nadu.
- Ports and colonial port cities: Mumbai, Chennai.
- Northern and eastern India are less urban because of:
- High population pressure on agriculture.
- Slower structural change.
- Few large cities outside the State capitals.
- The imbalance drives long-distance migration from the BIMARU States (Bihar, Madhya Pradesh, Rajasthan, Uttar Pradesh) and Odisha to the urban-industrial west and south.
Processes Reshaping the Distribution
- Urbanisation: the growth of towns and of metropolitan regions such as the National Capital Region and the Mumbai Metropolitan Region.
- Migration:
- Rural–urban, with push from poverty and small holdings and pull from jobs and services.
- Seasonal and circular migration, which keeps families split between village and town.
- Reclassification: villages crossing the census tests become census towns.
- New census towns supplied about 30% of urban growth in 2001–11.
- Natural increase supplied 44%, and net migration with boundary changes the rest.
- Economic transformation: the shift from agriculture to industry and services, and the growth of rural non-farm work.
- Technology: farm mechanisation cuts rural labour demand. Roads, mobile phones and digital services carry urban functions into villages.
Emerging Trends
- Large cities and corridors:
- Megacities have over 10 million people. There were 33 in 2025, 19 of them in Asia, and they include Shanghai and Lagos.
- Delhi, Mumbai, Kolkata, Bengaluru and Chennai rank among the world’s megacities.
- The Delhi–Mumbai Industrial Corridor, the Pearl River Delta of China and similar belts are emerging, as are conurbations.
- Peri-urbanisation: growth spills into the rural–urban fringe, beyond municipal limits.
- Subaltern urbanisation: towns grow without metropolitan support, through census towns and small market centres.
- Rurbanisation: providing urban amenities in village clusters.
- Examples are the Shyama Prasad Mukherji Rurban Mission (2016) and, earlier, PURA.
- Counter-urbanisation and suburbanisation in developed countries contrast with rapid concentration in developing countries.
Challenges
- In urban areas:
- Slums and informal settlements.
- Shortages of housing, water, sanitation and transport.
- Urban unemployment and informal, insecure work.
- Air pollution and urban flooding, the classic problems of urbanisation.
- In rural areas:
- Agrarian distress and disguised unemployment.
- Out-migration of young men, with left-behind women and elderly.
- Weak services in health and education.
- Regional: widening rural–urban income gaps and inter-State disparity.
- Environmental:
- In cities: urban heat, waste and pollution.
- In rural areas: resource degradation, groundwater depletion and loss of farmland to urban expansion.
- Planning: India’s under-counted urbanisation means many dense “villages” lack urban governance and budgets.
Previous Year Questions
2012“Though 70% of Indian population is rural, urban planning is crucial to the development of India.” Discuss.2020Distinguish between mobility and migration. What are the causes and consequences of rural to urban migration in India?2020Analyse the changing nature of workforce composition vis-à-vis the rural-urban divide in India.




