

- Health indicators are measurable values that describe the health of a population: how long people live, how many die young, how well they are nourished and how well the health system serves them.
- Population problems arise when the size, growth, structure or distribution of a population is out of balance with resources, jobs, services and the environment. The world today faces two opposite kinds: rapid growth in some regions and ageing and shrinking in others.
- Health and population problems are linked. High child mortality sustains high fertility; poor nutrition lowers productivity; ageing raises the burden of chronic disease.
Health Indicators

Meaning and Types
- The WHO treats a health indicator as a variable that can be measured directly and that reflects the state of health of people in a community. A good indicator is valid, reliable, sensitive, specific and comparable across places and time.
- Types of health indicators:
- Mortality indicators: infant, neonatal and under-five mortality, maternal mortality, crude and age-specific death rates, life expectancy. Their measures are set out under mortality.
- Morbidity indicators: incidence and prevalence of disease (tuberculosis, diabetes, hypertension), hospital admissions, disability.
- Nutrition indicators: stunting, wasting, underweight and overweight in children; anaemia; low birth weight; adult body mass index.
- Health-care indicators: institutional births, full immunisation, antenatal care, doctors and beds per population, insurance cover.
- Health-finance indicators: health spending as a share of GDP, government share, out-of-pocket expenditure.
- Determinants of health: safe water, sanitation, clean cooking fuel, female literacy, income.
- Composite indicators combine several:
- Disability-adjusted life years (DALYs): years of life lost plus years lived with disability.
- Healthy life expectancy (HALE): years lived in full health.
- The UHC service coverage index, which tracks universal health coverage (SDG 3.8).
- The health dimension of the Human Development Index.
India and the World Compared
- Survival:
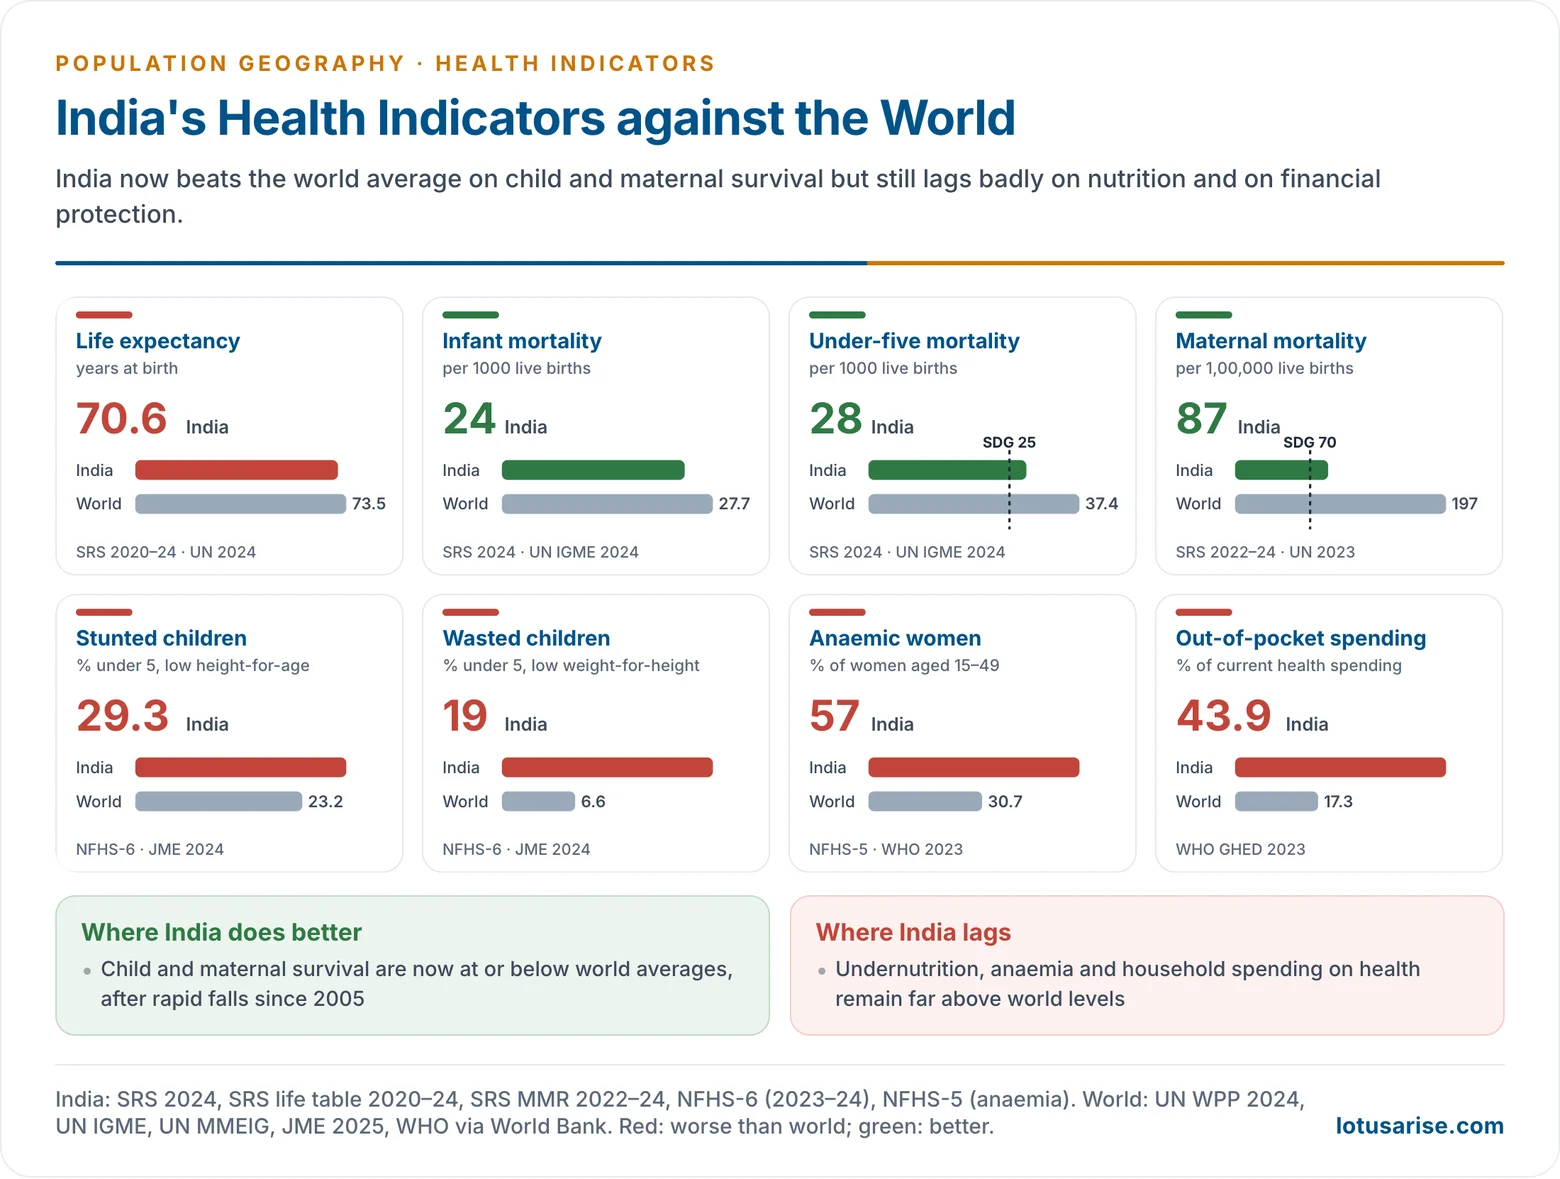
- Life expectancy: India 70.6 years (SRS, 2020–24; the UN puts it at 72.2), against 73.5 for the world (2024).
- Infant mortality: India 24 per 1000 live births (SRS 2024), slightly below the world’s 28.
- Under-five mortality: India 28 against 37 for the world.
- Neonatal mortality: India 18, about the world level (17). Newborn deaths are now the hard core of child mortality.
- Maternal mortality: India 87 per lakh live births (SRS 2022–24), less than half the world’s 197 (2023), though above the SDG target of 70.
- Nutrition: India is weakest here.
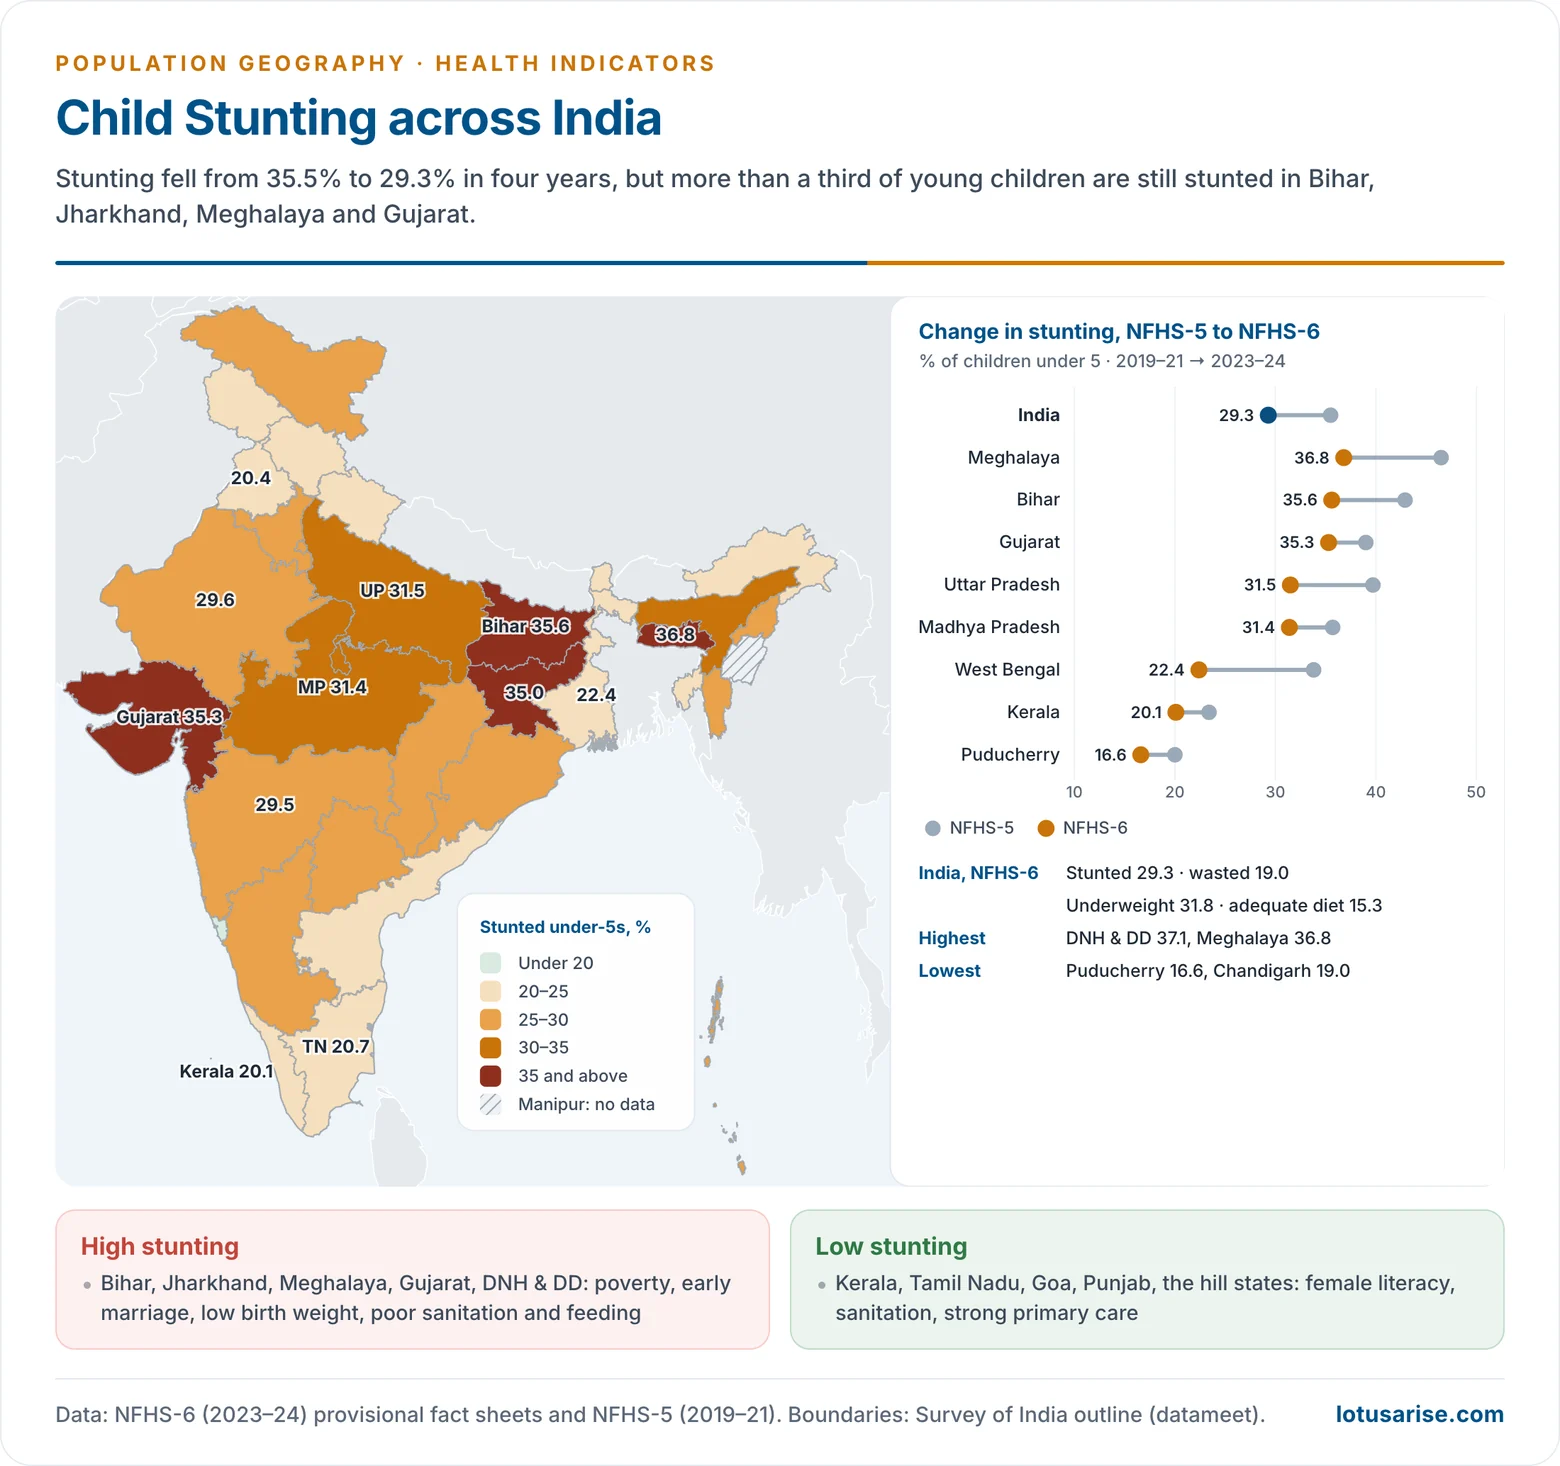
- Stunting: 29.3% of children under five (NFHS-6, 2023–24), down from 35.5% in 2019–21, but above the world’s 23.2%.
- Wasting: 19.0%, almost three times the world’s 6.6% and among the highest in the world.
- Anaemia among women aged 15–49: 57% (NFHS-5), against about 31% worldwide (WHO).
- Health care:
- Institutional births 90.6% and full immunisation 82.6% of children aged 12–23 months (NFHS-6).
- 60.2% of households have a member covered by health insurance, up from 41% in NFHS-5.
- Health finance:
- Total health expenditure was 3.37% of GDP in 2022–23, of which government spending was 1.48% of GDP (National Health Accounts). The National Health Policy 2017 target for public spending is 2.5%.
- Out-of-pocket expenditure was 43.4% of total health expenditure, down from 64.2% in 2013–14. Worldwide, households pay about 17% of current health spending directly (WHO).
- Disease burden: India carries about a quarter of the world’s tuberculosis cases (WHO) and about 101 million people with diabetes (ICMR-INDIAB, 2023). Non-communicable diseases caused 60% of deaths in 2022–24 (SRS).
| Indicator | India | World | Source and year |
|---|---|---|---|
| Life expectancy (years) | 70.6 | 73.5 | SRS 2020–24; UN WPP 2024 |
| Infant mortality (per 1000) | 24 | 28 | SRS 2024; UN IGME 2024 |
| Under-five mortality (per 1000) | 28 | 37 | SRS 2024; UN IGME 2024 |
| Maternal mortality (per lakh) | 87 | 197 | SRS 2022–24; UN MMEIG 2023 |
| Stunted children (%) | 29.3 | 23.2 | NFHS-6 2023–24; JME 2024 |
| Wasted children (%) | 19.0 | 6.6 | NFHS-6 2023–24; JME 2024 |
| Anaemic women (%) | 57.0 | 30.7 | NFHS-5; WHO 2023 |
| Out-of-pocket share of health spending (%) | 43.4 | about 17 | NHA 2022–23; WHO 2023 |
World Pattern of Health Indicators
- Sub-Saharan Africa has the worst survival indicators: life expectancy 62.8 (2024), under-five mortality 71 and neonatal mortality 27 per 1000, and maternal mortality about 450 per lakh. HIV, malaria, conflict and very weak health systems add to poverty.
- South Asia has better survival than Africa but worse nutrition:
- 15.7% of its children are wasted, against 5.9% in Sub-Saharan Africa (2024);
- about half of its women are anaemic.
- This “Asian enigma” (Vulimiri Ramalingaswami, Urban Jonsson and Jon Rohde, 1996) is explained by the low status of women, low birth weight, poor sanitation and feeding practices, more than by food supply.
- East Asia, Latin America and the Middle East have mostly completed the shift to chronic disease, with obesity and diabetes rising fast.
- Europe, North America, Japan and Australia have the highest life expectancy and lowest mortality. Their problems are ageing, chronic disease and costly care: the USA spends about 17% of GDP on health with lower life expectancy than Western Europe.
- Gender gap: women outlive men worldwide by about five years (76.0 against 71.1 in 2024); in India by about four.
Regional Variations among Indian States
- Mortality:
- IMR ranges from 8 in Kerala to 36 in Chhattisgarh and 35 in Madhya Pradesh and Uttar Pradesh (SRS 2024).
- Life expectancy ranges from 75.6 years in Kerala to the mid-60s in Chhattisgarh (SRS 2020–24).
- Six states, Kerala, Tamil Nadu, Maharashtra, Andhra Pradesh, Telangana and Gujarat, had already met the SDG maternal mortality target of 70 by 2022–24, while Uttar Pradesh, Madhya Pradesh, Chhattisgarh and Odisha remained well above 100.
- Nutrition (NFHS-6):
- Highest stunting: Dadra and Nagar Haveli and Daman and Diu (37.1%), Meghalaya (36.8%), Bihar (35.6%), Gujarat (35.3%) and Jharkhand (35.0%).
- Lowest stunting: Puducherry (16.6%), Chandigarh, Goa, Uttarakhand, Sikkim, Kerala (20.1%), Punjab and Himachal Pradesh, all near 20%.
- Gujarat shows that income alone does not end undernutrition: diet, sanitation, women’s status and feeding practices matter as much.
- Health care: institutional births are lowest in Nagaland (62%) and Meghalaya (66%), with hill terrain and dispersed settlement, and in Jharkhand and Bihar (77–81%).
- The regional pattern:
- Good: the south (Kerala, Tamil Nadu), Goa, Maharashtra and the north-western hill states, with high female literacy, strong primary health care and better sanitation.
- Lagging: the EAG belt of central and eastern India (Uttar Pradesh, Madhya Pradesh, Chhattisgarh, Jharkhand, Bihar, Odisha), parts of the north-east (Meghalaya, Nagaland) and tribal districts everywhere, with poverty, early marriage, weak services and difficult terrain.
- NITI Aayog’s Health Index (2019–20) ranked Kerala first and Uttar Pradesh last among the larger states.
- Causes of the variation: levels of income and female literacy, the strength of the public primary health system, governance, sanitation and safe water, terrain and settlement dispersal, and social structure (caste, tribe, gender norms).
Nutrition: Stunting, Wasting and the Double Burden
- Definitions (WHO growth standards, below minus two standard deviations of the reference median):
- Stunting: low height-for-age. A sign of chronic undernutrition and repeated infection over the first 1,000 days (from conception to age two); largely irreversible.
- Wasting: low weight-for-height. A sign of acute undernutrition from recent food shortage or illness; it carries a high risk of death.
- Underweight: low weight-for-age, a composite of both.
- Overweight: high weight-for-height, the other side of malnutrition.
- Why they are more prevalent in developing countries:
- Poverty and food insecurity: diets poor in protein, fat and micronutrients.
- Maternal undernutrition and early marriage, leading to low birth weight.
- Infection: diarrhoea and gut damage from unsafe water and poor sanitation stop children absorbing food.
- Poor infant and young child feeding: only 15.3% of Indian children aged 6–23 months received an adequate diet (NFHS-6).
- Low female education and status, which shape feeding, hygiene and care-seeking.
- Weak health and nutrition services, conflict and climate shocks.
- World: in 2024, 150.2 million children under five were stunted, 42.8 million wasted and 35.5 million overweight. Asia (51%) and Africa (43%) hold almost all stunted children (UNICEF, WHO and World Bank).
- The double burden in India: NFHS-6 found 30.7% of women aged 15–49 overweight or obese, alongside 19.7% who were underweight. Stunted children and obese mothers increasingly live in the same households.
- India’s responses:
- Integrated Child Development Services (1975), anganwadis and supplementary nutrition;
- the National Food Security Act (2013), with free grain now under the PM Garib Kalyan Anna Yojana;
- POSHAN Abhiyaan (2018) and Mission Poshan 2.0 (2021);
- PM POSHAN (2021), which replaced the mid-day meal scheme;
- Pradhan Mantri Matru Vandana Yojana (2017) for maternity benefit;
- Anaemia Mukt Bharat (2018) and rice fortification;
- Swachh Bharat Mission (2014) and Jal Jeevan Mission (2019), which act on the infection side.
- Achievement: stunting fell from 35.5% to 29.3% between NFHS-5 and NFHS-6, but wasting barely moved (19.3% to 19.0%).
Population Problems
World Population Problems
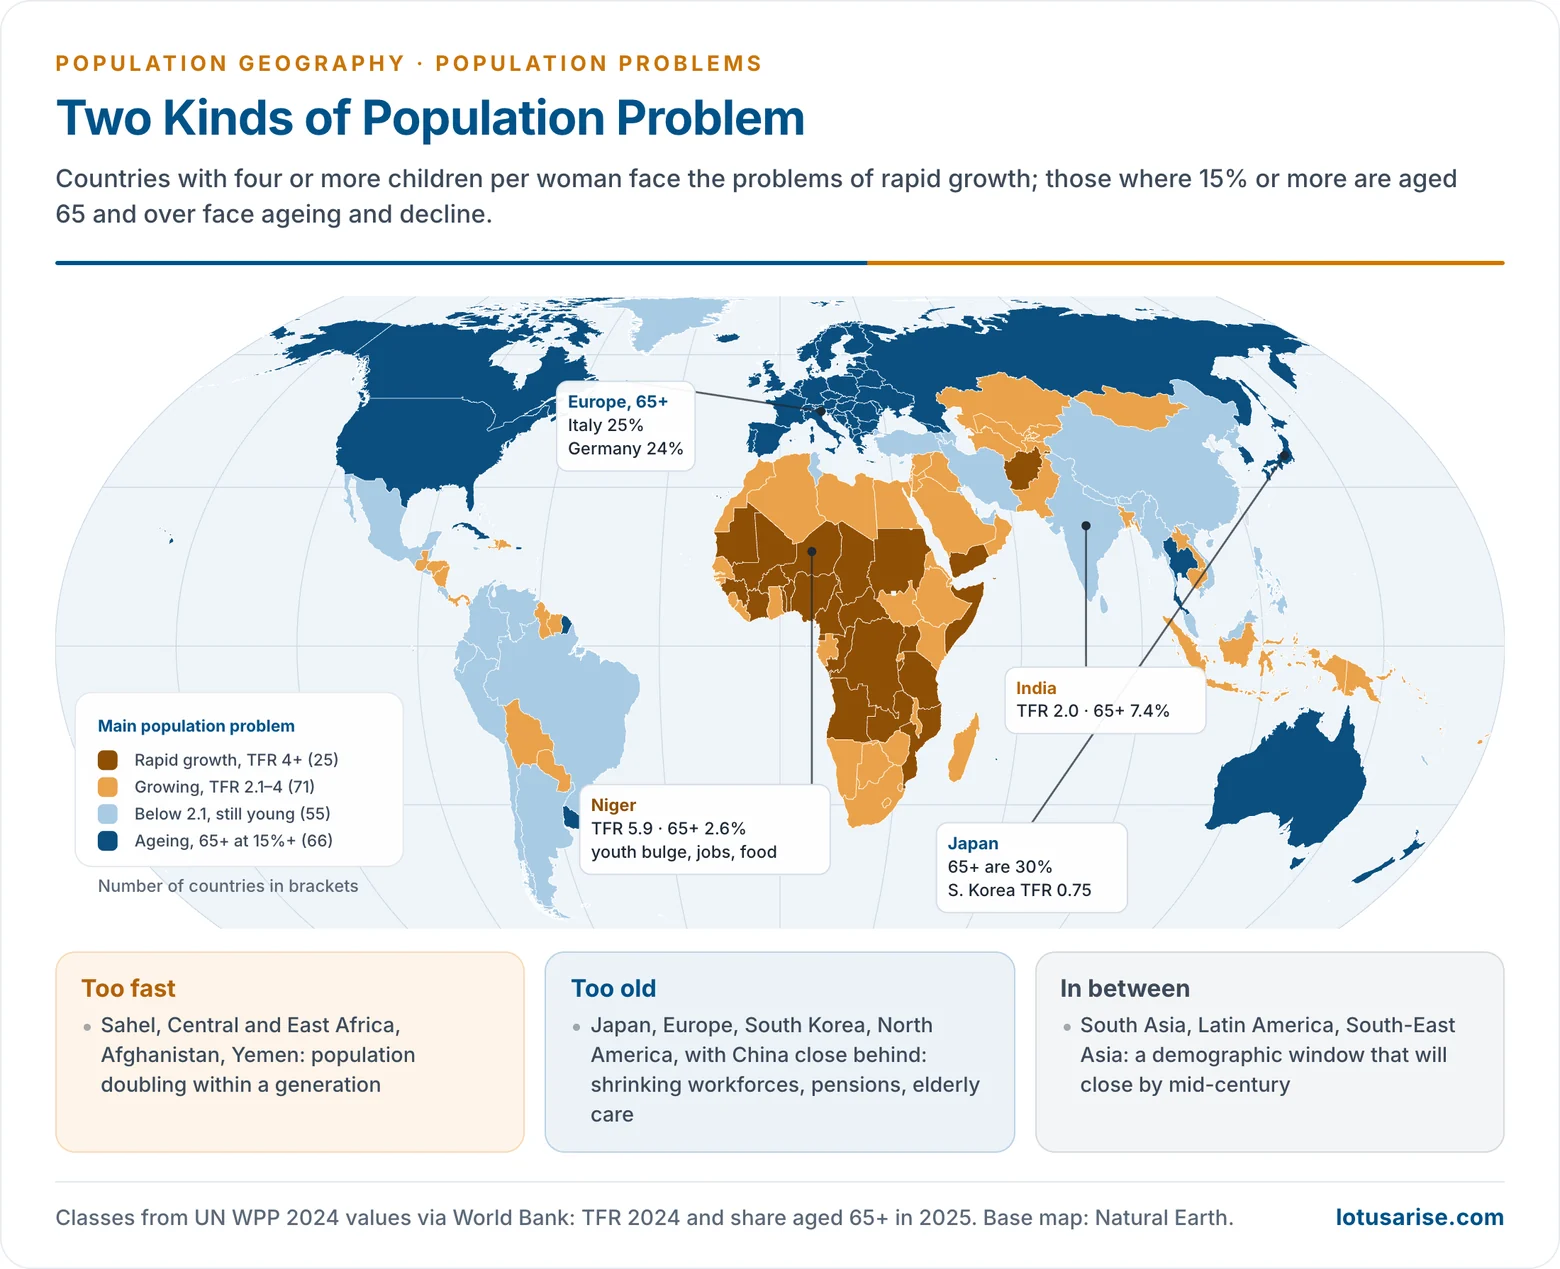
- A divided demographic landscape. The world reached 8.2 billion in 2024 and is projected to peak at about 10.3 billion in the mid-2080s (UN WPP 2024). Under this total, regions face opposite problems.
- Rapid growth:
- Sub-Saharan Africa (TFR 4.3), Afghanistan, Pakistan and Yemen still grow fast; in nine countries, mostly African, population is projected to double by 2054.
- Problems:
- a youth bulge without jobs;
- pressure on schools, health care and food and water;
- slums, environmental degradation;
- conflict and emigration.
- Ageing and decline:
- The population has already peaked in 63 countries, including China, Germany, Japan and Russia. Japan has 30% of its people aged 65+, Italy 25%.
- Problems:
- shrinking labour forces;
- rising pension and health costs;
- rural depopulation;
- dependence on immigration.
- By the late 2070s, people aged 65+ are projected to outnumber children under 18 worldwide (UN WPP 2024).
- Very low fertility: 66 countries had a TFR below 1.5 in 2024, and South Korea (0.75) the world’s lowest. These are mostly East Asian and European. The trend is traced under population ageing.
- Urban pressure: 58% of humanity is urban (2025), and about 1.1 billion people live in slums or informal settlements (UN-Habitat), mainly in South Asia and Africa.
- Food, water and health:
- Hunger still affects about 670 million people (FAO, 2024).
- About two billion people lack safely managed drinking water (WHO and UNICEF).
- Pandemics, antimicrobial resistance and the rise of chronic disease strain health systems.
- Migration and refugee crises:
- The world has about 304 million international migrants (UN DESA 2024).
- Over 120 million people are forcibly displaced (UNHCR, 2025): Syria, Sudan, Ukraine, Afghanistan, Myanmar and Gaza.
- These flows link the young, poor South with the ageing North, as discussed under world migration.
- Resource and environmental stress: population is one multiplier of consumption, emissions and land use. This is the old Malthusian and neo-Malthusian concern, though consumption per head in rich countries matters at least as much.
- The global path of growth is traced under growth of world population.
India’s Population Problems
- Size and momentum:
- India has been the most populous country since 2023, with about 1.46 billion people in 2025 (UN WPP 2024).
- Although fertility is below replacement, momentum will keep it growing until the early 2060s, to about 1.7 billion. Its course is traced under population growth in India.
- With 2.4% of the world’s land and about 18% of its people, pressure on land, water and forests is acute.
- Regional imbalance:
- The north-central states (Bihar 2.9, Uttar Pradesh 2.6) still have above-replacement fertility, while the south and west are below 1.5 and ageing.
- This divergence drives north-to-south labour migration and bears on the delimitation of parliamentary seats.
- The demographic dividend and jobs:
- About 68% of Indians are aged 15–64. The dividend depends on creating jobs, skills and health for them.
- Youth unemployment and low female work participation (41.7% in 2023–24) limit it.
- Ageing: people aged 60+ were 12.9% of the household population in NFHS-6. The India Ageing Report 2023 projects them to double to about 20% by 2050, with feminisation of old age and weak pension cover.
- Health and nutrition: stunting (29.3%), wasting (19.0%), anaemia, the rising burden of diabetes and heart disease, low public health spending and high out-of-pocket costs.
- Gender imbalance:
- A sex ratio at birth of 918 (SRS 2022–24), the legacy of son preference;
- 20.1% of women aged 20–24 married before 18 (NFHS-6);
- low female employment.
- Urbanisation and slums: cities grew faster than housing, water and transport. Census 2011 counted 65.5 million slum dwellers, and the urban share is now about 35%.
- Literacy and skills: literacy was 74% in 2011, with wide gender and regional gaps; the quality of schooling limits productivity.
- Data gap: the Census, due in 2021, will count the population only with reference to 1 March 2027, so planning still rests on 2011 counts, SRS samples and NFHS surveys.
- Population and food security:
- Grain output has kept ahead of population since the Green Revolution, passing 330 million tonnes in 2023–24, so the old fear of a population explosion outrunning food has not come true.
- The problem has moved from food security to nutrition security: protein and micronutrient-poor diets, dependence on imported pulses and edible oils, and falling groundwater in the grain belt of Punjab and Haryana.
- India’s population problem regions:
- The north-central high-growth belt (Bihar, Uttar Pradesh, Madhya Pradesh, Rajasthan, Jharkhand): high fertility, poor health and nutrition, out-migration.
- The low-fertility south and west (Kerala, Tamil Nadu, Andhra Pradesh, Maharashtra): early ageing, labour shortages, in-migration.
- The metropolitan regions: crowding, slums, pollution and pressure on water and transport.
- The Himalayan hills and the north-east: out-migration of the young, ageing villages, and difficult access to health care.
- Tribal and forest districts of central India: the worst child nutrition and maternal health.
- Each needs its own mix of family planning, health, employment and migration policy.
- Health-system responses: Ayushman Bharat (2018), with about 1.75 lakh Ayushman Arogya Mandirs (health and wellness centres) for primary care and PM-JAY hospital insurance for poorer families; the Ayushman Bharat Digital Mission (2021); and the National Health Mission’s focus on the high-priority districts.
- Responses:
- the National Population Policy 2000 and the National Health Policy 2017, set out under population policy of India;
- health and nutrition missions, skilling and urban missions;
- a shift from population control to population as a resource, the idea of population as social capital.
Previous Year Questions
1987Discuss the population problem of India in regional perspective and make specific suggestions for tackling the problem with respect to the broad population regions.2006Write an essay on the population explosion and food security in India.2019Define stunting and wasting. Why are these more prevalent among children in developing countries?2020Stunting and wasting among children are major consequences of food insecurity. Discuss various schemes of Government of India to address these problems and their achievements.2023Describe the regional variations of health indicators among the Indian States.2023Discuss critically food and nutrition problems associated with the developing world.2025“The global demographic landscape is evolving with rapid population growth in some places and rapid ageing in others.” Elucidate with examples.




