

- Köppen’s classification is the most widely used empirical, quantitative scheme of world climates: it groups places by critical values of monthly temperature and precipitation that match the limits of major vegetation zones.
- It was devised by Wladimir Köppen (1846–1940), a St Petersburg-born German climatologist and botanist (the name is said roughly as “kur-pin”), first around 1900, revised in 1918 and 1931 and finalised in 1936; Rudolf Geiger revised it in 1954 and 1961, hence Köppen–Geiger.
- It is a descriptive scheme, the opposite of a genetic scheme built on causes such as air masses and circulation.
- His aim was a chart of formulas and notations whose climatic boundaries would match the existing vegetation, so he read the climate of a region from its plants and selected values of temperature and rain to fit.
- He is also among the scholars who read the monsoon as a land and sea breeze on a large scale (1923).
Basis of the Scheme
- Weather and climate are the two terms the scheme rests on:
| Basis | Climate | Weather |
|---|---|---|
| Meaning | Average conditions expected at a place over a long period | Atmospheric state at a place at a point in time |
| Components | Rain, temperature, humidity, sunshine, wind, fog, frost and hail over a long period | Sunshine, rain, cloud, wind, hail, snow, sleet, floods, blizzards, heat waves |
| Time span | Long; statistics over 30 years (“climate normals”) | Short; minutes to weeks |
| Measured by | Aggregates of weather statistics | Real-time pressure, temperature, wind, humidity, rain and cloud |
| Generated by | Climate system: atmosphere, hydrosphere, cryosphere, land surface, biosphere | Day-to-day state of the atmosphere |
| Studied in | Climatology | Meteorology |
- Vegetation as the meter of climate: Köppen adopted the five plant groups of Alphonse de Candolle (1874) and drew climatic boundaries where vegetation changes.
- Megatherms → A, xerophytes → B, mesotherms → C, microtherms → D, hekistotherms → E.
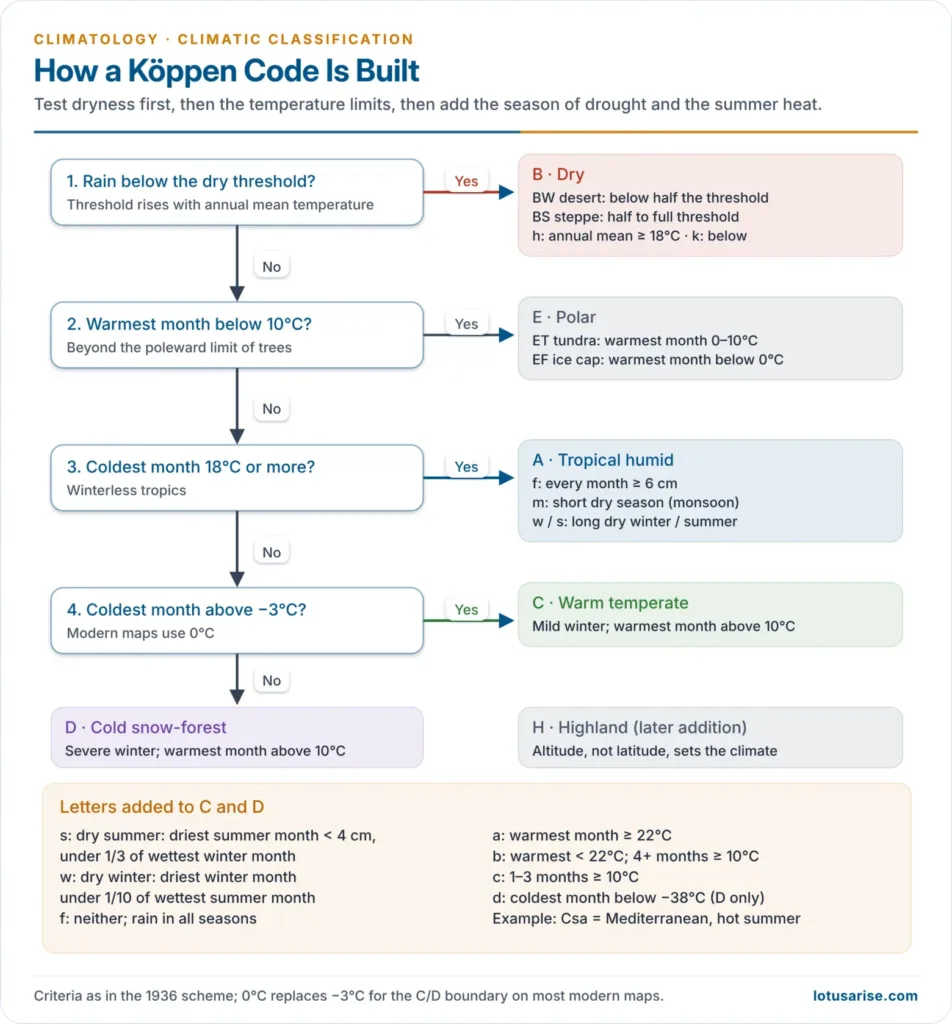
- Critical values: mean temperature of the coldest and warmest months, and annual and seasonal precipitation.
- The 18°C coldest-month isotherm limits winterless tropical plants; the 10°C warmest-month isotherm is the poleward limit of trees.
- Effective precipitation: the dry boundary rises with temperature, because warmer air evaporates more.
- The same rain counts for less in a hot, dry climate than in a cool, humid one, as much of it is lost to evaporation and transpiration.
- Shorthand code: capital letters for groups, small letters for drought season and heat, so a code such as Csa or BWh describes a climate.
The Letter Scheme
Main Groups
| Group | Criterion | Vegetation |
|---|---|---|
| A Tropical humid | Coldest month ≥ 18°C | Rainforest, savanna |
| B Dry | Rainfall below a temperature-linked threshold | Desert, steppe |
| C Warm temperate | Coldest month 18°C to −3°C; warmest > 10°C | Broadleaf forest |
| D Cold snow-forest | Coldest month ≤ −3°C; warmest > 10°C | Boreal forest |
| E Polar | Warmest month < 10°C | Tundra, ice |
- Four groups are thermal; B alone is defined by moisture. A, C, D and E mark humid climates and B dry ones. The modified system has five groups with 14 individual types, plus highland.
- H (highland) was added later by others for mountains.
- Modern maps use 0°C instead of −3°C for the C/D boundary.
The Dry Boundary
- With R = annual rainfall (cm) and T = annual mean (°C), a place is dry when:
- R < 2(T + 14) if 70% or more of rain falls in the warm half-year;
- R < 2T if 70% or more falls in the cool half-year;
- R < 2(T + 7) otherwise.
- BW (desert) lies below half this limit; BS (steppe) between half and the full limit.
- h = annual mean ≥ 18°C; k = below 18°C.
- S and W mark the two dry subdivisions, semi-arid steppe and arid desert. T and F mark the two polar ones, tundra and icecap.
Second and Third Letters
| Letter | Meaning | Criterion |
|---|---|---|
| f | No dry season | Fails s and w |
| m | Monsoon, short dry season | Driest month < 6 cm but ≥ 10 − R/25 cm |
| w | Dry winter | Driest winter month < 1/10 of wettest summer month |
| s | Dry summer | Driest summer month < 4 cm and < 1/3 of wettest winter month |
| a | Hot summer | Warmest month ≥ 22°C |
| b | Warm summer | Warmest < 22°C; 4+ months ≥ 10°C |
| c | Cool summer | 1–3 months ≥ 10°C |
| d | Very cold winter | Coldest month < −38°C |
| T / F | Tundra / ice cap | Warmest month 0–10°C / below 0°C |
- Af needs every month ≥ 6 cm; extra letters include g (Ganges type: hottest month before the June solstice), i (annual range < 5°C) and n (frequent fog).
- Letter h comes from the German heiss, meaning hot. It marks an annual mean of 18°C or more.
- For C and D, the older shorthand gives a for warmest month over 22°C and c for under 22°C, with g, w, s, f and m as above.
The Climate Groups
A: Tropical Moist Climates
- Found about 15°–25° north and south of the equator, with every month above 18°C and yearly rain usually above 1,500 mm. Most carry dense tropical forest.
- Af (tropical wet): rain all year, monthly temperatures varying by under about 3°C. High humidity and heat build cumulus and cumulonimbus by early afternoon.
- Am (tropical monsoon): yearly rain close to Af, but most of it falls in the 7–9 warmest months.
- Aw (savanna): a long dry winter, with rain in summer, usually under 1,000 mm in the wet season.
B: Dry Climates
- Found about 20°–35° from the equator and in continental interiors ringed by mountains. Evaporation and transpiration exceed precipitation, so moisture matters more than temperature.
- BW (arid desert): about 12% of the land, with xerophytic plants.
- BS (semi-arid steppe): grassland on about 14% of the land, with more rain from mid-latitude cyclones or the ITCZ.
- The suffixes h and k place them in the subtropics or the mid-latitudes.
C: Moist Subtropical Mid-Latitude Climates
- Found about 30°–50°, at the eastern and western sides of continents, with warm, humid summers and mild winters. Summers bring convective storms and winters mid-latitude cyclones.
- Cfa (humid subtropical): hot, humid summers with frequent thunderstorms, as in the south-eastern USA.
- Cfb (marine west coast): mild summers and winters on western coasts, with heavy winter rain from mid-latitude cyclones.
- Cs (Mediterranean): rain mainly in mild winters from mid-latitude cyclones, with very scanty summer rain, as in California and around Portland, Oregon.
D: Moist Continental Mid-Latitude Climates
- Found poleward of C, with warmest months above 10°C and coldest below −3°C. Winters are bitter, with snowstorms and strong winds from continental polar and Arctic air.
- Three types: Dw with dry winters, Ds with dry summers and Df with rain all year.
E: Polar Climates
- Low temperatures all year, the warmest month under 10°C, on the northern coasts of Asia, Europe and North America, Greenland and Antarctica.
- ET (tundra): permafrost hundreds of metres deep, with dwarf trees, woody shrubs, lichens and mosses.
- EF (ice cap): a surface permanently under ice or snow.
Distribution of Köppen’s Climates
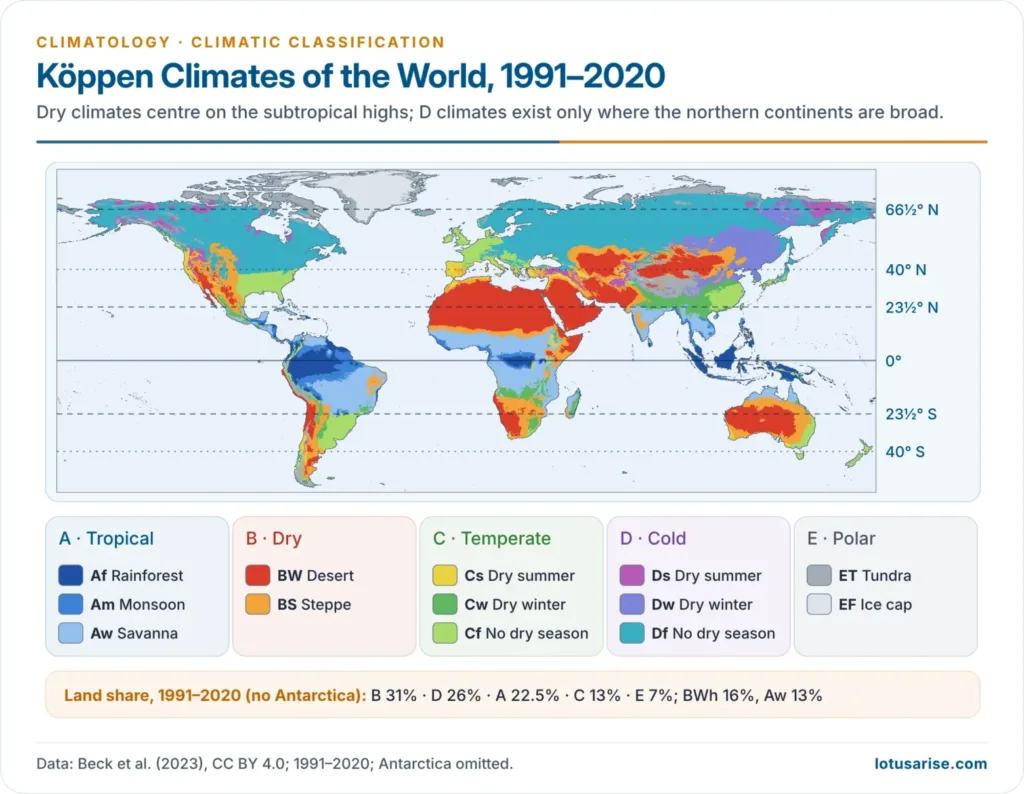
- A astride the equator; B centred on the subtropical highs (15°–35°) and continental interiors; C on mid-latitude margins; D only in the Northern Hemisphere, as no large land lies at 50°–70° S; E poleward of the 10°C summer isotherm.
- Margins differ: Cs on west coasts at 30°–40°, Cfa/Cwa on east coasts, Cfb on west coasts at 45°–60°.
- Land shares outside Antarctica, 1991–2020: B 31%, D 26%, A 22.5%, C 13%, E 7%; BWh (16%) and Aw (13%) are the largest types.
India under Köppen
| Type | Character | Region | Yearly rain |
|---|---|---|---|
| Amw | Monsoon, short dry winter | West coast south of Mumbai, wettest south of Goa; Andaman and Nicobar | Over 300 cm |
| As | Monsoon, dry high-sun season | Coromandel coast of Tamil Nadu and adjoining Andhra Pradesh (winter rain) | 75–100 cm |
| Aw | Tropical savanna | Most of the Peninsular plateau, north to about the Tropic of Cancer | About 75 cm |
| BShw | Semi-arid steppe | Rain-shadow interior, north-west Gujarat, parts of Rajasthan, Haryana and Punjab | 12–25 cm |
| BWhw | Hot desert | Western Rajasthan | Under 12 cm |
| Cwg | Monsoon, dry winter, Ganges type | Ganga plain, eastern Rajasthan, north Madhya Pradesh and Malwa, most of the North-east | Summer rain |
| Dfc | Cold, humid winter, short summer | Sikkim, Arunachal Pradesh, parts of Assam | Humid |
| Et | Tundra | Mountains of Uttarakhand | Snow and rain |
| E | Polar | High Himalaya and Ladakh, high Jammu and Kashmir, Himachal Pradesh | Mostly snow |
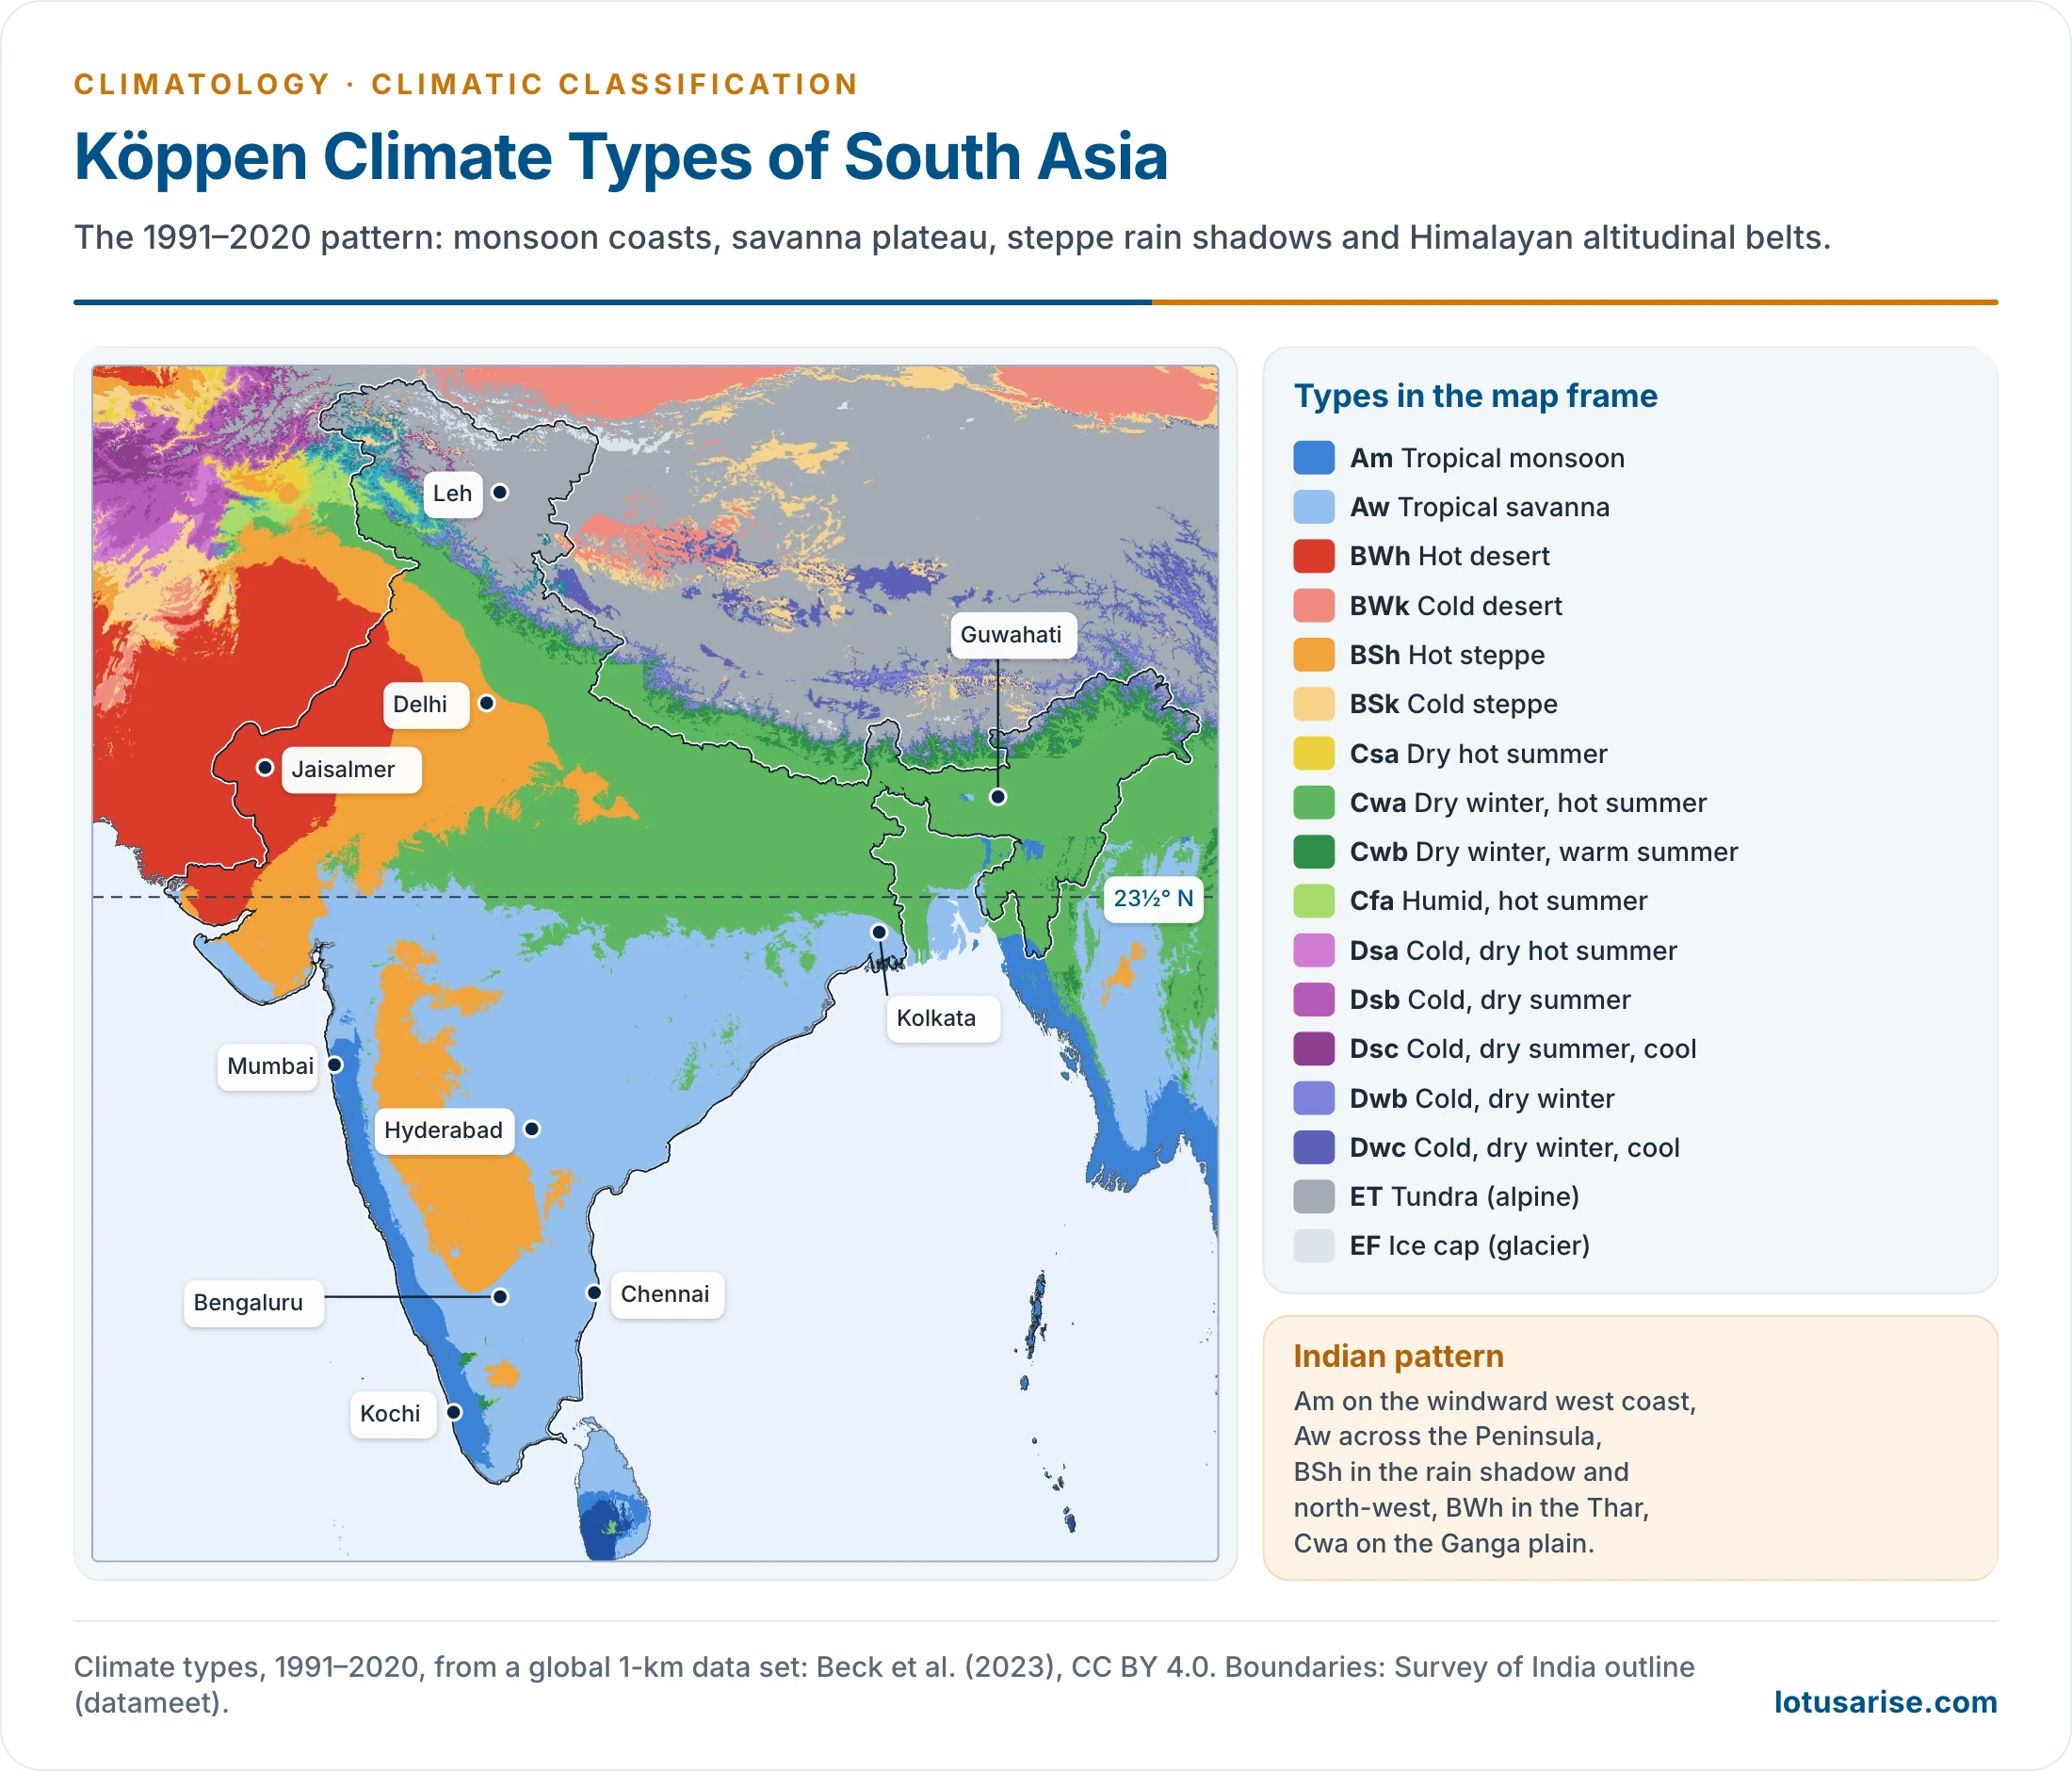
- On this scheme India’s climatic regions number nine.
- Ganges type (g): the hottest month comes before the June solstice and the summer rain, the signature of the northern plains. The “As” of the Coromandel coast is unusual, with rain from retreating monsoon winds in October–December.
- On 1991–2020 normals, Delhi and Jaipur fall in BSh, Ladakh is cold steppe (BSk), and the Nilgiri and Munnar highlands are Cwb.
- The w and m letters capture the rhythm of the Indian monsoon, but not its onset, breaks or variability.
- As a scheme for India: it suits worldwide comparison but uses no direct measure of evaporation, and fixed limits sit poorly on a monsoon country with sharp relief.
- Laurence Dudley Stamp built his regions on Indian rainfall and temperature directly, while Trewartha and Thornthwaite applied their own world schemes to India.
- The 1991–2020 map above is cut from a global 1-km data set.
Evaluation
Merits
- Simple and objective: temperature and rainfall are recorded everywhere, so any station can be coded.
- Boundaries are vegetation lines, giving the map visible reality.
- Recognises effective precipitation, linking heat and moisture.
- International shorthand, still the base of ecological and climate-change mapping.
Limitations and Anomalies
- Empirical, not genetic: built on observed values, it ignores causes such as air masses, fronts and circulation; this gap led to the Trewartha classification.
- Means only: too much weight on average values. It ignores rain intensity, rainy days, cloud, wind and daily extremes, which also makes one locality harder to compare with another.
- Evaporation guessed, not measured: the Thornthwaite classification replaced the formula with potential evapotranspiration.
- Anomalies:
- C is too broad, joining Florida with western Norway.
- Sharp lines stand for gradual transitions.
- Vegetation is not purely climatic: soils, fire and clearing shift it.
- Highlands are coarsely handled.
Modern Updates
- Markus Kottek and colleagues (2006) and Murray Peel and colleagues (2007) redrew the world map from modern station data.
- Hylke Beck and colleagues produced 1-km maps for 1980–2016 and 2071–2100 (2018), then for 1901–2099 under CMIP6 scenarios (2023).
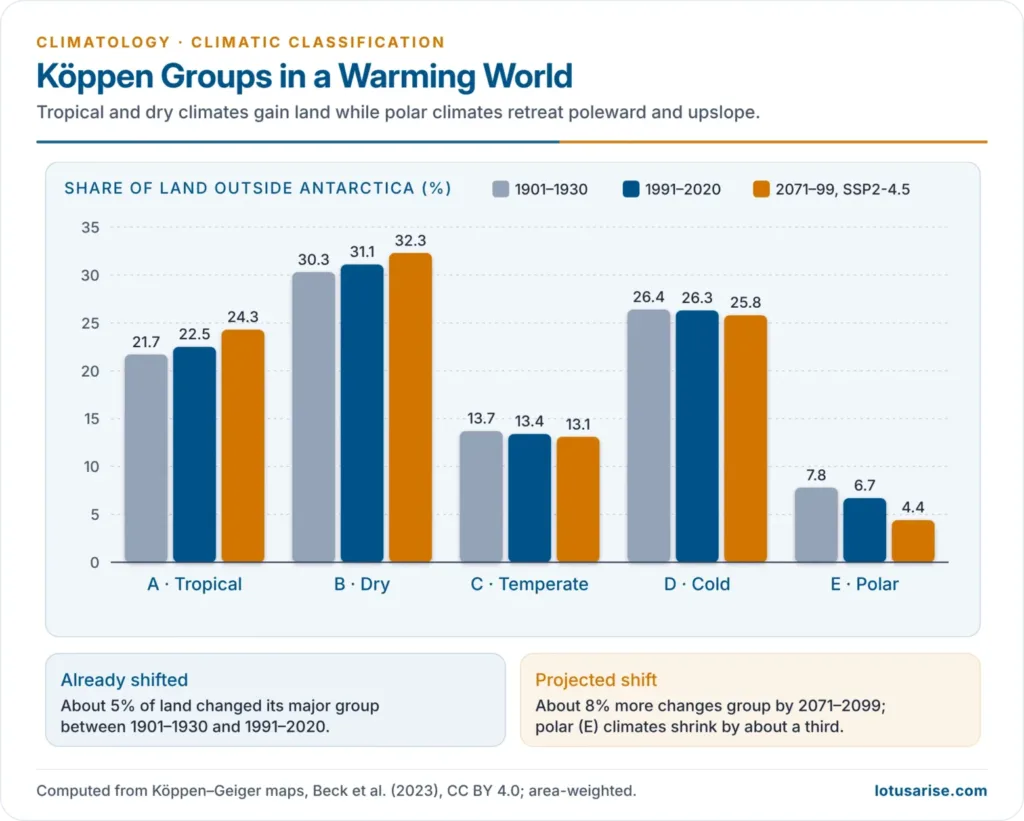
- About 5% of land changed its major group between 1901–1930 and 1991–2020.
- Under SSP2-4.5, E shrinks by about a third by 2071–2099 while A and B expand.
- Köppen boundaries are now tracked as an index of warming.
Previous Year Questions
2024Describe the latitudinal distribution of Köppen’s classification of world climate.2015Discuss the basis of Köppen’s climatic classification. Bring out the salient characteristics of the ‘Cs’ type of climate.2005Discuss the main features of the climatic classification system evolved by Koppen. Also point out its anomalies.1999Write short note: Cs type of climate, as per Koppen’s classification1996Examine critically the drawbacks of Koppen’s Classification of climates. Explain how Thornthwaite attempted to overcome Koppen’s limitations.1994Explain the basis of Koppen’s classification of climates. Also mention its merits and limitations.1988Evaluate the Koppen’s scheme of climatic regionalisation of India.1986Compare the basis of the climatic classification of Koppen with that of Thornthwaite’s classification.





I teach a biogeography course and always go through the Koeppen and Holdridge classification systems. I like the explanations of the Koeppen climate types and the figures and tables. Very nice. I was hoping to see (maybe I missed it?) the variables t and r and the equations used to infer a climate type. I do have the equations, but was interested to see your explanations and usage. Nonetheless, a great site.
Thanks Brian
Since a long time I’m looking for an upsc geography notes on other platforms but now I found geography notes for upsc here and now I would start my preparation..
Sir/ma’am I just want to know when will the remaining lecture be uploaded of climatology…
Soon
How long will it take to upload the remaining lecture?please upload as soon as possible because this is the only platform from where I’m preparing my geography for my upcoming examinations..
And Thank you soo much for your this hard efforts for notes.
wonderful explaination
Indian map is inaccurate.
Thanx so much for these mind-blowing notes
great content.. but please use a proper Indian map..
wonderful Explanation