

- Temperature is the degree of hotness of a body, the measure of the average kinetic energy of its molecules. Heat is the total energy those molecules hold, and insolation is the solar energy that supplies it.
- Two places can receive the same insolation and still differ in temperature, because land, water, cloud and wind treat that energy differently.
- The atmosphere is heated mainly from below: the ground absorbs short-wave insolation and passes it on as long-wave terrestrial radiation, conduction, convection and latent heat. Together these processes make up the heat budget of the earth.
- Temperature therefore varies horizontally (with latitude, land and sea, currents and relief), vertically (with height) and in time (through the day and the year). Its distribution divides the globe into temperature (heat) belts.
Controls of Temperature
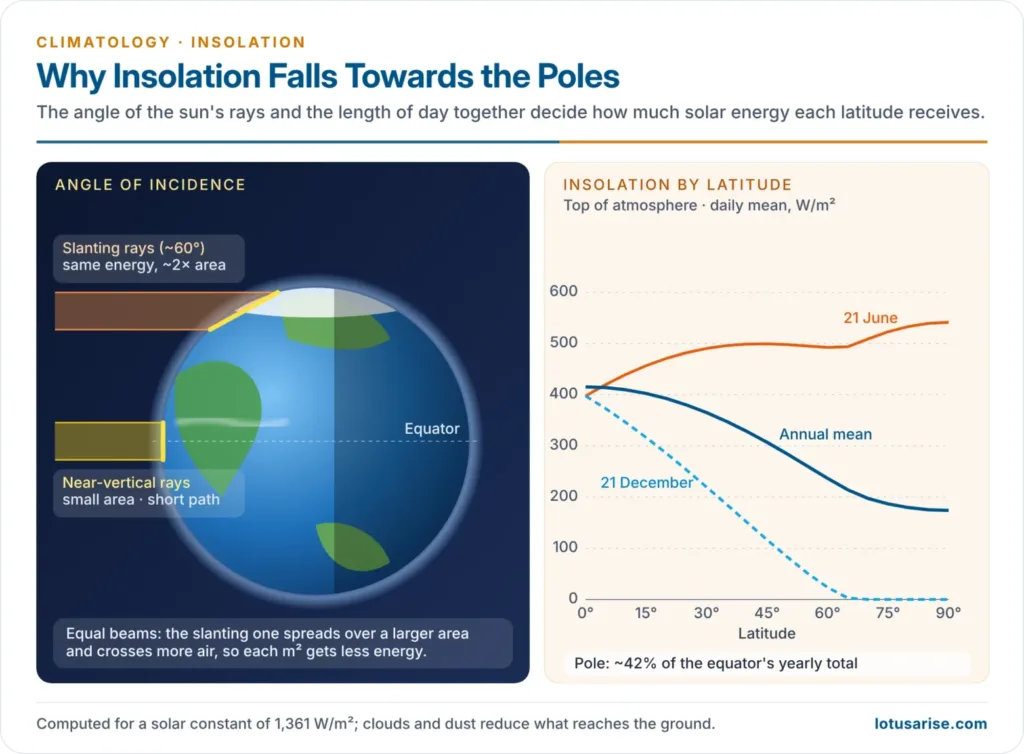
- Latitude is the master control:
- Angle of the sun’s rays: near-vertical rays concentrate energy on a small area and cross a short path through the air; slanting rays spread it over a larger area and lose more on a longer path.
- Length of day: fixed at 12 hours at the equator, it varies more and more with season towards the poles.
- Mean annual temperature therefore falls poleward, and isotherms on a world map run broadly east–west.
- Altitude:
- Temperature falls with height at the normal lapse rate of about 6.5 °C per km, because the air is heated from the ground and the denser lower air holds more water vapour, dust and CO₂ to absorb terrestrial radiation.
- Mount Kenya and Kilimanjaro carry ice near the equator; Shimla, Mussoorie and Ooty are hill stations for the same reason.
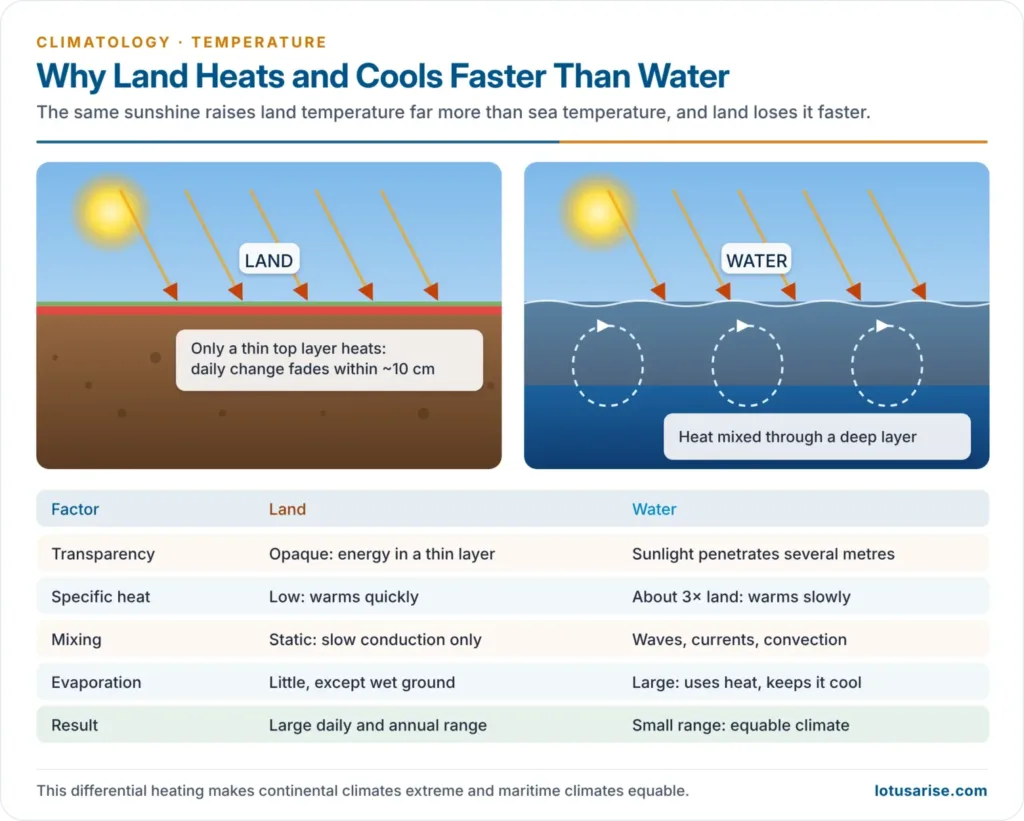
- Distribution of land and water (differential heating):
- Transparency: sunlight penetrates water to several metres but heats only a thin layer of opaque soil and rock.
- Specific heat: water needs about three times as much heat as land to warm by 1 °C, and gives out as much more on cooling.
- Mobility: waves, currents and convection mix the heat through a deep water layer, while land passes heat downward only by slow conduction; daily changes in soil temperature fade within about 10 cm.
- Evaporation: water surfaces spend more energy evaporating, which keeps them cooler in summer.
- Result: land heats and cools faster and further than the sea, giving continental (extreme) and maritime (equable) climates.
- Ocean currents:
- Warm currents raise coastal temperatures, most in winter: the North Atlantic Drift keeps the ports of Norway ice-free, and London (51° N) has a January mean about 5 °C higher than New York (41° N).
- Cold currents lower them, most in the tropics and in summer: Walvis Bay (23° S) beside the Benguela Current is cooler than Durban, about 7° further poleward on the warm Agulhas side.
- Prevailing winds decide whether the oceans can act on the land:
- Onshore winds carry the sea’s moderating effect inland (the westerlies over western Europe).
- Offshore winds deny it, so the east coasts of the continents in middle latitudes are colder in winter than the west coasts.
- Föhn (Alps) and Chinook (Rockies) winds warm leeward slopes by compression as they descend.
- Cloud cover and humidity:
- Clouds cut daytime heating and trap night-time radiation; this is why subtropical deserts are hotter by day than the cloudy equatorial belt, and cooler by night.
- Humid air keeps nights warm; dry air lets them turn cold.
- Mountain barriers: the Rockies and Andes stop oceanic air from penetrating inland; the Himalaya shield the Indian subcontinent from the cold winter air of Central Asia, keeping north India far warmer in winter than places at the same latitude in China.
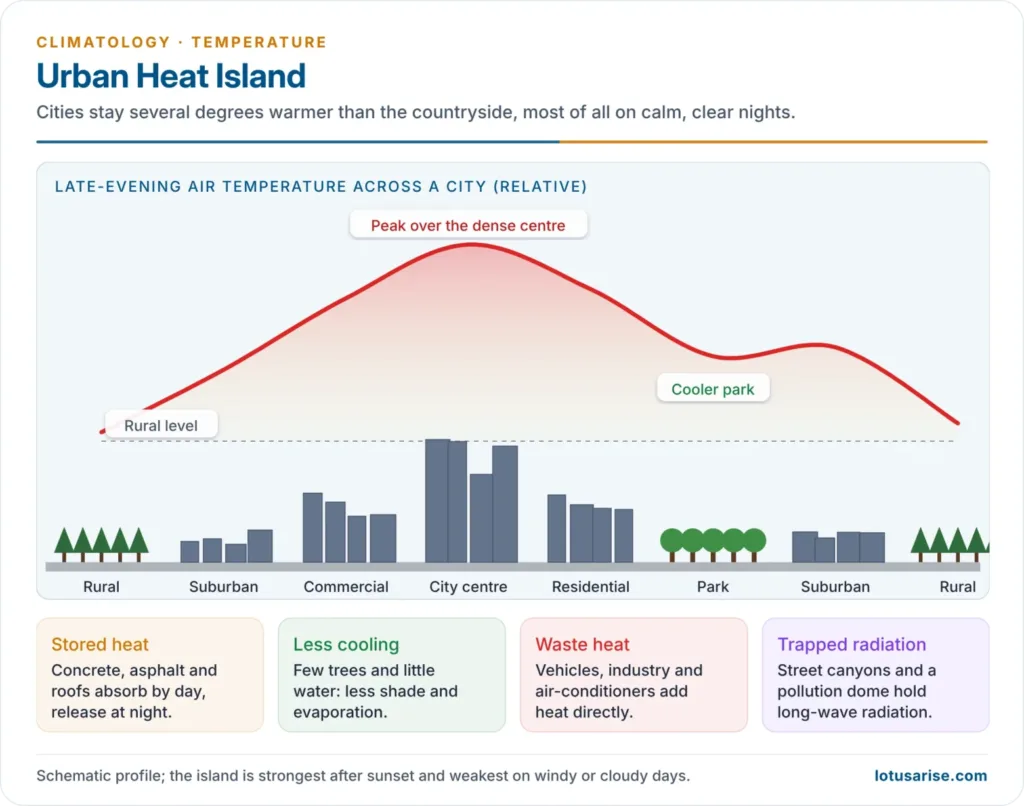
- Nature of the surface:
- Snow and ice reflect most insolation (high albedo), so snowfields stay cold even in sunshine; forests shade the ground and keep it cool.
- Concrete and asphalt store heat by day and release it at night, so cities form urban heat islands that stay several degrees warmer than the countryside, especially at night.
- Relief and aspect:
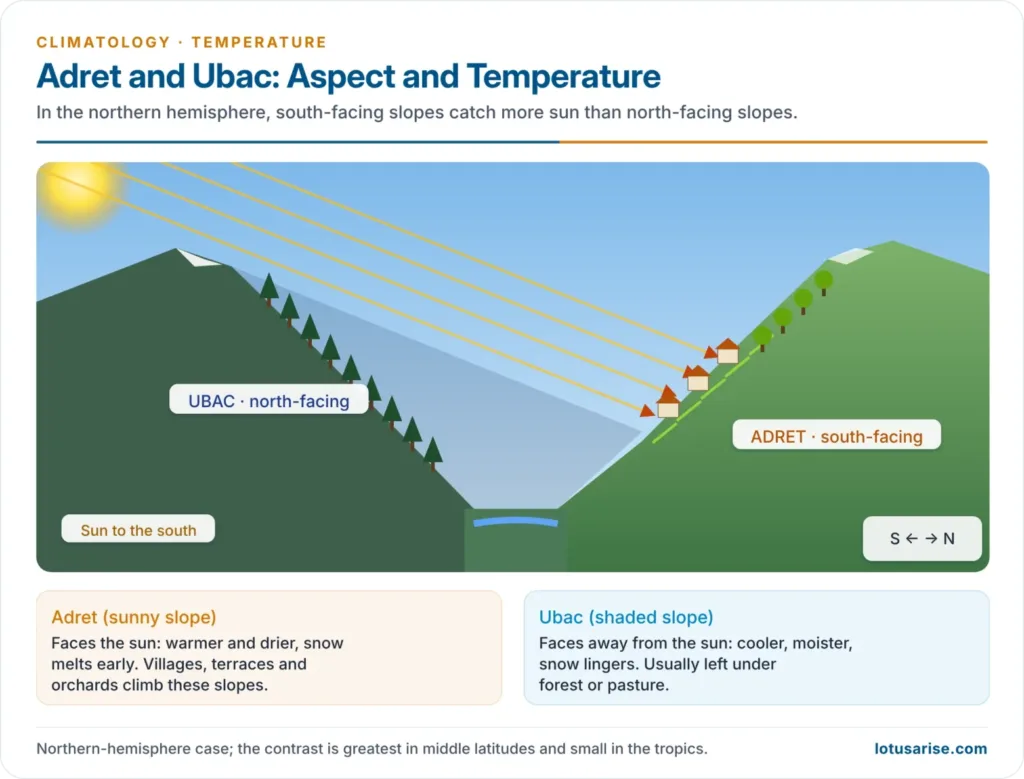
- In the northern hemisphere, south-facing (adret) slopes receive more sunshine and are warmer than north-facing (ubac) slopes; the contrast is small in the tropics, where the noon sun is high.
- In Himalayan valleys, settlements, orchards and terraced fields cluster on the sunny slopes, while the shaded slopes keep forest.
- Insolation-side controls:
- Earth–sun distance: the earth receives about 7% more insolation at perihelion (about 3 January, 147 million km) than at aphelion (about 4 July, 152 million km), but land–sea contrast and circulation mask the effect.
- Solar output: sunspot activity follows an 11-year cycle, and total solar output changes by only about 0.1% over it.
- Transparency of the atmosphere: dust, smoke, water vapour and clouds scatter, reflect and absorb part of the beam.

Temperature (Heat) Zones of the Earth
Mathematical (Classical) Zones
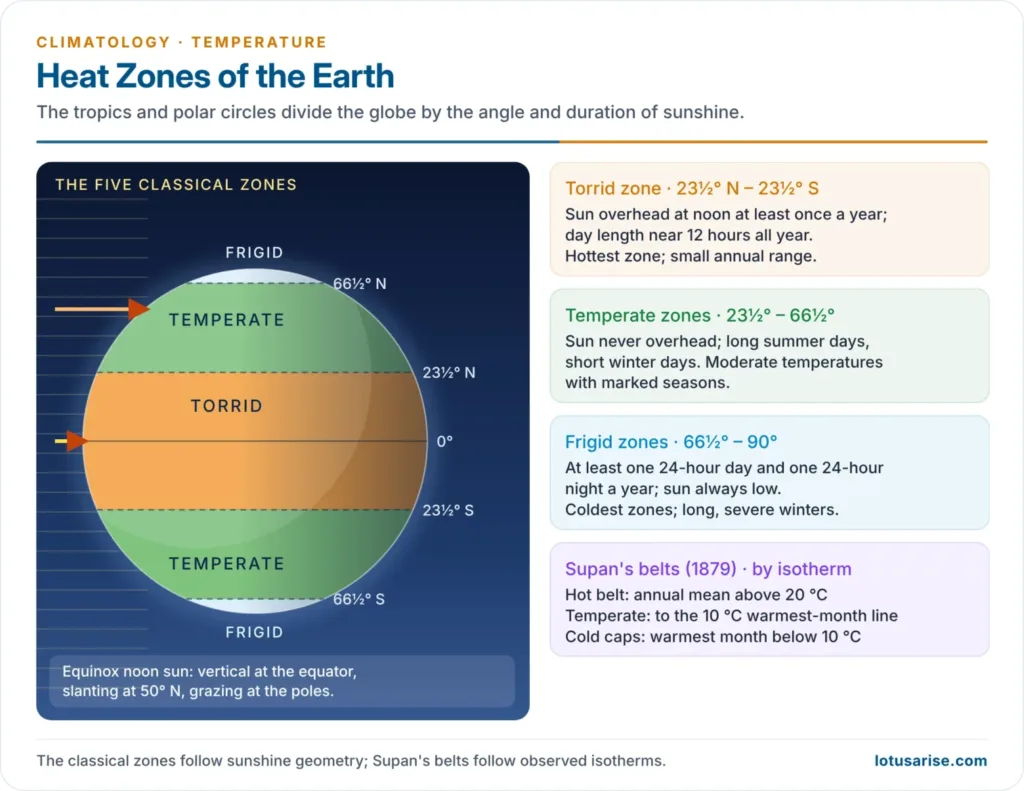
- Parmenides, and later Aristotle, divided the earth into five zones bounded by the tropics and the polar circles. The scheme is purely astronomical: it follows the angle and duration of sunshine, not observed temperature.
| Zone | Latitudes | Sun and daylight | Temperature character |
|---|---|---|---|
| Torrid (tropical) | 23½° N – 23½° S | Sun overhead at least once a year; day length near 12 hours | Hottest; small annual range |
| North and South Temperate | 23½° – 66½° in each hemisphere | Sun never overhead; days long in summer, short in winter | Moderate; marked seasons |
| North and South Frigid | 66½° – 90° in each hemisphere | At least one day of 24-hour daylight and one of 24-hour night | Coldest; long winters |
Climatic Temperature Belts (Supan, 1879)
- Real temperatures do not follow the parallels, so Alexander Supan (1879) drew the belts along isotherms:
- Hot belt: where the annual mean exceeds 20 °C. It bulges poleward over the continents and is pinched over cold currents.
- Temperate belts: from the 20 °C annual isotherm to the 10 °C isotherm of the warmest month.
- Cold caps: where even the warmest month stays below 10 °C.
- The 10 °C warmest-month line roughly marks the poleward limit of tree growth. Wladimir Köppen (1918) used the same value to separate polar from forest climates, so it is called the Köppen–Supan line.
Horizontal Distribution of Temperature
Isotherms
- Isotherms join places of equal temperature. On world maps, temperatures are reduced to sea level (adding about 6.5 °C per km of height) to remove the effect of altitude.
- A station at 2,000 m reading 20 °C is plotted as about 33 °C.
- Closely spaced isotherms show a steep temperature gradient; widely spaced ones a gentle gradient.
Mean Annual Distribution
- The highest temperatures lie over the tropics and subtropics; the lowest over the polar regions.
- Isotherms are widely spaced in the tropics (weak gradient) and crowded in middle and high latitudes, especially along the eastern margins of continents.
- Isotherms run broadly east–west, but are more irregular in the northern hemisphere, the “land hemisphere”; in the oceanic southern hemisphere they lie almost along the parallels.
- Warm currents bend isotherms poleward: the Gulf Stream and North Atlantic Drift, and the Kuroshio and North Pacific Drift.
- Cold currents bend them equatorward: the Labrador, Benguela, California and Peru (Humboldt) currents.
- In middle latitudes the western coasts of North America and Europe are warmer than the interiors, while in the tropics the western coasts of Africa, South America and Australia are cooler, beside cold currents.
- The northern hemisphere is warmer than the southern, so the thermal equator lies north of the geographical equator.
Seasonal Distribution: January and July
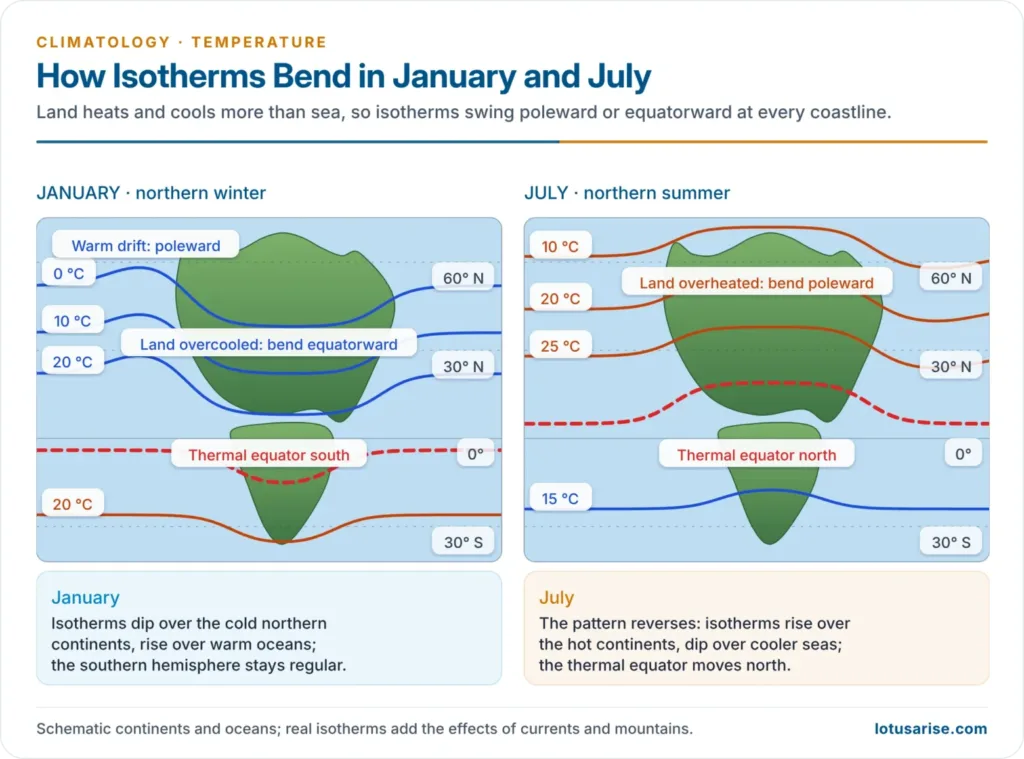
- January (northern winter):
- Over the northern continents, isotherms bend sharply equatorward: the land is overcooled and cold polar air penetrates far south.
- Over the northern oceans, they bend poleward: the sea is warmer than the land at the same latitude, most of all in the North Atlantic.
- The coldest places are north-eastern Siberia (around Verkhoyansk and Oymyakon) and interior Greenland.
- On the eastern sides of North America and Asia the gradient is about 1.5 °C per degree of latitude, three times that on the western sides.
- In the southern hemisphere (summer) isotherms are regular; the hottest belt lies over the continents near 30° S, and the thermal equator moves south of the equator.
- July (northern summer):
- The pattern reverses: over the northern continents isotherms bend poleward (the land is overheated), and over the oceans equatorward.
- A belt above 30 °C runs from the Sahara through Arabia and Iraq to north-west India and Pakistan, with another over the south-western United States.
- North-eastern Siberia loses its winter cold; the strongest land–sea contrast lies between the North Pacific and the surrounding land.
- The southern hemisphere (winter) has straight isotherms with a slight equatorward bend at the continental edges; the thermal equator moves north, over north India and the Sahel.
Thermal Equator
- The thermal (heat) equator joins, along each meridian, the places of highest mean temperature.
- It shifts with the overhead sun, far more over land than over sea, reaching about 20–25° N over South Asia and North Africa in July and swinging south over the southern continents in January.
- Its annual mean position lies about 5° N, because the northern hemisphere holds more land and heats more in its summer.
- It broadly matches the Inter-Tropical Convergence Zone (ITCZ), the equatorial trough among the pressure belts where the trade winds meet; its migration drives the monsoons.
Thermal Anomaly (Anomalous Temperature)
- Thermal anomaly is the difference between the mean temperature of a place and the mean temperature of its latitude (parallel). Lines joining places of equal anomaly are isanomals.
- Positive anomaly: warmer than the latitude average; negative anomaly: colder.
- January:
- The largest positive anomalies lie over the north-eastern Atlantic and the west coast of Europe, kept warm by the North Atlantic Drift and the westerlies: the Norwegian coast is about 25 °C warmer than its latitude average.
- The largest negative anomalies lie over north-eastern Siberia: Verkhoyansk is about 25 °C colder than its latitude average.
- July: the signs reverse; the northern continents are positive and the oceans negative.
- Annual pattern: continents show negative anomalies poleward of about 40° and positive ones equatorward of it. Anomalies are largest in the northern hemisphere and small in the oceanic south.
- India: the subcontinent is a winter positive anomaly for its latitude, because the Himalaya keep out Siberian air; Ladakh is a negative anomaly because of its height.
Annual Range of Temperature
- The annual range is the difference between the warmest and coldest monthly means. The extremes lag the solstices by a month or more, so January and July usually stand for them on land (later over the sea).
- Controls:
- Latitude: the range is negligible at the equator, where the noon sun never drops below 66½°, and grows poleward. It peaks in the sub-Arctic continental interiors, not at the poles, where the low sun and snowmelt keep summers cold.
- Distance from the sea (continentality): the range rises inland; this is the strongest control in middle latitudes.
- Prevailing winds and currents: onshore winds over warm currents narrow it (western Europe); offshore winds widen it.
- Altitude, cloud and rain: high places and cloudy, rainy places have smaller ranges.
- Slope: sun-facing slopes are warmer in summer, and shaded slopes colder in winter.
- Salient features:
- The range is lowest over the oceans and in the tropics, and highest over the interiors of the northern continents.
- Across Eurasia it increases from west to east.
- Verkhoyansk, the “cold pole” of the northern hemisphere, has an annual range of over 60 °C: January about −45 °C, July about +16 °C. It has recorded both about −68 °C and, in June 2020, 38.0 °C, the highest temperature measured north of the Arctic Circle.
- In the southern hemisphere, with little land beyond the Tropic of Capricorn, the range over the oceans is only about 5 °C.
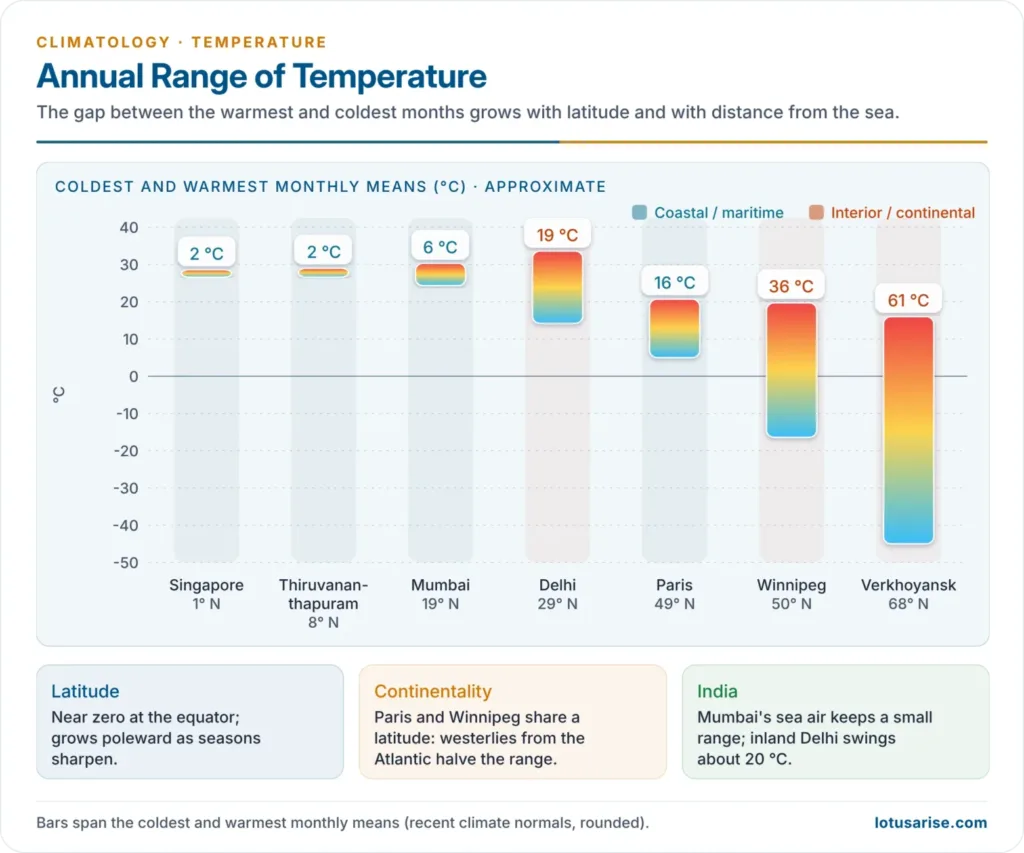
- Climatic significance: the annual range measures the thermal stress on people, plants and animals. Climates with a small range are called equable; India’s coastal cities (Mumbai, Chennai, Thiruvananthapuram) are equable, and Delhi, Ganganagar and Leh are extreme.
Daily (Diurnal) Range of Temperature
- The diurnal range is the difference between the day’s maximum and minimum temperatures.
- Daily march:
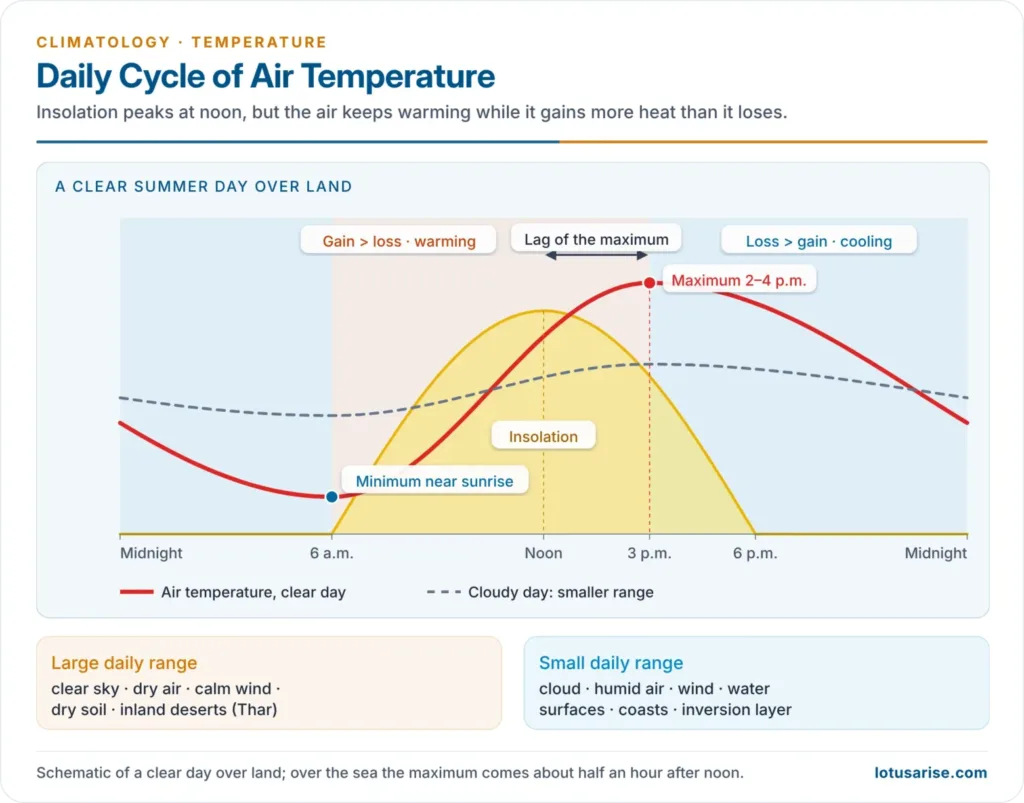
- Insolation peaks at noon, but the ground keeps gaining more heat than it loses until about 2–4 p.m., so the maximum lags the sun.
- The minimum comes about sunrise, after a night of net radiative loss.
- Over the oceans the maximum comes only about half an hour after noon.
- Periodic and non-periodic control: in the tropics the daily curve is sun-controlled; in middle and high latitudes, especially in winter, passing cyclones, cloud and wind often override the sun, so the maximum may even fall at night.
- Controls:
- Sky: a clear sky gives a large range; cloud a small one.
- Humidity: dry air gives a large range; humid air a small one.
- Surface: land has a large range, water a small one; dry soil more than wet soil.
- Wind: windy days mix the air and narrow the range.
- Stability: a low inversion layer slows night cooling and narrows the range.
- Latitude: the range is largest over tropical deserts. Near the equator on land the daily range exceeds the annual range, so night is “the winter of the tropics”.
- India: the Thar has daily ranges of 15–20 °C in summer, while coastal Kerala and Mumbai have a few degrees.
Vertical Distribution of Temperature
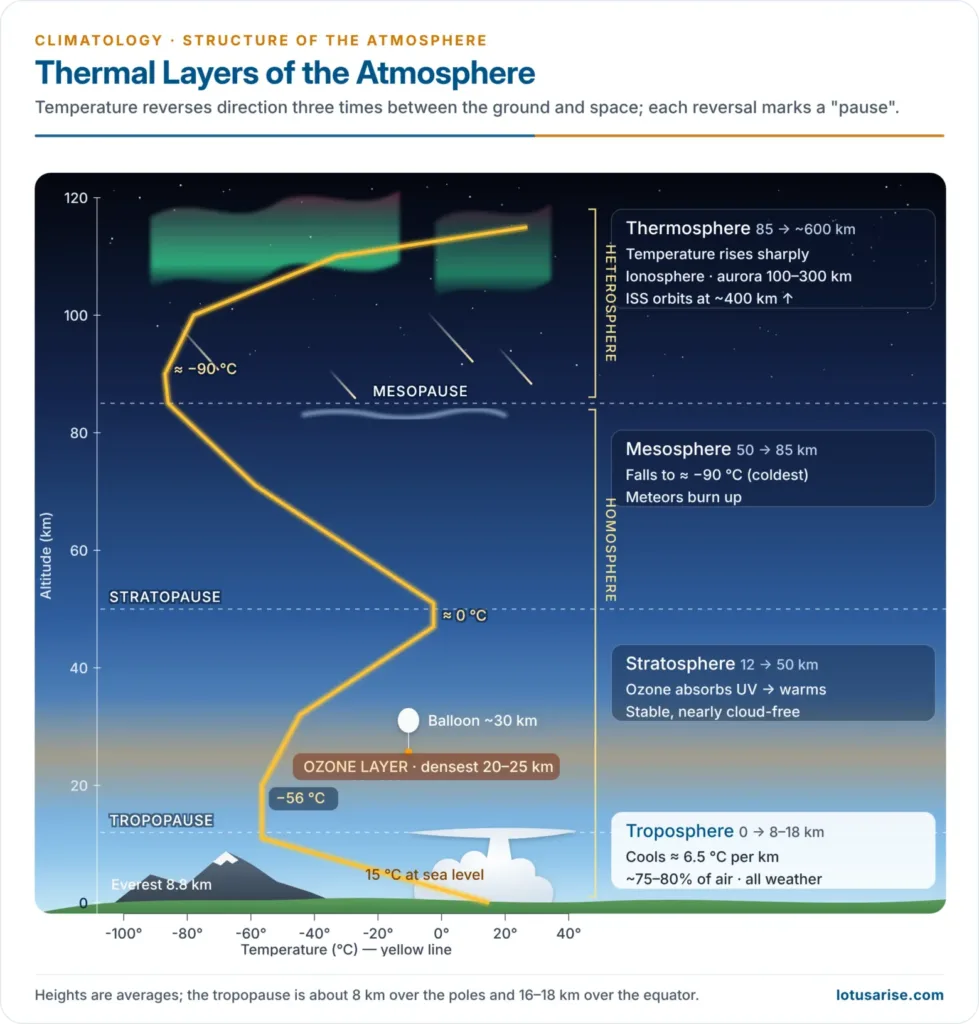
- In the troposphere, temperature falls with height at an average normal lapse rate of 6.5 °C per km; the actual (environmental) lapse rate varies with place, time and season.
- It is steep over land on summer afternoons and low on calm winter nights; it may even reverse in a temperature inversion.
- It is generally lower in winter than in summer, at night than by day, and over plateaus than over mountain slopes.
- The fall stops at the tropopause:
- about 16–18 km over the equator, at about −80 °C
- about 8–9 km over the poles, at about −50 °C
- In the lower stratosphere temperature first stays nearly constant and then rises with height. At the same height it increases from the equator towards the poles in summer, because the stratosphere begins lower there.
Temperature Extremes and the Warming Trend
| Record | Value | Place and date |
|---|---|---|
| World’s highest | 56.7 °C | Furnace Creek (Death Valley), USA, 10 July 1913 |
| World’s lowest | −89.2 °C | Vostok, Antarctica, 21 July 1983 |
| Northern hemisphere lowest | −69.6 °C | Klinck station, Greenland, 22 December 1991 |
| Highest north of the Arctic Circle | 38.0 °C | Verkhoyansk, Russia, 20 June 2020 |
| India’s highest | 51.0 °C | Phalodi, Rajasthan, 19 May 2016 |
- Global warming is shifting the belts poleward:
- 2024 was the warmest year on record, about 1.55 °C above the 1850–1900 average, and 2025 was among the three warmest, at about 1.44 °C. The eleven years 2015–2025 are the eleven warmest on record.
- In India, 2024 was the warmest year since national records began in 1901 (0.65 °C above the 1991–2020 average), and 2025 ranked eighth.
- Nights are warming faster than days and the Arctic is warming fastest, so both the daily range and the pole-to-equator gradient are narrowing.





thank you sir
Thanks a lot lotusarise for this initiative.
Most Welcome, Ajay
thank you sir
It’s really helpful I found geography lectures all over the platforms but these type of content not found so cordially thanku
Thanks a lot
Sir first paragraph , earth receive short wave radiation as sun is wam body and it has high energy.
“”Sun is the major source of atmospheric temperature. In fact, the atmosphere receives a very low amount of heat energy from the Sun as it receives most of its energy from the long-wave terrestrial radiation””
exactly earth receive short waves from sun not long waves and long waves are emitted by earth in night time that is the main source of heating the atmosphere.
These notes are lucid and awesome.
I think it’s sufficient for upsc …..same things are given in ncert and other books so we don’t need to waste our time to read another resource
WOW!! thank you so much!!