- Inclusive regional development means that the gains of development reach every region and every group within it, and that its costs are not dumped on the weakest.
- Regional plans have usually measured success by output in places. They have counted far less how growth is shared between women and men, and what happens to people displaced to make room for dams, mines and cities.
- Three tools make planning inclusive: gender-sensitive planning, fair resettlement and rehabilitation, and reliable vital statistics that show who is being left out and where.
Inclusive Development as a Planning Goal

- The Eleventh Plan (2007–12) made “faster and more inclusive growth” its theme. Inclusion has two axes:
- spatial: lagging regions such as the eastern heartland, tribal plateaus, hill and border districts;
- social: women, Scheduled Castes and Tribes, the landless, the displaced, migrants and the disabled.
- The two axes overlap. A tribal woman in a mining district of Odisha or Jharkhand faces regional, social and gender disadvantage at once.
- Exclusion is built into some development: projects that need land and water take them from people with the weakest claims, while benefits flow to distant consumers.
- Inclusive planning therefore asks, for each plan and project, who gains, who pays, and who decides.
- Measuring inclusion: the National Multidimensional Poverty Index (NITI Aayog) shows the headcount of the multidimensionally poor falling from 29.17% in 2013–14 to 11.28% in 2022–23, but the poor remain concentrated in Bihar, Jharkhand, Uttar Pradesh, Madhya Pradesh and Meghalaya.
- The SDG India Index, district indicators of aspirational districts, and gender and caste breakdowns of survey data show whether gains reach the excluded.
Gender-Sensitive Regional Development
Why It Is Needed
- Gender gaps are large and regionally uneven. They are widest in the north and north-west and narrowest in the north-east, the Himalaya and the south.
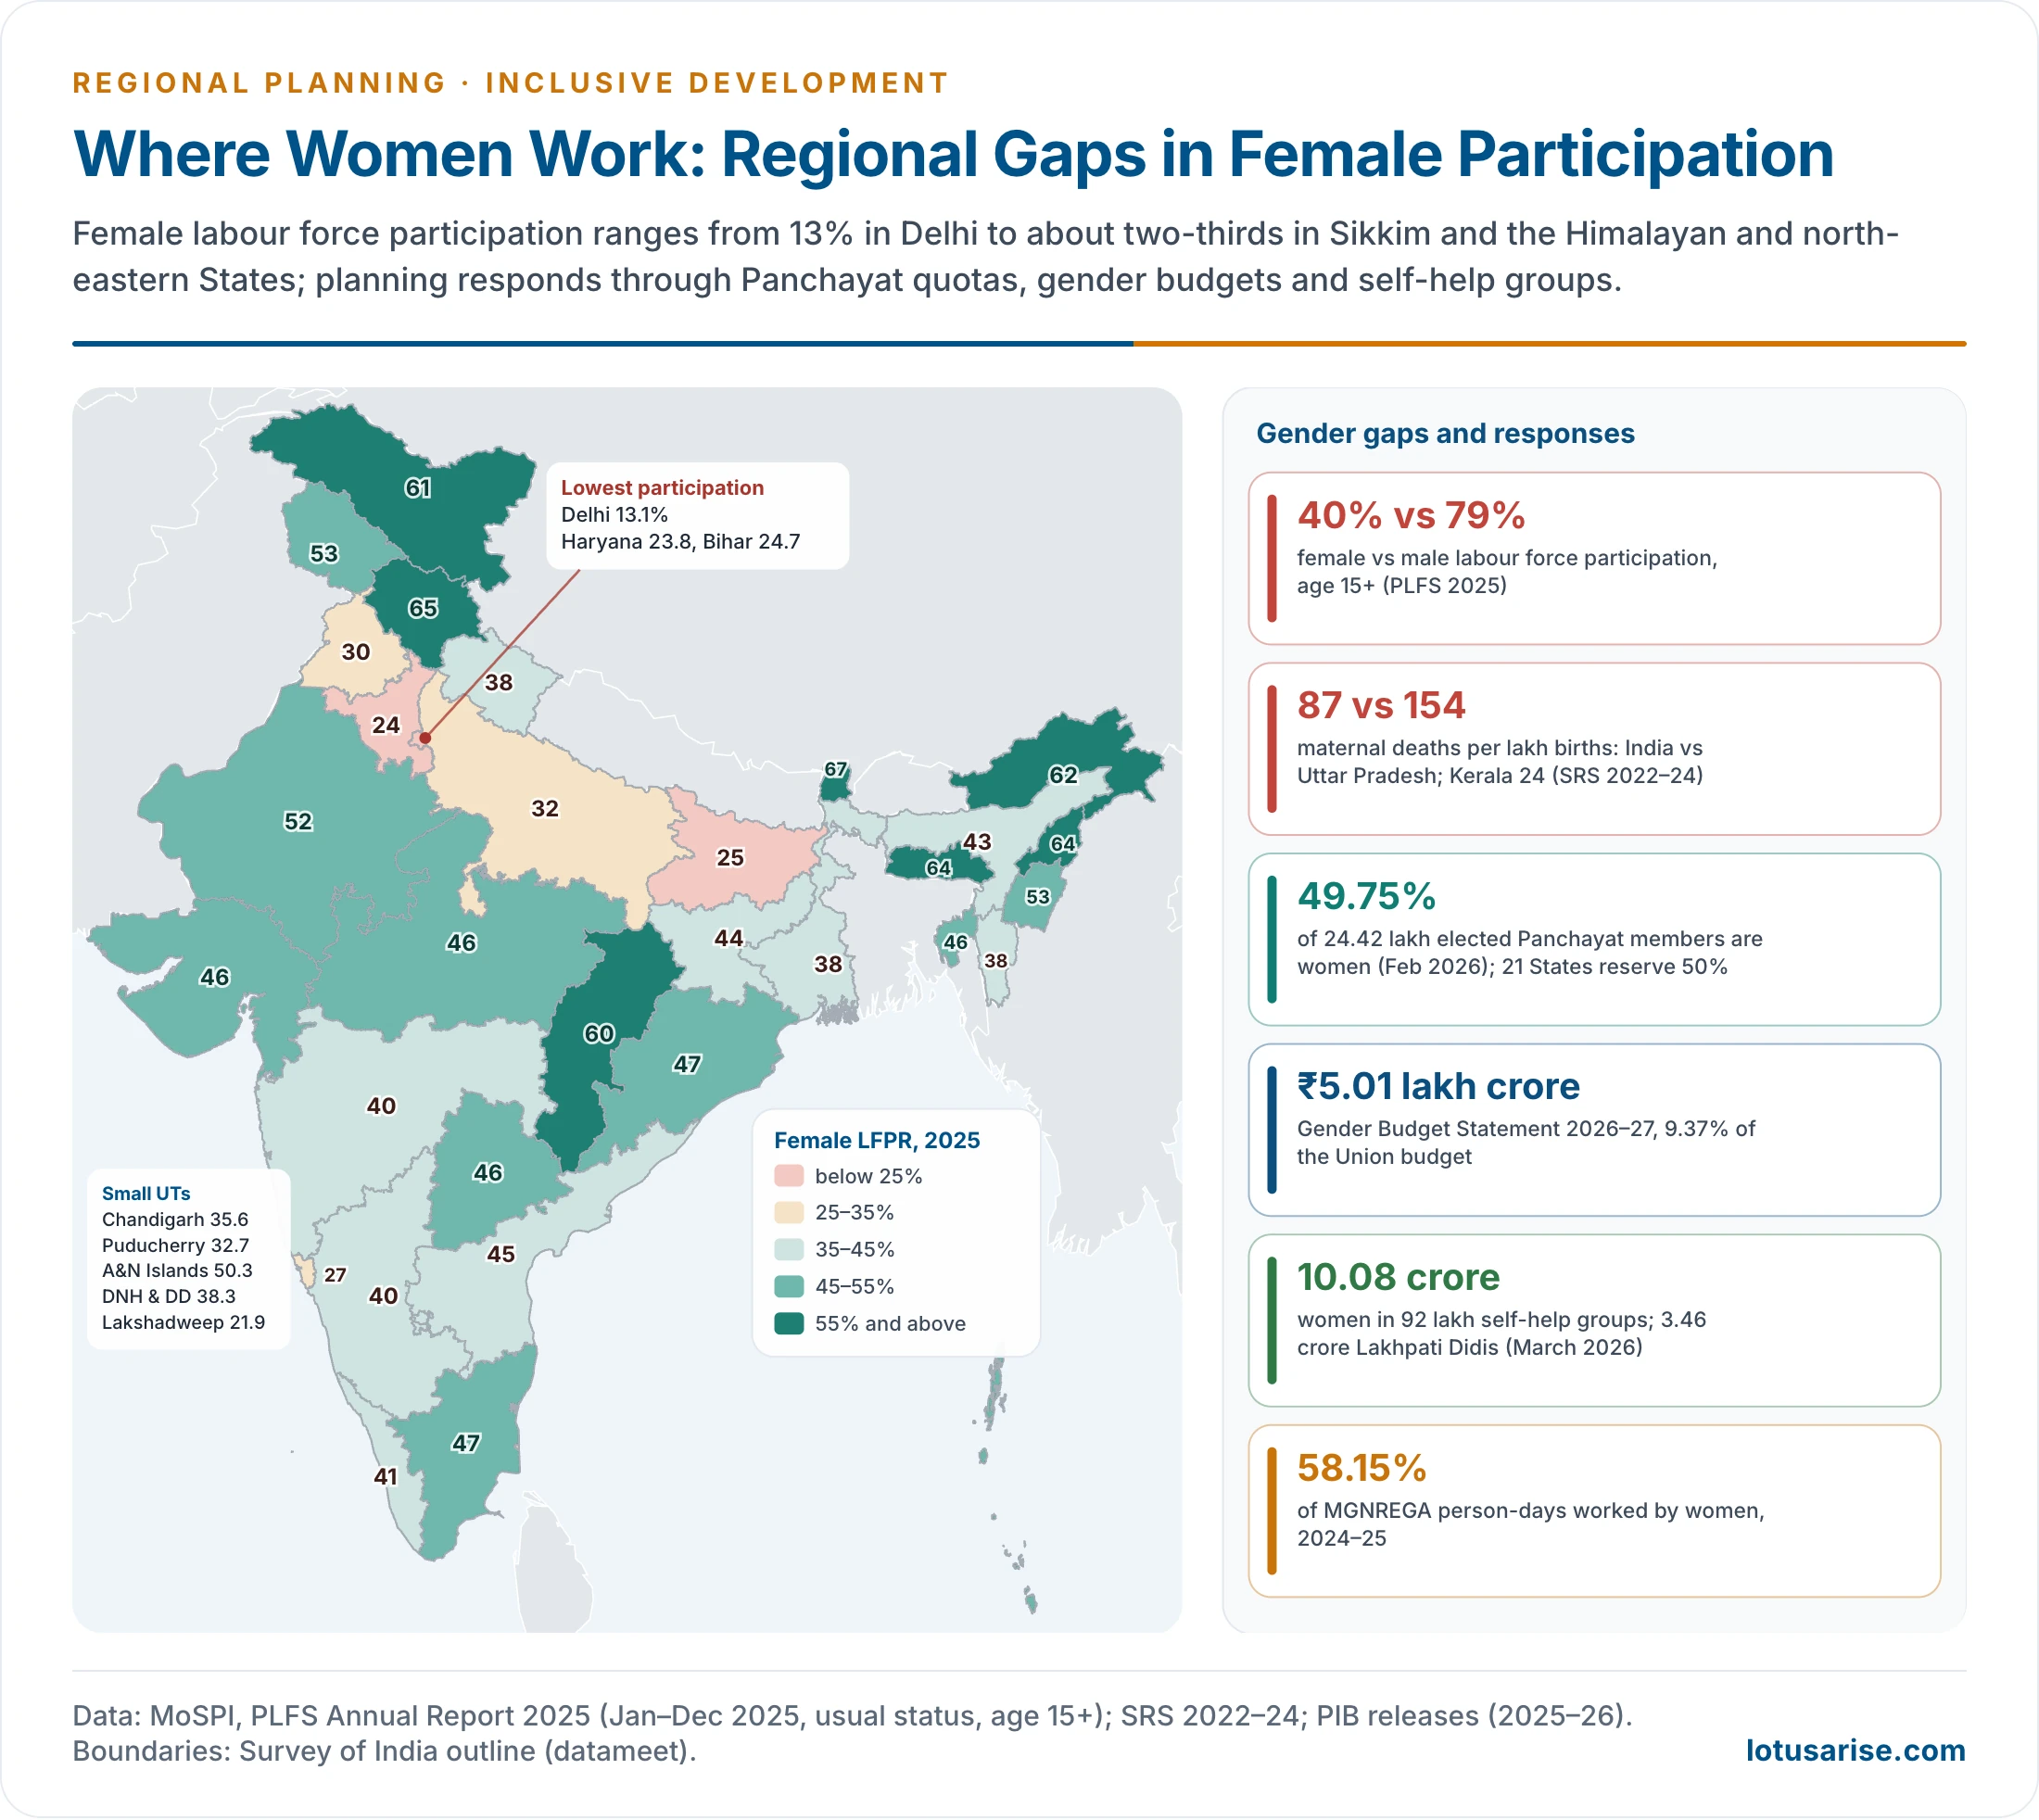
- Female labour force participation (age 15+, usual status) was 40.0% in 2025 against 79.1% for men (PLFS 2025). Rural women stood at 45.9% and urban women at 27.7%.
- It ranges from 13.1% in Delhi, 23.8% in Haryana and 24.7% in Bihar to 66.7% in Sikkim, 64.7% in Himachal Pradesh and 64.5% in Nagaland.
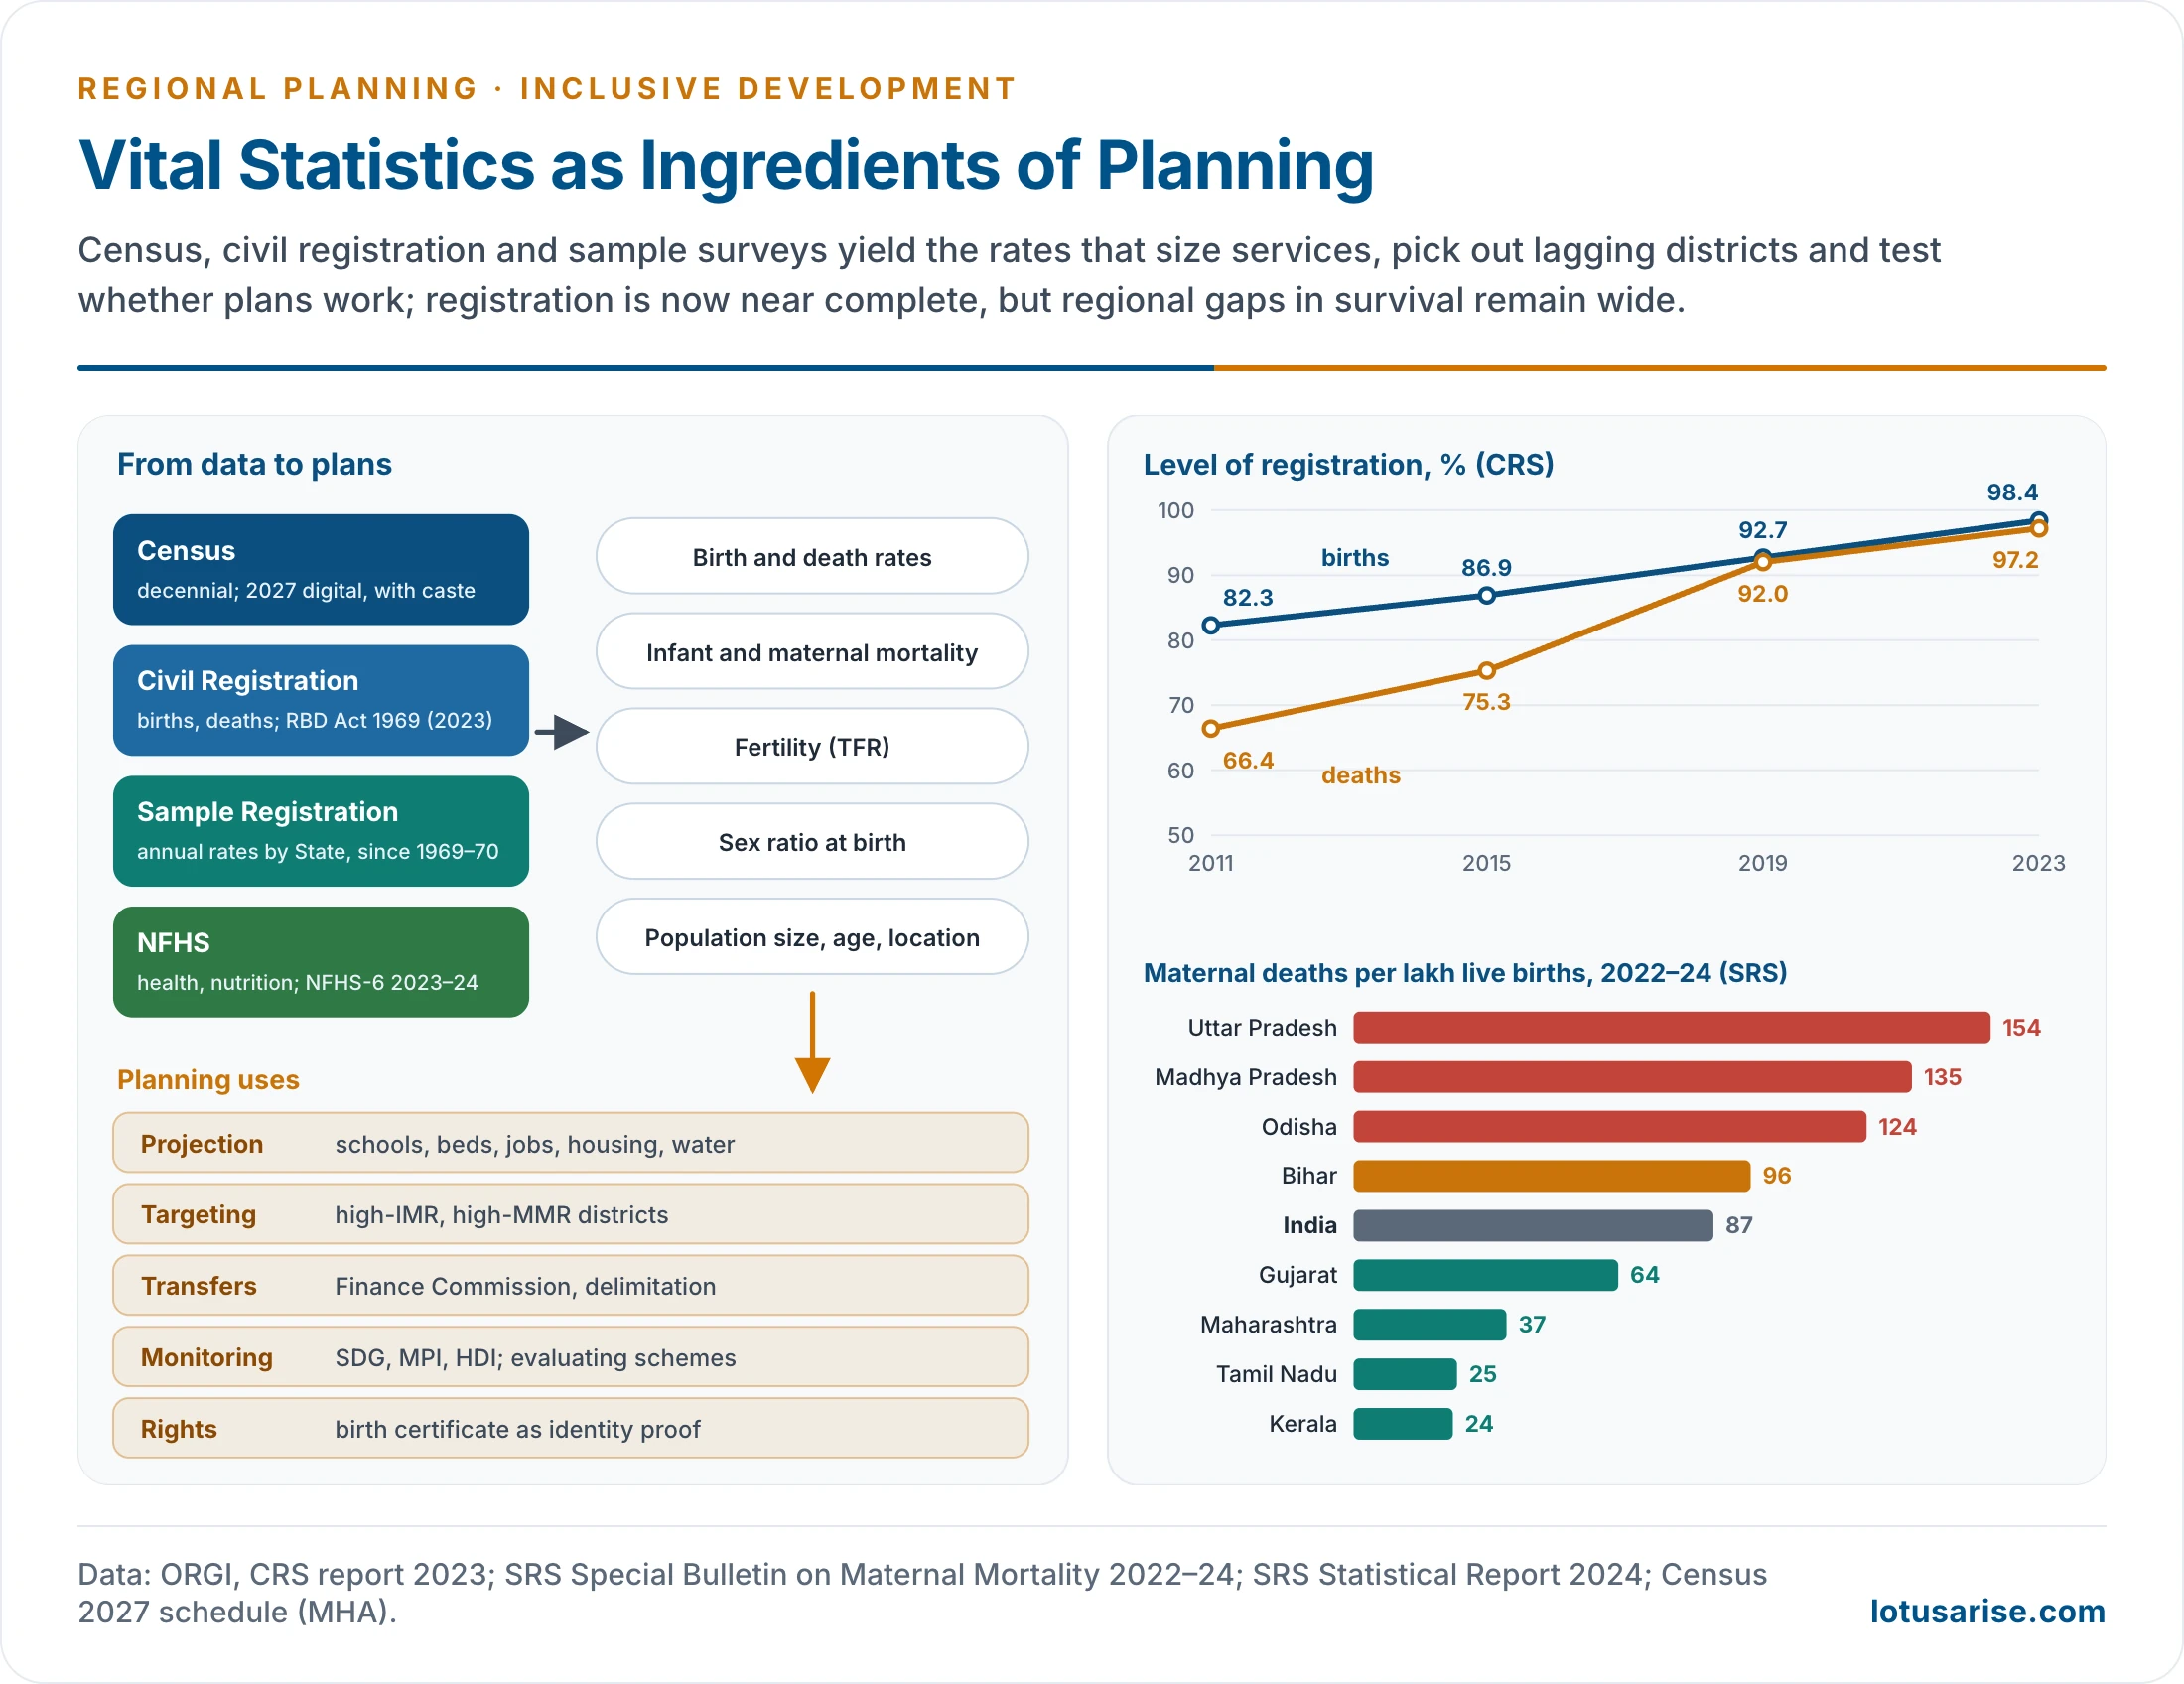
- Maternal mortality was 87 per lakh live births in 2022–24 (SRS), but 154 in Uttar Pradesh and 135 in Madhya Pradesh against 24 in Kerala and 25 in Tamil Nadu.
- The sex ratio at birth was 918 girls per 1,000 boys in 2022–24 (SRS). The deficit of girls is sharpest in the north-west, as the regional pattern of sex composition shows.
- In the SDG India Index 2023–24, gender equality is India’s weakest goal, with a score of 49.
- Development is not gender-neutral.
- Plans that count only market output miss women’s unpaid work: water and fuel collection, care, subsistence farming.
- Projects that take forests, commons and rivers hit women hardest, because women depend most on fuelwood, fodder, water and minor forest produce.
- Male out-migration leaves women managing farms without land titles, credit or extension services: the feminisation of agriculture in the Himalayan and eastern States.
- Regional development needs women’s work and skills. Low female participation wastes half the labour force of the lagging States.
- The regions with the lowest female participation are also those with the lowest SDG and human development scores.
- India’s composite indicators of gender gaps, the Gender Development Index and Gender Inequality Index, are part of the Human Development Index family; they show the same north–south contrast.
Elements of Gender-Sensitive Planning
- Gender-disaggregated data and analysis: district data on work, wages, land, health, education, mobility and violence by sex, and gender audits of plans and schemes.
- Gender budgeting: the Union Gender Budget Statement has been published since 2005–06.
- For 2026–27 it reports ₹5.01 lakh crore, 9.37% of the Union budget, from 53 ministries and departments.
- Part A lists schemes wholly for women (DAY-NRLM, PMAY-Gramin, Mission Shakti); Part B lists schemes with 30–99% for women.
- Many States now prepare their own gender budgets.
- Political voice: the 73rd and 74th Amendments (1992) reserved one-third of seats in local bodies for women.
- 21 States and 2 UTs have raised this to 50%. Of 24.42 lakh elected Panchayat representatives, 12.15 lakh (49.75%) are women (Ministry of Panchayati Raj, February 2026).
- The Nari Shakti Vandan Adhiniyam (2023) reserves one-third of seats in the Lok Sabha and State Assemblies, from the delimitation after the next Census.
- Proxy representation (“sarpanch-pati”) still weakens women’s role in Panchayati Raj, though trained women leaders have shifted local spending towards water, health and schooling.
- Livelihoods and assets:
- DAY-NRLM has organised about 10.08 crore women into 92 lakh self-help groups. 3.46 crore members had become “Lakhpati Didis” (annual household income of at least ₹1 lakh) by 31 March 2026, against a revised target of 6 crore.
- MGNREGA reserves at least a third of work for women; women’s share of person-days reached 58.15% in 2024–25.
- Land and houses in women’s names (joint titles under PMAY-Gramin), and Kerala’s Kudumbashree (1998) model of women’s collectives working with local government.
- Gendered infrastructure:
- piped water (Jal Jeevan Mission) and clean cooking fuel (Ujjwala) cut hours of drudgery and indoor smoke;
- toilets, street lighting, safe public transport and the Nirbhaya Fund’s safe-city projects widen women’s mobility;
- childcare, working women’s hostels and markets near villages make paid work possible.
- Health and education: Beti Bachao Beti Padhao (2015, launched in Panipat) for the worst child sex-ratio districts; maternal health schemes; secondary schooling and hostels for girls in tribal and remote areas.
- Women in project planning: women’s consent and compensation in land acquisition, separate entitlements for widows and single women in rehabilitation, and women’s representation in watershed, forest and water-user committees.
Gender in the Planning Cycle
- Analysis: map where and why women are excluded: work, land, mobility, health, safety, time burden.
- Targets: set gender-specific outcomes in the regional or district plan (female work participation, maternal mortality, girls’ secondary enrolment, women’s land titles).
- Budget: tag and fund schemes in the gender budget; give women’s collectives untied funds.
- Implementation: work through women’s self-help groups, federations and women members of Panchayats and committees.
- Audit and monitoring: gender audits and social audits, with sex-disaggregated results reported by district, feed the next plan.
The Regional Pattern
- North-western and Gangetic plains (Haryana, Punjab, Delhi, Uttar Pradesh, Bihar): the lowest female work participation, adverse sex ratios at birth and high maternal mortality in the eastern part.
- Causes: patriarchal norms of seclusion, son preference, low demand for women’s farm labour in mechanised agriculture, and few non-farm jobs nearby.
- North-east and Himalaya (Sikkim, Nagaland, Meghalaya, Himachal Pradesh, Arunachal Pradesh): high female participation, rooted in hill farming, tribal and matrilineal traditions (Khasi and Garo in Meghalaya) and women’s role in markets.
- Central tribal belt (Chhattisgarh, Jharkhand, Madhya Pradesh): high participation in rural work, but poor health and education outcomes, so participation reflects need more than opportunity.
- South (Kerala, Tamil Nadu): the best health and education outcomes, but only moderate paid participation, especially of educated women: a sign that jobs, not schooling, are now the constraint.
- Planning implication: one national design will not fit. The north needs mobility, safety, skills and jobs for women; the tribal belt needs health, schooling and secure land and forest rights; the south needs formal jobs for educated women.
Challenges
- Women’s work remains informal, unpaid or under-counted.
- Gender budgeting often reclassifies existing spending rather than designing new outcomes.
- Women’s land ownership is low, which limits credit and the benefit of compensation in land acquisition.
- Representation in Panchayats has grown faster than control over funds and decisions.
- Violence and fear of violence restrict mobility, and with it access to work and services.
Development-Induced Displacement
Meaning and Causes
- Development-induced displacement is the forced movement of people from their homes, land or livelihoods to make way for development projects.
- Causes:
- dams and irrigation: the largest single cause in India (Sardar Sarovar, Tehri, Hirakud, Polavaram);
- mining: coal and iron-ore belts of Jharkhand, Odisha and Chhattisgarh, often in Fifth Schedule tribal areas;
- industry and SEZs: steel towns of the Second Plan, industrial corridors, power plants;
- urban projects: slum clearance, expressways, airports, metro and riverfront schemes, “beautification”;
- linear infrastructure: highways, railways, transmission lines;
- conservation: relocation of villages from tiger reserves and national parks.
- Scale: India keeps no official national count of people displaced since 1947; research estimates run into crores.
- Scheduled Tribes are heavily over-represented among them, because forests, minerals and dam sites lie in tribal areas.
- Many people are displaced more than once, as in Singrauli, where families moved for the Rihand dam were later moved again for coal mines and power plants.
Indian Cases
| Project | Region | Officially recorded displacement | Issue |
|---|---|---|---|
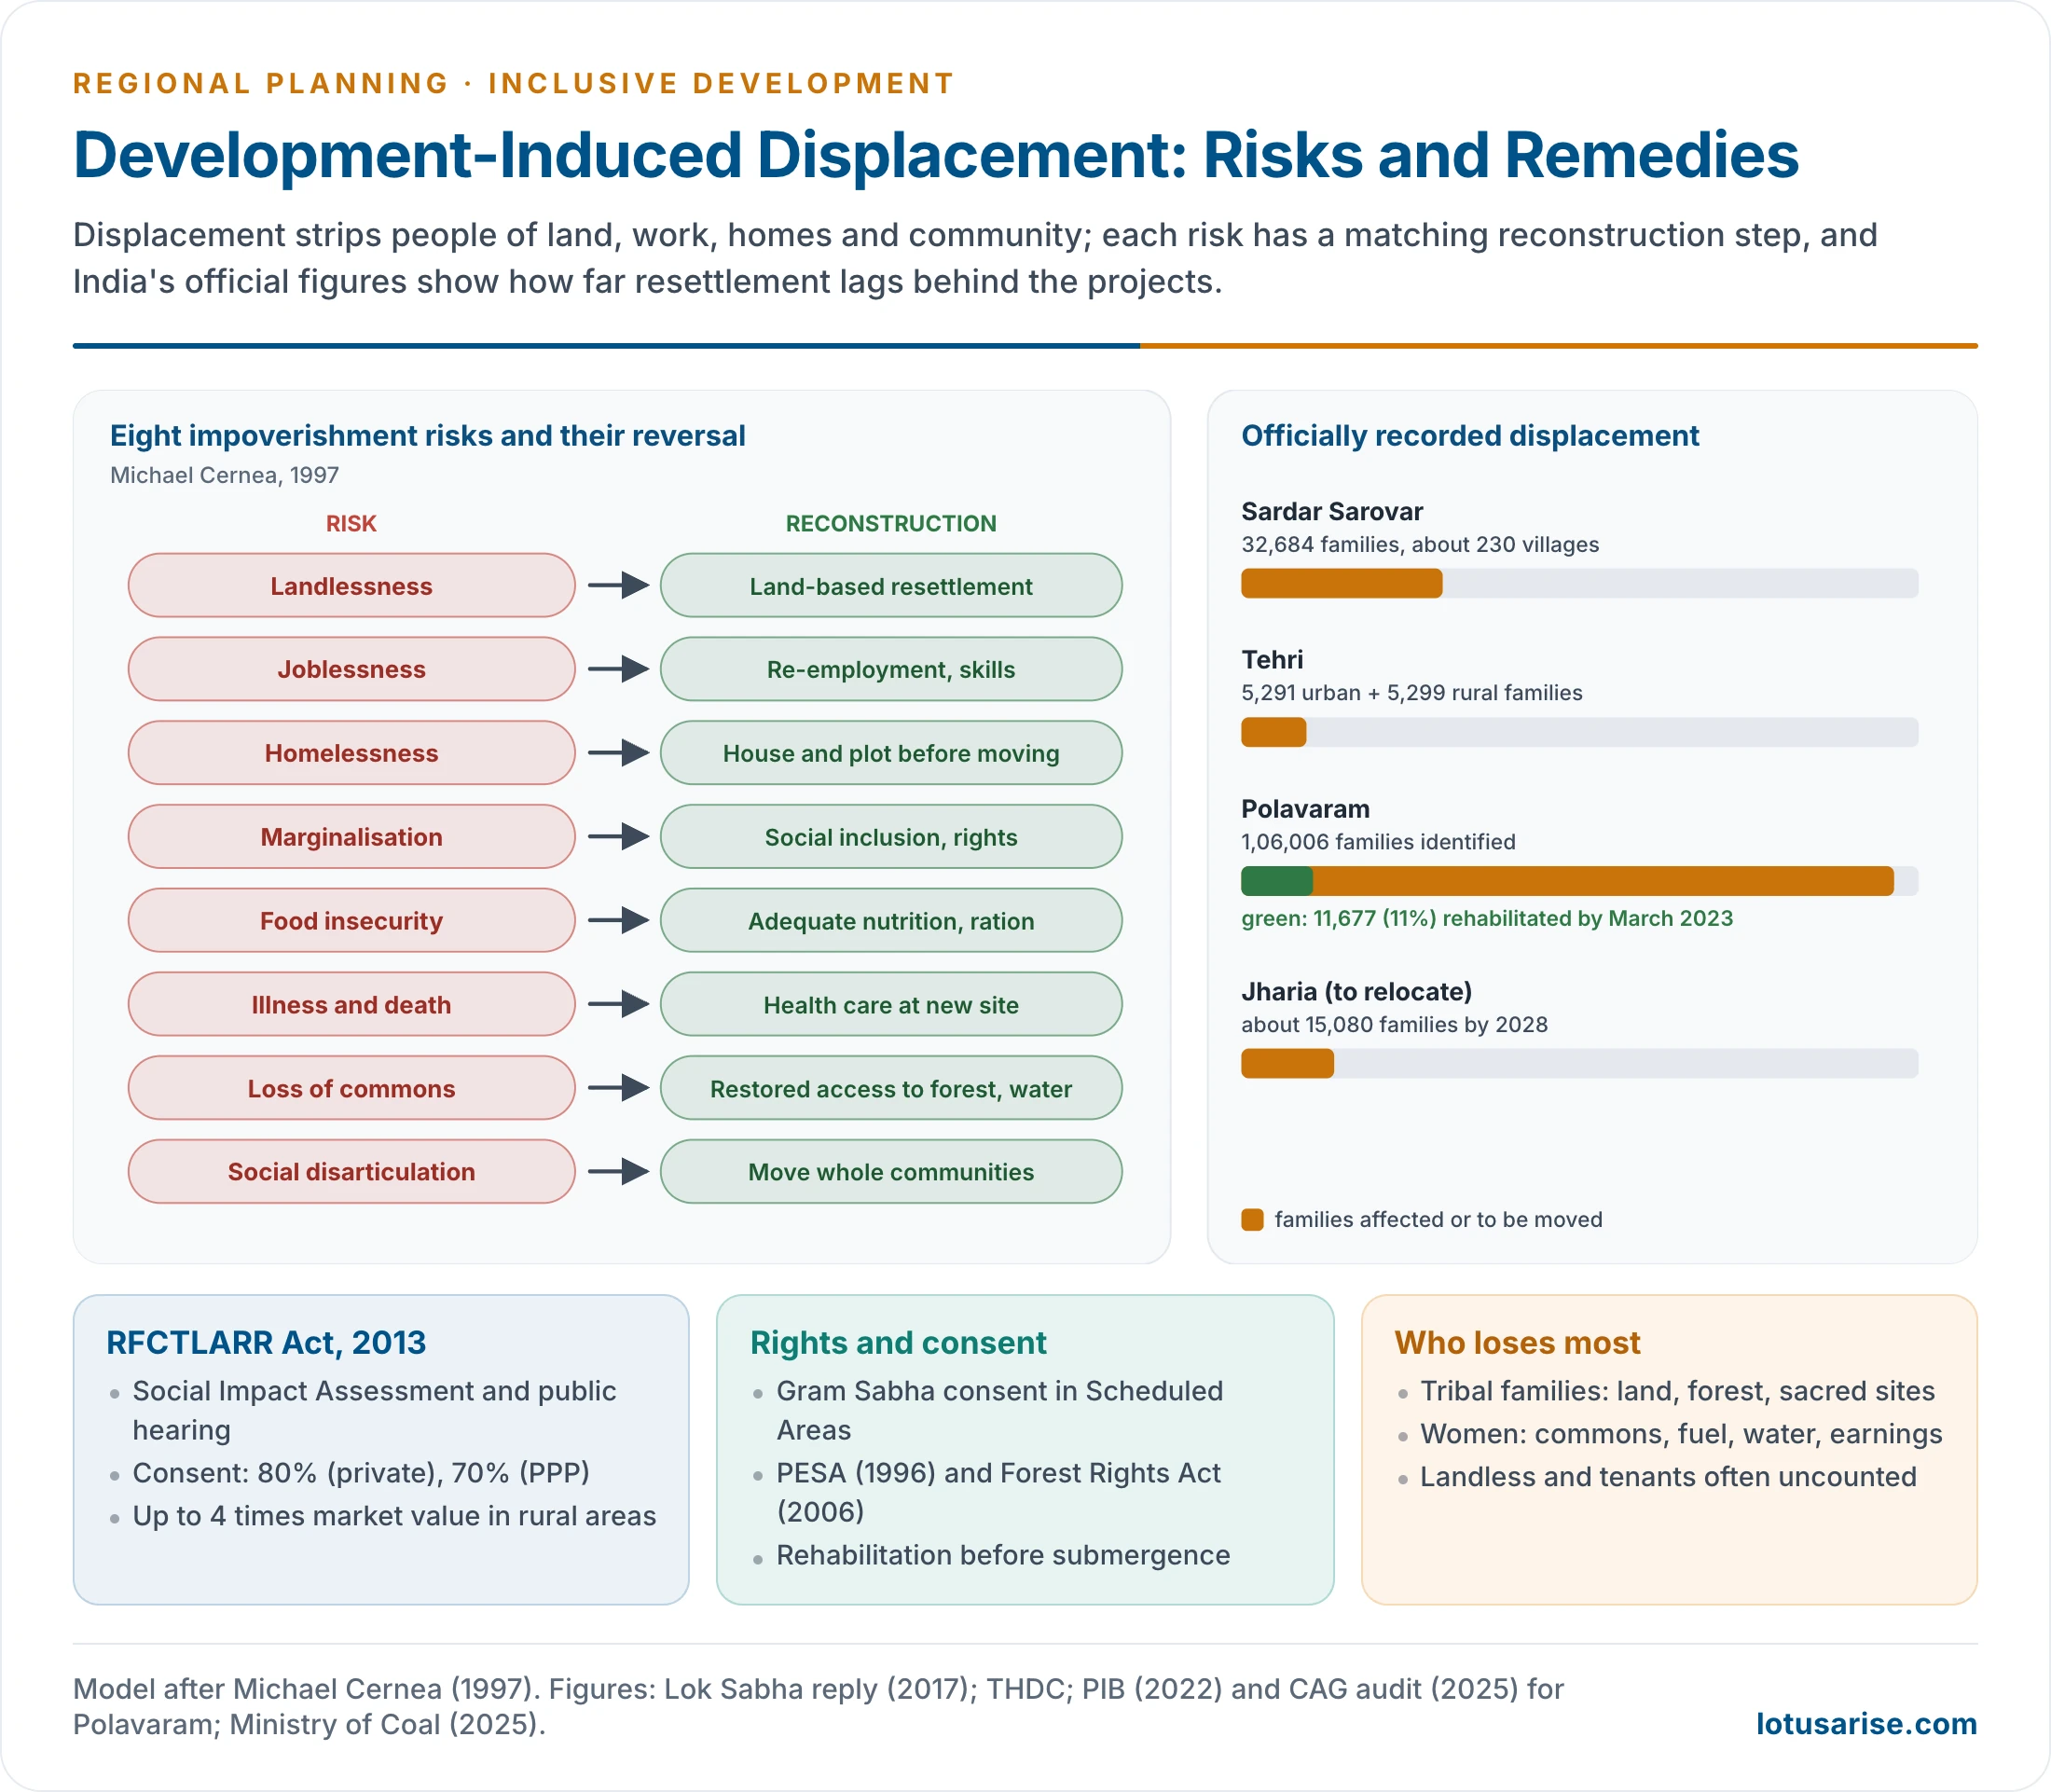
| Sardar Sarovar (Narmada) | Gujarat, Maharashtra, Madhya Pradesh | 32,684 families in about 230 villages | Tribal submergence; land-for-land disputes; Narmada Bachao Andolan |
| Tehri (Bhagirathi) | Uttarakhand | 5,291 urban families (Old Tehri) and 5,299 rural families fully affected | Loss of a historic town; resettlement in the plains |
| Polavaram (Godavari) | Andhra Pradesh | 1,06,006 families identified; 11% rehabilitated by March 2023 | Mostly tribal; slow resettlement |
| Jharia coalfield | Jharkhand | About 15,080 families to be relocated by 2028 | Fires and subsidence under settlements |
| Steel towns (Bhilai, Rourkela, Bokaro) | Central tribal belt | Large tribal displacement, poorly recorded | Unskilled jobs only; loss of land and culture |
Consequences
- Michael Cernea’s Impoverishment Risks and Reconstruction model (1997) names eight risks that displacement creates:
- landlessness, the core risk for farming and forest households;
- joblessness, as wage and craft work is lost;
- homelessness, temporary or lasting;
- marginalisation, a slide in income, status and confidence;
- food insecurity;
- increased morbidity and mortality, from stress, poor sites and disease;
- loss of access to common property: forests, grazing land, water and fisheries;
- social disarticulation: the breaking of kin networks, village institutions and culture.
- Thayer Scudder and Elizabeth Colson (1982) described resettlement in stages: planning and recruitment, adjustment and coping (when stress peaks), community formation and economic development, and finally handing over and incorporation. Most Indian projects stall in the second stage.
- Women lose access to commons first, are rarely compensated as separate claimants and often lose their earning role.
- Tribal communities lose not only land but also sacred sites, language communities and customary rights that cash cannot replace.
- Host regions face pressure on land and services, and conflict with newcomers.
- Urban displacement has its own pattern: slum families evicted for roads, rail lines or riverfronts are often resettled on the city’s edge, far from work, schools and markets, so incomes fall and commuting time rises even when a flat is provided. In-situ redevelopment keeps people near their livelihoods and is the better option where land allows.
- Environmental effects: resettlement sites carved out of forest, and displaced people pushed onto fragile slopes.
Solutions
- Avoid and minimise: consider alternatives (smaller dams, run-of-river schemes, route changes) and reduce the land taken. The World Commission on Dams (2000) asked for prior options assessment and free, prior and informed consent.
- The law: the Right to Fair Compensation and Transparency in Land Acquisition, Rehabilitation and Resettlement Act, 2013 (in force from 1 January 2014) replaced the Land Acquisition Act of 1894. Its main safeguards:
- Social Impact Assessment with public hearing before acquisition;
- consent of 80% of affected families for private projects and 70% for public–private partnerships;
- compensation up to four times the market value in rural areas and twice in urban areas;
- rehabilitation and resettlement entitlements in its Second Schedule: house, employment or annuity, subsistence and transport allowances;
- Gram Sabha consent in Scheduled Areas, and land-for-land for Scheduled Tribe families in irrigation projects;
- return of land left unused for five years.
- Forest and tribal rights: the PESA Act (1996) and the Forest Rights Act (2006) require Gram Sabha consultation and settlement of forest rights before forest land is diverted.
- Rehabilitation before displacement: sites, houses and land ready before submergence or eviction. The Narmada tribunal’s award and the Supreme Court made this a condition for raising the Sardar Sarovar dam.
- Livelihood, not just compensation: land-for-land where possible, skills, jobs in the project, and benefit-sharing through royalties, District Mineral Foundations, or equity and free power for affected villages.
- Special attention to women and tribes: separate entitlements for adult women, single women and widows; resettlement as whole communities near their old area.
- Grievance redress and independent monitoring of rehabilitation, with records made public.
- Lessons from Indian cases:
- Resettlement was usually planned after the dam or mine, not with it; people were counted late and many (landless labourers, forest users, unrecorded tenants) were left out.
- Cash compensation without land or jobs was often spent quickly, leaving families poorer within a few years.
- Where land-for-land, community resettlement and project jobs were offered, as for some Sardar Sarovar families resettled in Gujarat, outcomes were better.
- The National Rehabilitation and Resettlement Policy (2007) and the 2013 Act moved policy from compensation for property towards restoring livelihoods.
Vital Statistics in Development Planning
What They Are
- Vital statistics record vital events: live births, deaths, still births, marriages and divorces, and the rates derived from them.
- Fertility: crude birth rate, total fertility rate, age-specific fertility.
- Mortality: crude death rate, infant mortality rate, under-five mortality, maternal mortality ratio, cause of death.
- Composition: sex ratio at birth, life expectancy, natural increase.
- Population census data (size, structure, distribution) are their essential denominator.
Sources in India
- Census (every ten years since 1872; synchronous since 1881). The 2021 Census was postponed.
- Census 2027 is India’s first digital census and will also enumerate caste.
- Its house-listing phase ran from April to September 2026; population enumeration falls in February 2027 (reference date 1 March 2027), and in snow-bound areas in September 2026.
- Civil Registration System: compulsory registration under the Registration of Births and Deaths Act, 1969, amended in 2023 (in force from 1 October 2023).
- The birth certificate is now a single document for school admission, driving licences, voter lists, marriage registration and government jobs, and registration is digital.
- The level of registration rose from 82.3% of births and 66.4% of deaths (2011) to 98.4% and 97.2% (2023).
- Sample Registration System (pilot 1964–65, full scale from 1969–70): dual recording in sample units gives reliable annual rates by State.
- For 2024: crude birth rate 18.3, crude death rate 6.4, infant mortality 24, total fertility 1.9 (below replacement for the fifth year).
- National Family Health Survey (since 1992–93): fertility, nutrition, health, women’s empowerment at district level. NFHS-6 (2023–24) fact sheets were released on 29 May 2026.
- Medical Certification of Cause of Death, the Health Management Information System, and the PLFS for work and migration complete the system.
Why Planning Needs Them
- Projection and provision: births and deaths decide future school places, hospital beds, jobs, housing and water.
- Falling fertility in the south means planning for ageing; high fertility in Bihar (TFR 2.9) and Uttar Pradesh means planning for schools and jobs.
- Targeting lagging regions: infant and maternal mortality pick out districts for health investment.
- The aspirational districts and the High Priority Districts of the National Health Mission were chosen this way.
- Measuring disparity: vital rates are core inputs to the HDI, the SDG India Index and the National Multidimensional Poverty Index.
- Fiscal transfers and representation: Finance Commissions use population and demographic performance in sharing taxes; delimitation of constituencies follows the census.
- Gender planning: the sex ratio at birth, maternal mortality and girls’ survival reveal discrimination that income data hide.
- Epidemics and disasters: timely death registration showed the true toll of the COVID-19 waves in 2021 and guides disaster relief.
- Individual rights: a registered birth gives legal identity and access to entitlements; a registered death settles inheritance and pensions.
- Evaluating plans: falling IMR and MMR show whether health and nutrition programmes work, region by region.
- Regional demographic contrast: 18 States and UTs were below replacement fertility in 2023, while the Hindi heartland still grows fast. Plans for migration, jobs and old-age care must follow this divergence.
Limitations
- Census delays leave plans relying on 2011 data and on projections.
- Registration is still slow or incomplete in some States, and medically certified causes of death cover only a minority of deaths.
- Survey estimates are weak for small areas and small groups, just where inclusive planning needs them.
- Differences between sources (CRS, SRS, NFHS) need careful harmonisation.