

- Applied climatology is the scientific analysis of climatic data for a practical, operational purpose (Helmut E. Landsberg and Woodrow C. Jacobs, 1951). It covers agriculture, health, building design, transport, industry, energy and planning.
- It grew after the Second World War, when climate data began to be used for planning water resources, aviation, disease control and cities. Earlier, climatology had been largely descriptive statistics of weather.
- It works at three levels:
- an inner core of collecting and storing data
- a middle ring of analysis
- an outer ring of applications for farmers, engineers, planners and industry
- Urban climatology, its most active branch, studies how cities create their own climate: heat islands, pollution domes, altered winds and rainfall.
| Branch | Applies climate to | Example |
|---|---|---|
| Agroclimatology | Crops, livestock, irrigation, frost and drought | IMD agromet advisories |
| Bioclimatology / medical climatology | Health, comfort, disease | Heat-stress warnings |
| Architectural (building) climatology | Site, orientation, design, materials | Courtyard houses of Rajasthan |
| Urban climatology | Heat islands, pollution, urban planning | Ahmedabad Heat Action Plan |
| Aviation and transport climatology | Fog, winds, storms | Fog-landing systems at Delhi airport |
| Industrial and energy climatology | Industrial location, power demand, renewables | Siting of solar and wind parks |
Climate and Economic Activities

Climate and Natural Vegetation
- Vegetation is both an indicator and a modifier of climate.
- Forest microclimate compared with open ground:
- Lower and less variable temperatures:
- In temperate plains forests average about 0.6 °C cooler, more in summer.
- About 90% of the sunlight is absorbed by the canopy, so undergrowth is sparse.
- Relative humidity 3–10% higher, and evaporation from the soil 50–70% lower.
- Lower wind speeds: forests act as windbreaks and reduce frost in adjoining fields.
- Lower and less variable temperatures:
- Silviculture uses these facts: shade-tolerant species are raised under nurse trees, and thinning admits light, but over-thinning exposes trees to windthrow.
Climate and Agriculture
- Solar radiation: drives photosynthesis. Photoperiod (day length) controls flowering in sensitive crops (short-day rice and soybean, long-day wheat).
- Temperature: each crop has threshold, optimum and maximum temperatures.
- Frost-sensitive: coffee, banana, sugarcane
- Needing over 21 °C: coconut, pineapple
- Harmed below ~15 °C: cotton, rice, citrus
- Wheat grows from about 3–5 °C, and potato prefers cool soils (~18 °C).
- Degree-days:
- Each degree of daily mean temperature above a crop’s base temperature counts as one: with a 6 °C threshold, a 16 °C day gives 10 degree-days.
- Their sum (accumulated temperature) compares crop thermal needs and the suitability of a region.
- Moisture and drought:
- Agricultural drought is the deficit when soil moisture cannot meet potential evapotranspiration.
- Types: permanent (deserts), seasonal (dry season) and contingent (from rainfall variability).
- Seasonal distribution, reliability and intensity of rain matter more than the annual total.
- Remedies: irrigation, dry farming, crop choice (millets), mulching, watershed works.
- Frost:
- Advection (air-mass) frost: cold air arrives from elsewhere. It is widespread, hard to fight, and damages winter wheat and citrus.
- Radiation frost: forms on clear, calm nights under an inversion, in low-lying pockets. It hits potato, tomato and mustard in north India.
- Protection:
- light irrigation before frost nights in the north Indian plains
- planting orchards on slopes above the valley inversion (Himachal apples)
- wind machines, heaters and smoke in California and Florida groves
- Wind:
- Moderate winds aid pollination and CO2 supply. Strong winds lodge crops, shatter seeds and erode soil.
- Shelterbelts and windbreaks protect fields in the Thar margins and the Great Plains.
- India:
- IMD’s Agrometeorological Advisory Service issues district- and block-level crop advisories.
- Weather-index crop insurance (RWBCIS) pays out on recorded rainfall or temperature.
- The early heat of March 2022 shrivelled wheat grain in Punjab and Haryana.
Climate and Animal Husbandry
- Temperature is the dominant factor:
- High heat cuts milk yield, feed intake, growth and fertility (the optimum for European dairy cows is ~10 °C).
- Hens lay larger eggs in cool weather.
- Snowstorms, cold rain and lightning kill livestock in the open; high wind, dryness and heat raise water needs.
- Breeds suited to climate:
- Merino sheep in semi-arid temperate grasslands; Jersey cows tolerate warmth better than other dairy breeds.
- In India, Sahiwal and Gir cattle bear heat, and yak and Changthangi (pashmina) goats thrive in cold Ladakh.
Climate, Transport, Industry and Energy
- Aviation: fog, low cloud, wind shear and thunderstorms. Delhi’s winter fog needs CAT-III instrument landing systems.
- Surface transport: fog delays north Indian trains each winter; cyclones and monsoon gales close ports.
- Industry:
- Humid climates once favoured cotton spinning (Lancashire, Mumbai), because thread breaks less in moist air.
- Pollution dispersal depends on wind and stability.
- Energy:
- Heating and cooling degree-days predict power demand; India’s peak demand touched ~250 GW in May 2024 during the heatwave.
- Solar and wind parks are sited on climatic data (Rajasthan, Gujarat, Tamil Nadu).
Climate, Health and Human Comfort
Climate and Disease
- Climate rarely causes disease directly. It acts on disease organisms and vectors and on the body’s resistance.
- Vector-borne:
- Malaria and dengue need warmth and standing water; they peak in and after the monsoon.
- Warming is spreading dengue to higher altitudes and new districts, such as Himalayan towns.
- Seasonal:
- Influenza and pneumonia rise in winter, when the respiratory tract’s resistance falls.
- Measles peaks in the tropical spring.
- Weather-triggered:
- asthma attacks after sudden drops in temperature and humidity
- heat stroke during heatwaves
- respiratory illness in winter smog
- Hot, dry local winds such as the loo and foehn are associated with irritability, hypertension and heat exhaustion.
Human Comfort
- Comfort is the state in which the body maintains its core temperature of ~37 °C without shivering or heavy sweating.
- The body exchanges heat by radiation, conduction, convection and evaporation of sweat.
- Comfort depends on air temperature, humidity, wind, radiation, and on health, age, clothing, activity and acclimatization.
- Humidity blocks evaporative cooling, so humid heat feels hotter.
- Wind cools the body when the air is below skin temperature, but adds heat when the air is hotter than the skin (~35 °C).
- Sensible temperature is the temperature the body actually feels; no thermometer measures it.
| Index | Proposed by | Combines | Use |
|---|---|---|---|
| Effective temperature | F. C. Houghten and C. P. Yaglou (1923) | Temperature, humidity, air movement | Indoor comfort (comfortable band ~15–27 °C) |
| Temperature–Humidity Index (Discomfort Index) | Earl C. Thom (1959) | Dry- and wet-bulb temperature | Summer discomfort; heat stress in cattle |
| Heat index / apparent temperature | Robert G. Steadman (1979) | Temperature, humidity | “Feels-like” heat warnings |
| Wind chill | Paul Siple and Charles Passel (1945); revised 2001 | Temperature, wind speed | Frostbite risk in cold, windy weather |
| Wet-Bulb Globe Temperature (WBGT) | C. P. Yaglou and D. Minard (1957) | Humidity, radiation, wind, temperature | Safe work and exercise limits |
- Wet-bulb temperature is the limit of evaporative cooling. A sustained wet-bulb of 35 °C was proposed as the theoretical limit of human survival (Steven Sherwood and Matthew Huber, 2010); laboratory work since 2022 puts the safe limit lower, near 31 °C. Humid coastal and Indo-Gangetic India already approach it in pre-monsoon heat.
- Heat stress index: the ratio of the sweat that must evaporate to stay comfortable to the maximum evaporation the air allows.
Acclimatization
- Acclimatization is the body’s gradual physiological adjustment to a new climate.
- It declines with age, and in a broad sense includes psychological and cultural adjustment.
- Heat:
- Blood vessels in the skin dilate and blood volume rises.
- Sweating starts earlier and is more dilute; thirst rises and appetite falls.
- It is largely complete in about two weeks, faster in dry heat than in humid heat.
- Cold: reduced blood flow to the skin, shivering and a higher metabolic rate.
- High altitude (>3 km):
- Low oxygen causes headache, breathlessness, insomnia and a faster pulse.
- Adjustment takes about three weeks, which is why troops are acclimatized in stages before deployment in Ladakh and Siachen.
- Native highlanders have larger lungs and chests.
Climate and Architecture
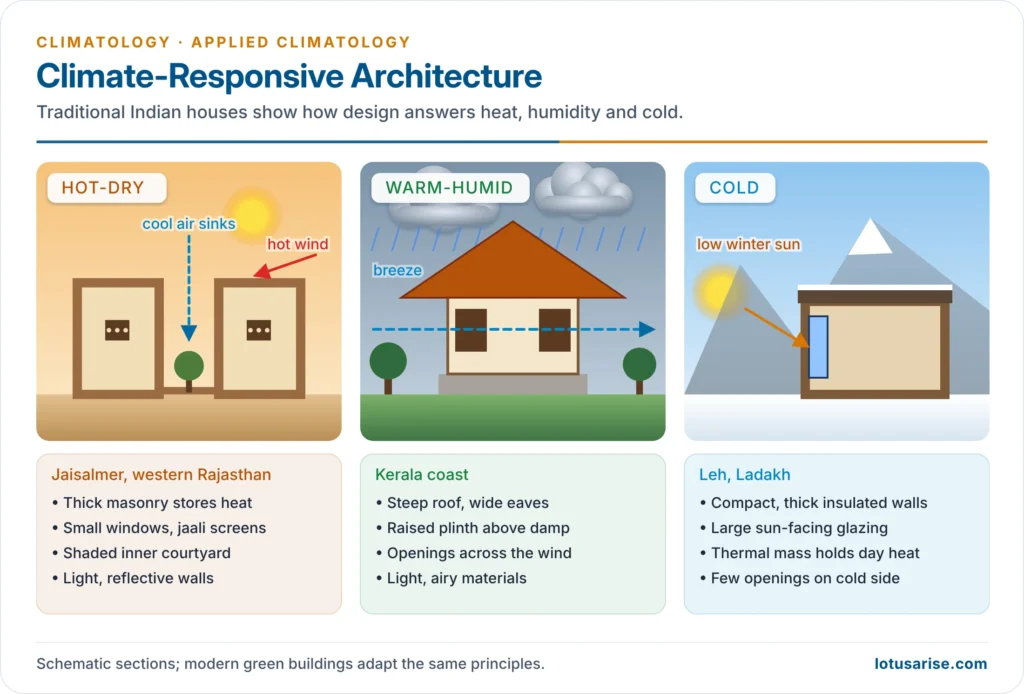
- Building (architectural) climatology uses the microclimate of a site more than the regional climate.
- Site selection:
- Wind is the key element:
- open, windward sites for ventilation in the humid tropics
- sheltered sites in cold climates
- homes upwind of polluting industry
- Slopes: in cold regions, equator-facing slopes get most sun. Mid-slopes above the valley inversion are warmer and free of fog, which is why hill resorts and orchards occupy them.
- Water bodies: large lakes moderate temperature; shallow ponds raise humidity.
- River sites need knowledge of the flood regime.
- Wind is the key element:
- Climate conditioning shapes the building itself:
- Orientation to the sun and prevailing wind
- Room layout: breakfast rooms facing the morning sun, studies on the shaded side
- Wall colour, insulation and roof form:
- steep roofs where rain and snow are heavy
- flat roofs in dry climates
- double or water-cooled roofs in the hot tropics
- Overhangs and screens against hail and sun
- Lightning conductors
| Climate | Design response | Indian example |
|---|---|---|
| Hot-dry | Thick masonry walls, small openings, courtyards, jaali screens, light colours, compact clustering for shade | Jaisalmer havelis |
| Warm-humid | Cross-ventilation, raised floors, steep roofs with wide eaves, light materials | Kerala nalukettu houses |
| Cold | Compact form, thick insulation, sun-facing glazing, Trombe walls, earth-sheltering | Ladakhi houses |
| Composite | Seasonal shading, courtyards, cavity walls, operable vents | Delhi, Nagpur |
| Polar | Dome shape, snow insulation, minimal surface area | Inuit igloo |
- Green architecture applies these principles with modern tools:
- Energy Conservation Building Code (2007, updated 2017; broadened in 2024 to include sustainability)
- GRIHA ratings
- Cool roofs
- Rainwater harvesting
- Local low-carbon materials, such as Laurie Baker’s rat-trap bond brickwork in Kerala
- Challenges: cost, weak enforcement in small towns, and the air-conditioner-led design of glass towers.
Urban Climate
- Cities replace soil and vegetation with concrete, asphalt and glass, pack buildings into street canyons, release waste heat and pollutants, and drain away rainwater. Each change alters the local energy and water balance.
- Luke Howard (1818–1820) first measured London’s warmth relative to the countryside. Gordon Manley (1958) used the term “urban heat island”. Tim R. Oke (1970s–80s) explained its energy balance.
- He distinguished the urban canopy layer (street level to rooftops) from the urban boundary layer above the city.
| Element | City compared with countryside |
|---|---|
| Solar radiation | Less, especially ultraviolet; fewer bright sunshine hours |
| Temperature | Higher, by 1–3 °C on average and up to ~10 °C on calm, clear nights; smaller diurnal range |
| Humidity | Lower relative humidity (less evapotranspiration, warmer air) |
| Wind | Lower mean speed but more gusts and turbulence; channelling in street canyons |
| Cloud and precipitation | More cloud, more thunderstorms and heavy rain, often downwind |
| Fog and visibility | Poorer visibility from aerosols; more smog. Heat can also create “fog holes” over the warmest cores |
Urban Heat Island
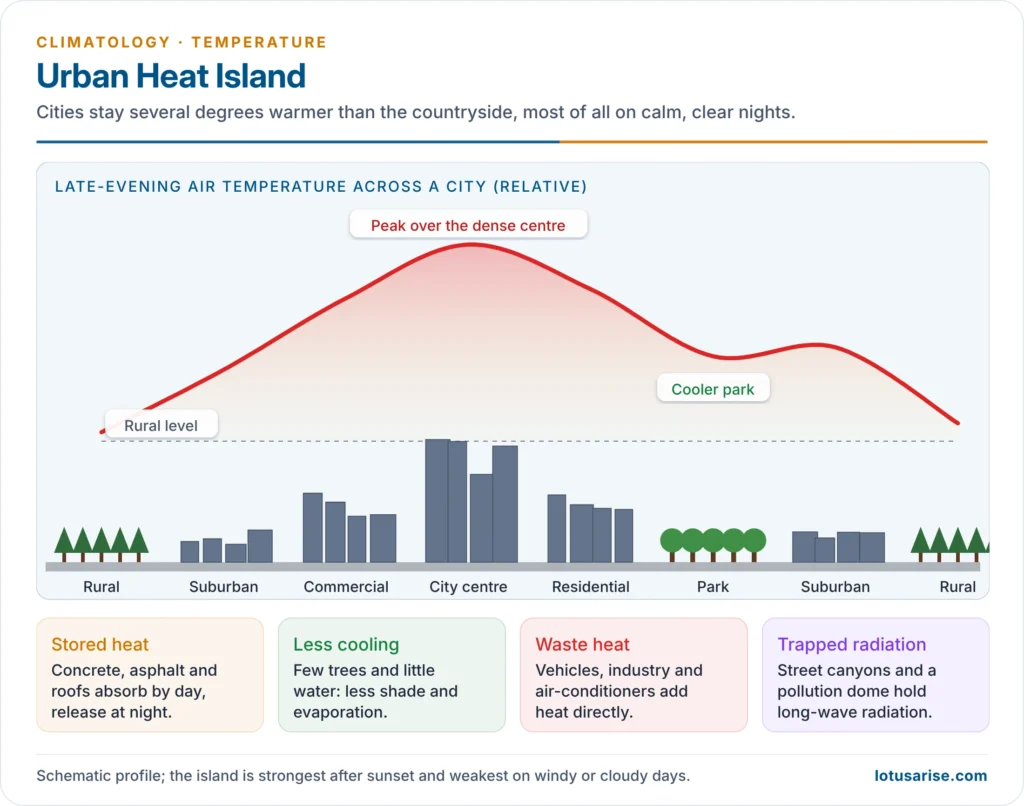
- An urban heat island (UHI) is the dome of warmer air over a city: highest over the dense centre, falling off through the suburbs to the rural edge, with cool islands over parks and lakes.
- Causes:
- Thermal properties: concrete and asphalt have low albedo and high heat capacity. They absorb heat by day and release it at night.
- Urban geometry: tall buildings and narrow streets trap long-wave radiation (low sky-view factor) and block cooling winds.
- Loss of vegetation and water: little evapotranspiration, so energy heats the air instead of evaporating water.
- Anthropogenic heat: vehicles, industry, air-conditioners (which dump indoor heat outside) and human metabolism.
- Pollution dome: aerosols and greenhouse gases over the city absorb and re-emit outgoing radiation.
- Impervious surfaces shed rain quickly, leaving no moisture for evaporative cooling.
- Characteristics:
- strongest at night and in calm, clear anticyclonic weather
- weakest on windy or cloudy days
- grows with city size and building density
- surface (land) heat islands are stronger by day, air heat islands by night
- India:
- A study of 141 Indian cities (2003–2020) found that urbanisation alone contributed up to 60% of their warming.
- The effect was strongest in fast-growing Tier-II cities of eastern India, such as Jamshedpur, Raipur and Patna.
- Night-time cooling in Delhi, Mumbai, Kolkata and Chennai has weakened as built-up area has spread.
Measures to Reduce Urban Heat Islands in India
| Measure | How it works | Indian example |
|---|---|---|
| Green cover | Shade and evapotranspiration | Nagar Van Yojana (2020) urban forests; Miyawaki plantations |
| Blue infrastructure | Evaporative cooling, cool air flows | Restoring Bengaluru’s lakes; Sabarmati riverfront |
| Cool and reflective roofs | Raise albedo, cut indoor heat | Ahmedabad cool-roof programme (2017); Telangana Cool Roof Policy (2023–2028) |
| Building codes and design | Less heat gain, less air-conditioning | Energy Conservation and Sustainable Building Code; GRIHA |
| Urban form | Ventilation corridors, wider spacing, street orientation to winds | Master-plan green belts |
| Less waste heat | Efficient cooling, public transport | India Cooling Action Plan (2019); metro rail |
| Heat Action Plans | Early warning and protection of the vulnerable | Ahmedabad (2013), the first in South Asia |
Pollution Dome and Urban Plume
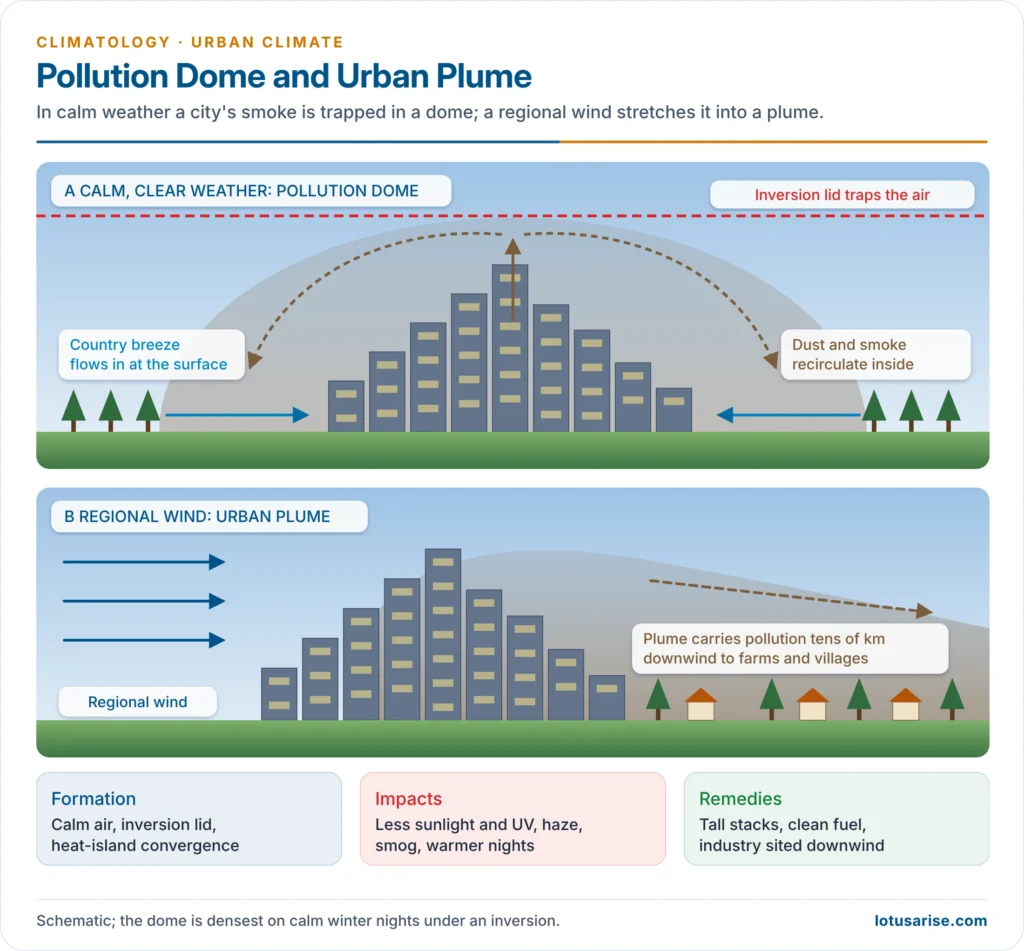
- A pollution (dust) dome is a dome-shaped mass of polluted air (dust, smoke, soot, gases) trapped over a city.
- Formation:
- Under calm, stable conditions, rising warm air over the heat island converges with a gentle inflow from the cooler countryside (the country breeze).
- The air circulates back over the city instead of dispersing.
- A temperature inversion caps the dome, as in Delhi’s winter.
- When a regional wind blows, the dome is stretched downwind into an urban plume, carrying pollution tens of kilometres to rural areas.
- Impacts:
- Less sunlight, especially UV, and shorter sunshine hours
- Poor visibility, haze and smog: London 1952; Delhi in November 2024, when the air quality index reached nearly 500
- Respiratory and heart disease
- Warmer nights, as the dome absorbs outgoing radiation and reinforces the heat island
- More condensation nuclei, hence more fog and some extra rain downwind
- Acid deposition:
- Rain becomes acid at pH below 5.6, as sulphur and nitrogen oxides form acids.
- It corrodes buildings, such as the marble of the Taj Mahal (hence the Taj Trapezium Zone).
- Remedies:
- tall stacks rising above the inversion
- polluting industry sited downwind and away from frequent low inversions
- green buffers
- clean fuels and electric public transport
- India’s National Clean Air Programme (2019) for 131 cities, and the Graded Response Action Plan for Delhi-NCR
Urban Precipitation and Floods
- Cities can increase rainfall and thunderstorms over and downwind of them:
- heat-island convection
- extra condensation nuclei from pollution
- convergence as air slows over rough built surfaces
- The METROMEX experiment at St Louis (1971–1975) documented this downwind increase.
- Urban floods come from heavy rain falling on impervious surfaces, encroached drains and filled wetlands:
- Mumbai, 26 July 2005: 944 mm at Santacruz in 24 hours
- Chennai, December 2015
- Bengaluru, September 2022
Urban Climate and Climate Change
- Cities drive climate change: they consume most energy and produce roughly 70% of energy-related CO2.
- Cities also amplify its impacts:
- Heatwaves stack on the heat island.
- Extreme rainfall overwhelms drains.
- Sea-level rise and storm surges threaten coastal megacities (Mumbai, Kolkata, Chennai).
- Water stress grows (Chennai’s “Day Zero” crisis, 2019).
- Heat Action Plans:
- Ahmedabad’s plan followed the deadly May 2010 heatwave.
- Its colour-coded alerts, cooling centres, hospital preparedness and outreach are estimated to avoid over 1,100 deaths a year.
- The NDMA has asked 23 heat-prone states to prepare similar plans.
- IMD heatwave criteria:
| Region | Threshold maximum temperature | Heatwave | Severe heatwave |
|---|---|---|---|
| Plains | ≥40 °C | 4.5–6.4 °C above normal, or ≥45 °C actual | ≥6.5 °C above normal, or ≥47 °C actual |
| Coastal stations | ≥37 °C | 4.5 °C or more above normal | — |
| Hills | ≥30 °C | as for plains (departure) | as for plains |
- Climate-sensitive urban planning:
- Choose sites with good drainage and ventilation.
- Keep green and blue spaces spread through the city.
- Lay out the city in lines across the prevailing wind, and vary building heights to aid mixing.
- Use reflective materials.
- Protect wetlands and floodplains.
- Build climate risk into master plans (Smart Cities, AMRUT).
Previous Year Questions
2025Describe the causes of the phenomenon of ‘urban heat island’. What are the effective measures to deal with this phenomenon in India?2025While defining the ‘Green architecture’, discuss its principles and challenges in response to climate change in India.2023The urban built environment in big cities of India creates key changes in the biophysical character of the landscape. Discuss.2022What is a pollution dome? Discuss its formation and impacts.2019Explain the nature of urban climates and their impact on global environmental change.2009How does Climate Change affect urban areas?




