

- El Niño and La Niña are the warm and cold phases of the El Niño–Southern Oscillation (ENSO), the strongest year-to-year swing in the Earth’s climate. It is a coupled ocean–atmosphere oscillation of the tropical Pacific.
- The ocean half is the warming or cooling of the central and eastern equatorial Pacific.
- The atmospheric half is the Southern Oscillation, a see-saw of surface pressure between the western and eastern Pacific that strengthens or weakens the trade winds and the Walker circulation.
- ENSO recurs irregularly every 2–7 years. A phase usually lasts 9–12 months, and La Niña often lasts two or three years.
- Through teleconnections it reaches far beyond the Pacific: droughts and floods on every continent, the Indian monsoon, cyclones, fish catches and global temperature.
The Tropical Pacific: Normal, El Niño and La Niña
Normal conditions and the Walker circulation
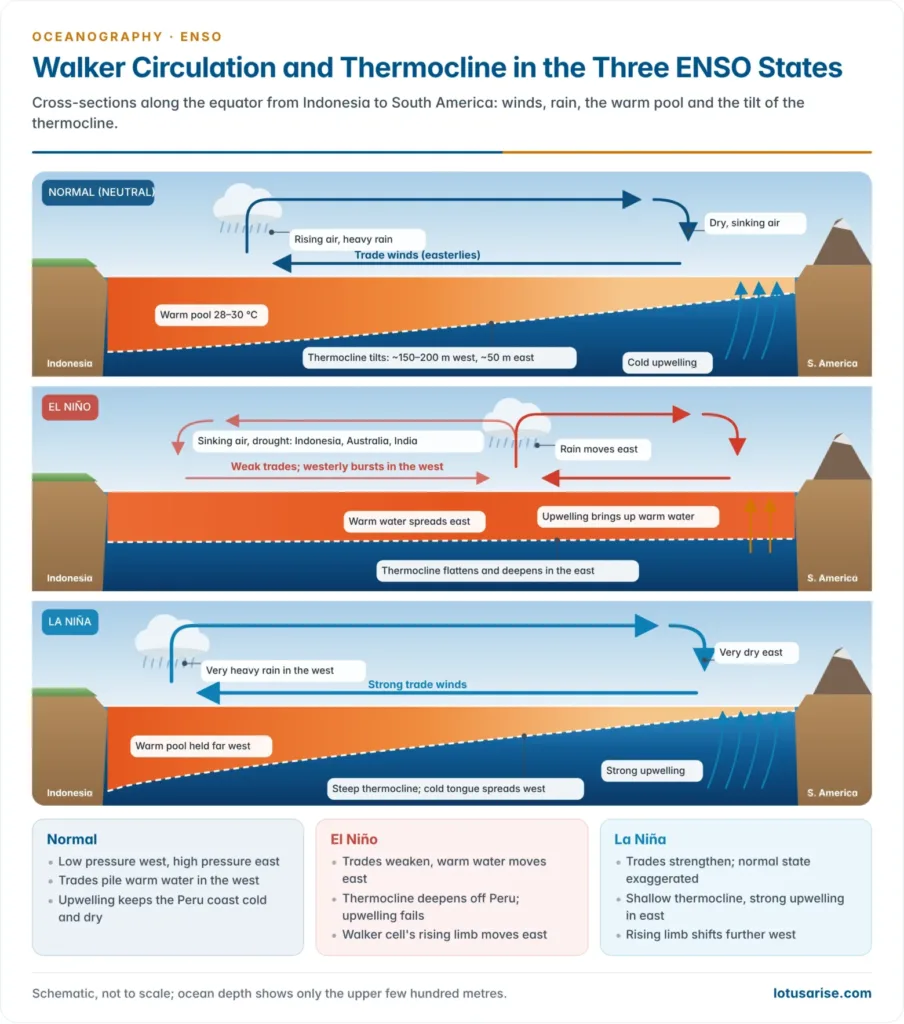
- Surface pressure is low over Indonesia and northern Australia and high over the cold eastern Pacific off Peru, so the south-east trades blow strongly from east to west along the equator.
- The trades drag warm surface water west and pile it up as the Indo-Pacific warm pool, with sea-surface temperatures (SST) above 28–29 °C.
- Sea level in the west stands about half a metre higher than off South America.
- The thermocline, the boundary between warm surface water and cold deep water, tilts across the basin: about 150–200 m deep in the west and only about 50 m in the east.
- Off Peru and Ecuador, offshore winds and the Ekman drift of the cold Peru (Humboldt) Current cause upwelling of cold, nutrient-rich water. It feeds the plankton, the Peruvian anchoveta fishery and the guano birds, and cools a cold tongue that runs west along the equator.
- The Walker circulation closes the loop as an east–west cell along the equator:
- moist air rises over the warm pool, giving deep convection and heavy rain over Indonesia;
- it flows east aloft and sinks over the cool eastern Pacific, keeping the Peruvian and Atacama coast dry;
- it returns west at the surface as the trades.
- The cell was named by Jacob Bjerknes (1969) after Sir Gilbert Thomas Walker, who first described the Southern Oscillation.
- Air and sea reinforce each other. Strong trades keep the east cold, and the east–west SST contrast keeps the pressure gradient, and so the trades, strong. This loop is the Bjerknes feedback.
El Niño: the warm phase
- The name, Spanish for “the (Christ) Child”, was given by fishermen of Peru and Ecuador to a weak warm current that flows south along their coast around Christmas.
- It forms when the Equatorial Counter Current shifts south of the equator between January and March. The Peruvian naval captain Camilo Carrillo reported it to the Lima Geographical Society in 1892.
- The term now means the basin-wide warming that comes only in some years, lasts most of a year and cuts off cold upwelling along the whole coast.
- The sequence of an El Niño:
- The trades weaken, and bursts of westerly wind blow over the western Pacific, often set off by the Madden–Julian Oscillation.
- The piled-up warm water surges east as equatorial Kelvin waves, crossing the Pacific in about two months.
- The thermocline deepens in the east and flattens. Upwelling now draws up warm water, so SST rises by 1–4 °C or more from the date line to Peru.
- Pressure falls over the eastern Pacific and rises over Indonesia and Australia. The trades weaken further: the Bjerknes feedback runs in reverse.
- The rising limb of the Walker circulation shifts east to the central and eastern Pacific, air sinks over Indonesia, Australia and India, and the ITCZ moves south towards the equator.
- How it ends: westward Rossby waves reflect off the western boundary and return as cold, upwelling Kelvin waves (the delayed oscillator of Max Suarez and Paul Schopf, 1988). Meanwhile the warm pool’s heat drains towards the poles and must slowly recharge (the recharge oscillator of Fei-Fei Jin, 1997). The system therefore often swings on into La Niña.
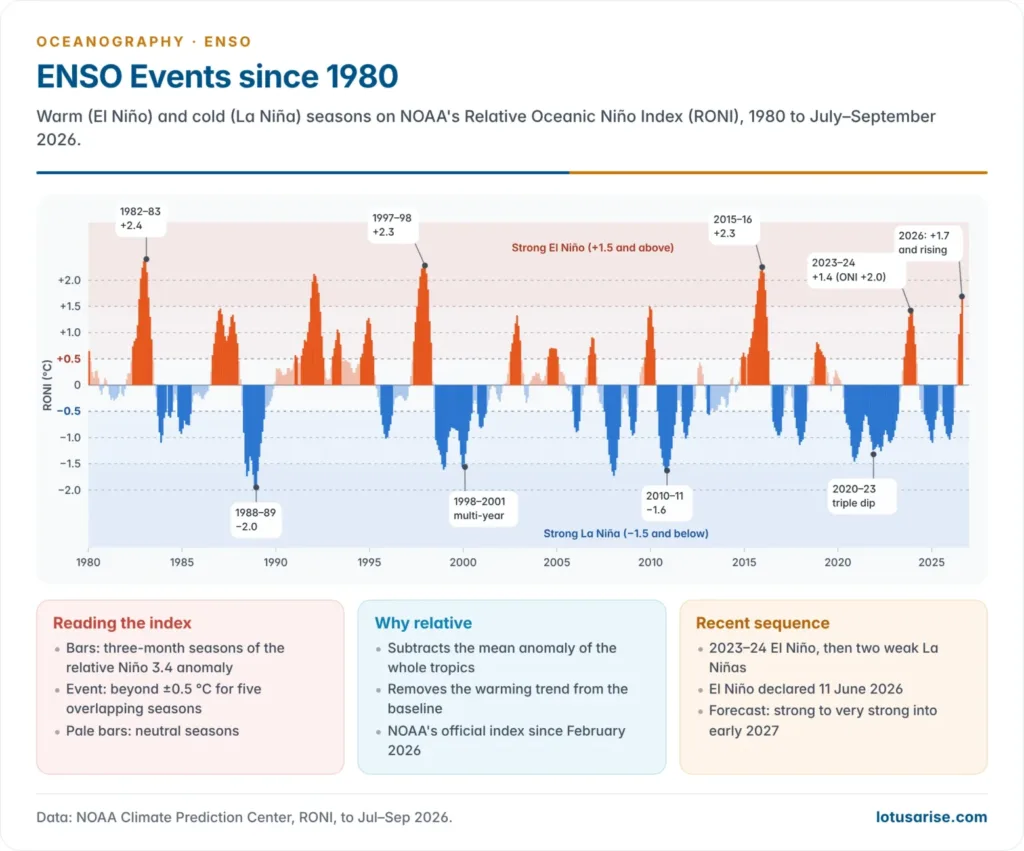
- Strong events: 1972–73, 1982–83, 1997–98 and 2015–16 are among the strongest since 1950. A very strong El Niño is developing in 2026.
Effects along the coast of Peru and Ecuador
- Fisheries collapse. Nutrient-poor warm water starves the plankton, and the anchoveta disperse or die. The fishery, then the world’s largest single-species fishery, collapsed in 1972–73.
- Guano birds that feed on the anchoveta starve or migrate, and plankton blooms cause red tides and mass fish kills.
- The coastal water freshens slightly, from about 35‰ to 33–34‰, as low-salinity equatorial water mixes in.
- The desert coast floods. The equatorial rain belt moves south over normally rainless coasts, as at Trujillo in March 1925 and across northern Peru in 1997–98 and the “coastal El Niño” of 2017.
- The rain greens the desert and can bring good harvests of cotton, rice and bananas, but the loss at sea outweighs the gain on land.
La Niña: the cold phase
- La Niña (“the girl”) is the opposite phase, an exaggerated normal state. The term was proposed by S. George Philander (1985).
- The trades strengthen, the thermocline shoals in the east, upwelling intensifies, and the cold tongue extends further west, with SST 0.5–2 °C below normal over the central and eastern Pacific.
- The rising limb of the Walker circulation shifts further west, over the maritime continent. Rain increases over Indonesia, northern Australia and South Asia, and the eastern Pacific grows drier.
- La Niña often follows a strong El Niño and tends to persist. Multi-year La Niñas occurred in 1998–2001 and 2020–23, the latter a rare “triple dip” across three northern winters.
The three states compared
| Feature | Normal (neutral) | El Niño | La Niña |
|---|---|---|---|
| Trade winds | Moderate easterlies | Weak; westerly bursts | Strong |
| SST, central–eastern Pacific | Cool tongue | Warmer than normal | Colder than normal |
| Thermocline | Deep west, shallow east | Flatter; deep in east | Steeper; very shallow in east |
| Upwelling off Peru | Normal | Weak or warm | Strong |
| Rising limb of Walker cell | Indonesia, western Pacific | Central–eastern Pacific | Further west |
| Southern Oscillation Index | Near zero | Strongly negative | Strongly positive |
| Rain | West wet, east dry | East wet, west dry | West very wet, east very dry |
ENSO: the Southern Oscillation, Indices and Forecasting
The Southern Oscillation and ENSO
- Sir Gilbert Thomas Walker, Director-General of Observatories in India (1904–24), searched world weather records for predictors of the monsoon after the famines of 1877 and 1899. In 1924 he named the Southern Oscillation.
- It is a see-saw of surface pressure: when pressure is high over the Indian Ocean and Indonesia, it is low over the south-east Pacific, and the reverse.
- He tied it to monsoon rainfall and used it in seasonal forecasts, but could not explain its cause.
- Jacob Bjerknes (1969) supplied the link: the pressure see-saw and the warm water off Peru are two faces of one coupled system, joined by the Walker circulation. Hence the joint name ENSO.
- The Southern Oscillation Index (SOI) is the standardised pressure difference Tahiti minus Darwin. Tahiti represents the eastern Pacific high, and Darwin, in northern Australia, the western Pacific low.
- A sustained negative SOI (below about −7 on the Australian scale) means weak trades and El Niño.
- A sustained positive SOI (above about +7) means strong trades and La Niña.
Measuring ENSO: Niño regions, ONI and RONI
- The ocean half is measured by SST anomalies in four Niño boxes along the equator:
| Box | Location | Use |
|---|---|---|
| Niño 1+2 | 0–10°S, 90–80°W | Coastal Peru; “coastal El Niño” |
| Niño 3 | 5°N–5°S, 150–90°W | Eastern Pacific |
| Niño 3.4 | 5°N–5°S, 170–120°W | Main index box |
| Niño 4 | 5°N–5°S, 160°E–150°W | Central Pacific, near the date line |
- The Oceanic Niño Index (ONI) is the three-month running mean of the Niño 3.4 SST anomaly.
- An El Niño needs +0.5 °C or more, and a La Niña −0.5 °C or less, for five consecutive overlapping seasons.
- By convention, events are weak (0.5–0.9 °C), moderate (1.0–1.4), strong (1.5–1.9) or very strong (2.0 and above).
- From 1 February 2026, NOAA uses the Relative Oceanic Niño Index (RONI).
- It subtracts the mean SST anomaly of the whole tropics (20°N–20°S) from the Niño 3.4 anomaly and rescales the result. The ±0.5 °C thresholds stay.
- The reason is global warming: it lifts all tropical SSTs, so a fixed 30-year baseline drifts. ENSO is about the contrast between the Pacific and the rest of the tropics, not absolute warmth.
- The change re-grades some events. The 2023–24 El Niño peaks at about +2.0 °C on the ONI but only about +1.4 °C on the RONI, because the whole tropical ocean was unusually warm.
Monitoring and forecasting
- The unforeseen 1982–83 event led to the Tropical Ocean–Global Atmosphere (TOGA) programme (1985–94), which built the TAO array of about 70 moored buoys across the equatorial Pacific.
- Argo floats, satellite altimetry (sea-level bulges trace the Kelvin waves) and satellite SST and wind data now track the system continuously. In the Indian Ocean, INCOIS is a partner in the RAMA moored array.
- Forecasts:
- NOAA’s Climate Prediction Center runs the ENSO Alert System: a Watch when an event is favoured within six months, an Advisory once it exists, and a Final Advisory when it ends.
- The India Meteorological Department (IMD) builds ENSO and IOD outlooks into its long-range monsoon forecast (April, updated in late May), using the Monsoon Mission Coupled Forecasting System developed with IITM, Pune.
- Forecasts made before the northern spring are the least reliable. This spring predictability barrier arises because the east–west contrast is weakest then, so small disturbances can tip the system either way.
El Niño Modoki, the Indian Ocean Dipole and the MJO
El Niño Modoki
- El Niño Modoki was defined by Karumuri Ashok, Swadhin Behera, Suryachandra Rao, Hengyi Weng and Toshio Yamagata (2007). Modoki is Japanese for “similar but different”.
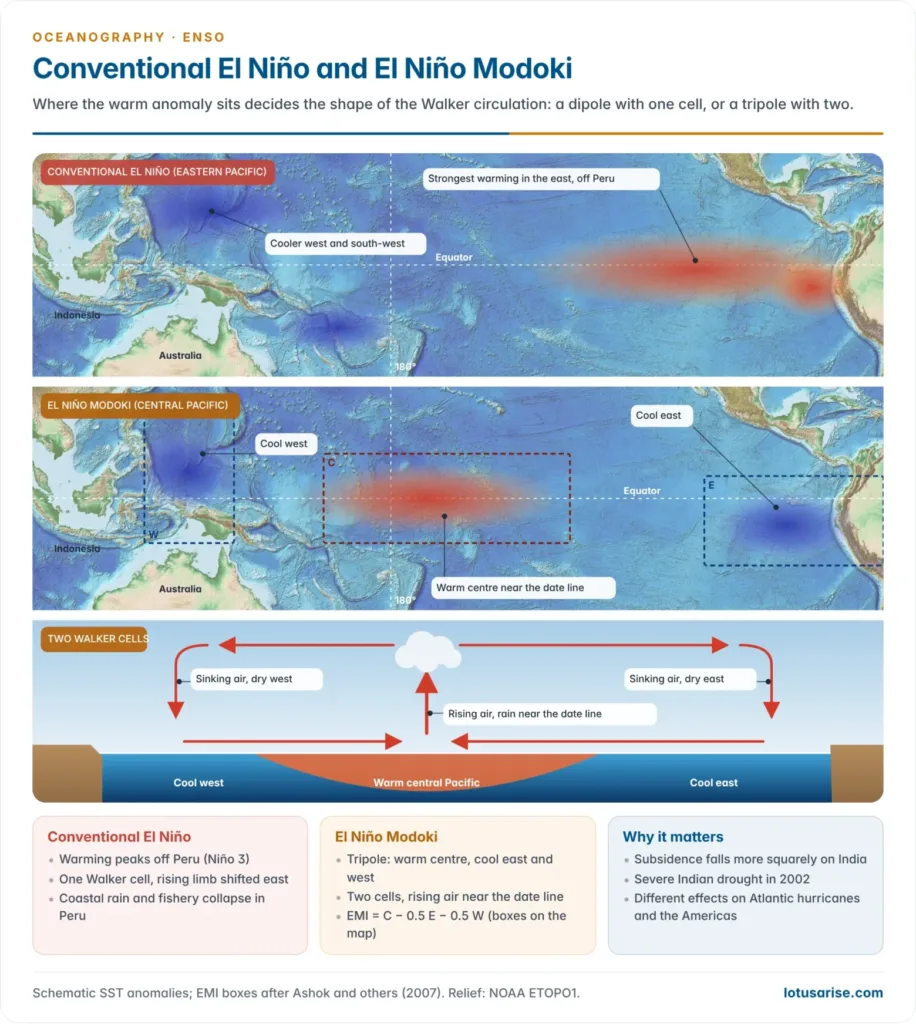
- The central equatorial Pacific warms while the eastern and western Pacific stay cooler than normal: a tripole of SST anomalies, not the east–west dipole of a conventional El Niño.
- It is also called the central-Pacific, warm-pool or date-line El Niño.
- Two Walker cells form in place of one: air rises over the warm central Pacific and sinks over both the western and the eastern Pacific.
- Its index, the El Niño Modoki Index (EMI), is the SST anomaly of a central box minus half the anomalies of an eastern and a western box.
- Typical Modoki years are 1994, 2002 and 2004; such events seem to have become more frequent since the 1990s.
- Its remote effects differ from, and sometimes oppose, those of a conventional El Niño:
- India: central-Pacific warming focuses subsidence more squarely over India, so it can bring severe drought, as in 2002. K. Krishna Kumar and colleagues (2006) showed that El Niños with the warmest water in the central Pacific are the likeliest to cause monsoon failure.
- Atlantic: Modoki years tend to bring more Atlantic hurricanes, while eastern El Niños suppress them.
- A mirror La Niña Modoki has a cool central Pacific flanked by warm water.
| Feature | Conventional (eastern-Pacific) El Niño | El Niño Modoki (central-Pacific) |
|---|---|---|
| Warmest SST anomaly | Eastern Pacific, off Peru | Central Pacific, near the date line |
| SST pattern | East–west dipole | Tripole: cool west, warm centre, cool east |
| Walker circulation | One cell, rising limb shifted east | Two cells, rising limb in the centre |
| Peru coast | Warm, wet, poor fishery | Little warming; often dry |
| Index | Niño 3 or Niño 3.4 | El Niño Modoki Index (EMI) |
| Indian monsoon | Weakened | Often weakened more |
The Indian Ocean Dipole and ENSO
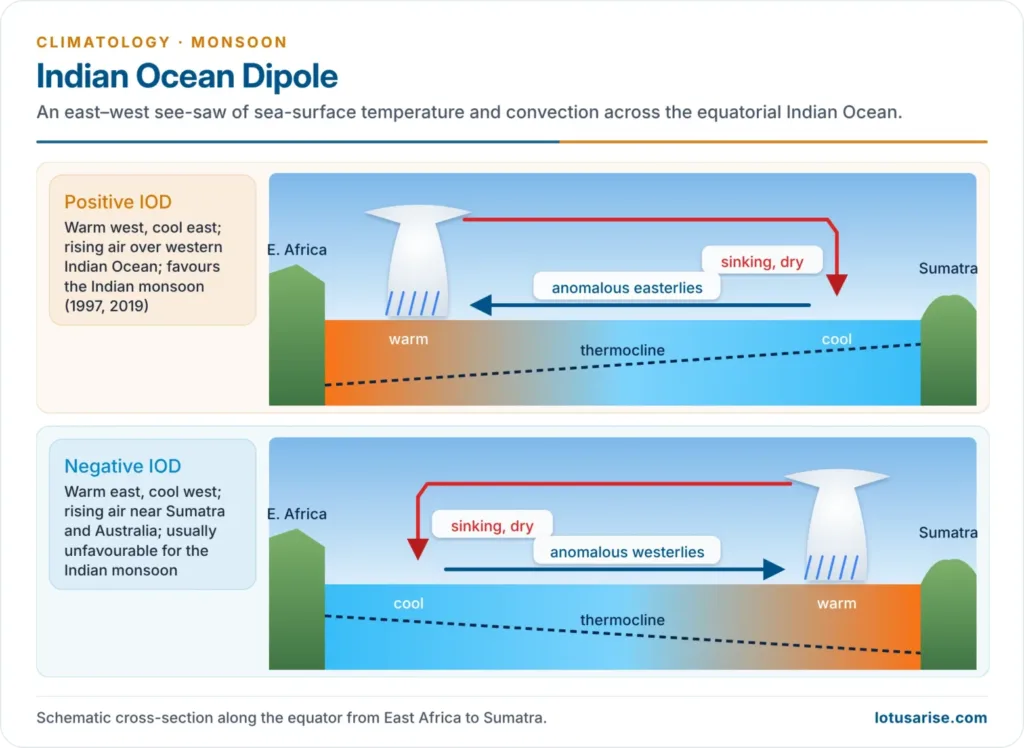
- The Indian Ocean Dipole (IOD), described in 1999, is the SST difference between the western equatorial Indian Ocean (50–70°E) and the eastern Indian Ocean off Sumatra and Java (90–110°E).
- Positive IOD: easterly wind anomalies along the equator push warm water west and bring cool upwelling off Sumatra. Convection moves west, which favours the Indian monsoon and dries Indonesia and Australia.
- Negative IOD: warm east and cool west, generally unfavourable for the monsoon.
- It usually grows in June–August and peaks in September–November.
- It explains why the El Niño–monsoon link fails in some years. A positive IOD offset the strong El Niño of 1997, when the monsoon was about 102% of normal, and lifted 2019 to about 110%.
- El Niño and a positive IOD often coincide, because sinking air over Indonesia during El Niño drives easterly anomalies over the eastern Indian Ocean.
- A positive IOD warms the Arabian Sea and favours Arabian Sea cyclones (an exceptional five cyclonic storms in 2019). A negative IOD favours the Bay of Bengal.
- Its atmospheric partner is the Equatorial Indian Ocean Oscillation (EQUINOO), a see-saw of convection across the equatorial Indian Ocean.
Madden–Julian Oscillation (MJO)
- The MJO, described by Roland Madden and Paul Julian (1971–72), is the main intraseasonal (30–60 day) mode of the tropics: an eastward-moving pulse of cloud and rain with dry, suppressed zones on either side. Its progress is tracked through eight phases, from the Indian Ocean (phases 2–3) across the maritime continent and the Pacific.
- An MJO over the Indian Ocean favours monsoon onset, active spells and cyclogenesis; when it moves on to the Pacific, India tends to see break spells.
- Its westerly wind bursts over the western Pacific can trigger or strengthen an El Niño.
Impacts of ENSO
El Niño, La Niña and the Indian monsoon
- El Niño and the Indian summer monsoon are inversely related. The shifted Walker circulation makes air sink over the subcontinent and weakens the Tibetan High and the tropical easterly jet.
- Many of India’s worst droughts fell in El Niño years: 1877, 1899, 1918, 1972, 1987, 2002 (81% of the long-period average), 2009 (78%) and 2015 (86%).
- 2023: a below-normal monsoon (about 94%) and the driest August since 1901.
- 2026: with El Niño strengthening through the season, the monsoon ended at 759.4 mm, about 87% of the long-period average, the weakest since 2015.
- The link is probabilistic, not fixed.
- K. Krishna Kumar, Balaji Rajagopalan and Mark Cane (1999) found that the correlation weakened after about 1980, as the Indian Ocean and Eurasia warmed.
- Modoki events, the IOD, the EQUINOO, the MJO and an Atlantic Niño (a warm eastern equatorial Atlantic) can each strengthen or cancel the El Niño signal, which makes the relationship harder to read under global warming.
- La Niña years usually bring a normal or above-normal south-west monsoon, as in 2010 and 2020–22. But La Niña tends to weaken the north-east (winter) monsoon over Tamil Nadu, which El Niño often strengthens.
- Economic effects: a weak monsoon cuts kharif output (rice, pulses, oilseeds, cotton, sugarcane), lowers reservoirs and hydropower, and pushes up food inflation. About half of India’s net sown area is rain-fed, so the monsoon still moves rural incomes and growth. El Niño years also bring harsher pre-monsoon heatwaves.
Global impacts
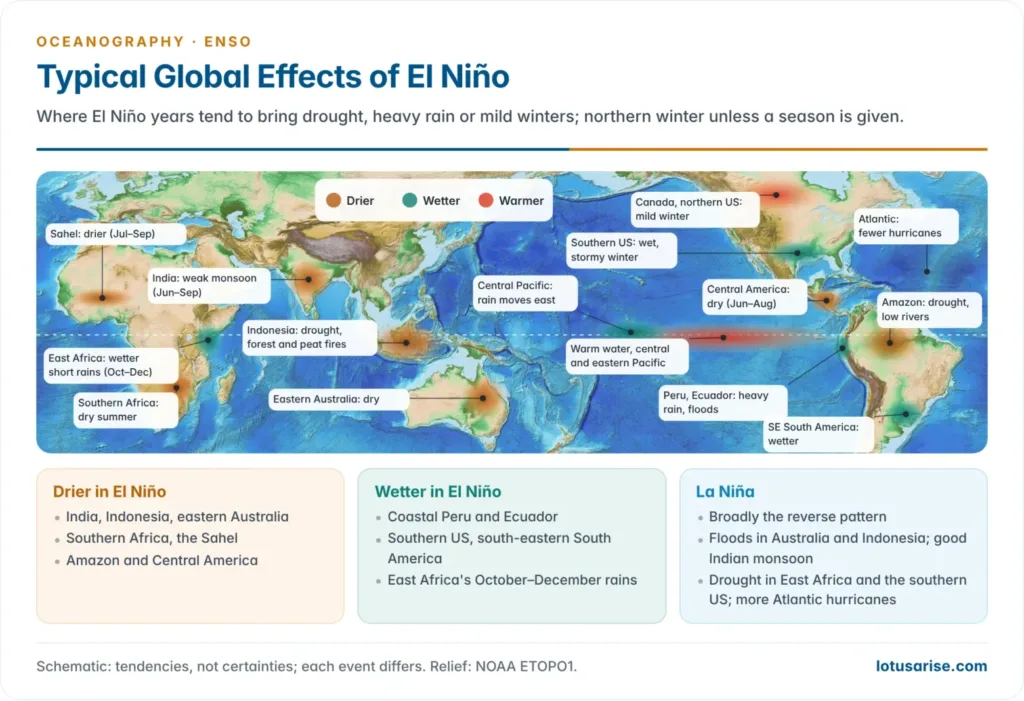
- ENSO reorganises tropical convection, and atmospheric waves carry its influence into the mid-latitudes. The effects are tendencies, not certainties, and vary with the season.
| Region | El Niño (warm phase) | La Niña (cold phase) |
|---|---|---|
| Peru, Ecuador | Heavy rain, floods, fishery collapse | Dry coast; rich fishery |
| Indonesia, Australia | Drought, bush and peat fires (1997–98, 2015) | Floods (Queensland 2010–11; eastern Australia 2022) |
| India, South Asia | Weak summer monsoon, heat | Good summer monsoon |
| Southern Africa | Drought (2015–16, 2024) | Wetter summer |
| East Africa | Wetter short rains (October–December) | Drought (failed rains 2020–23) |
| Sahel, West Africa | Drier (1972, 1983) | Wetter |
| Southern US, northern Mexico | Wet, stormy winter | Dry winter |
| Amazon, Central America | Drought, low rivers, fires | Wetter |
| Atlantic hurricanes | Suppressed by wind shear | More frequent |
| Global mean temperature | Rises about 0.1–0.2 °C the next year | Slight cooling |
- El Niño heat also drives mass coral bleaching (1998, 2010, 2014–17 and the fourth global event from 2023) and shifts tuna and other fish across the Pacific.
Recent events (2023–2026)
- 2023–24 El Niño: declared in June 2023, it peaked in the winter of 2023–24 and ended by mid-2024.
- On top of global warming it helped make 2023 and 2024 the two warmest years on record; 2024 was the first calendar year more than 1.5 °C above pre-industrial levels.
- It brought a record Amazon drought and shipping limits on the Panama Canal (2023), a severe southern African drought (2024), the fourth global coral-bleaching event and a below-normal Indian monsoon.
- 2024–25 and 2025–26: two weak La Niñas, from late 2024 to March 2025 and from about October 2025 to April 2026. In between, ENSO-neutral conditions gave India a strong monsoon (108% of the long-period average in 2025).
- 2026–27 El Niño: an El Niño Watch was issued in March 2026 and El Niño was declared on 11 June 2026.
- By October 2026 the monthly Niño 3.4 anomaly had reached +2.1 °C, with anomalies above +4 °C in parts of the eastern Pacific and a strongly negative SOI.
- NOAA puts the chance of a strong-to-very strong event through January–March 2027 above 83%, and gives even odds or better of a record event (RONI above +2.5 °C) in late 2026.
ENSO in a warming world
- The IPCC (2021) assesses that ENSO will very likely remain the dominant mode of year-to-year variability, and that ENSO-related rainfall swings will very likely grow by the second half of the century, because a warmer, moister atmosphere responds more strongly. Models still disagree on whether the SST swings themselves will grow.
- Under global warming, each strong El Niño lifts an already warmer baseline, so El Niño years tend to set new global heat records and deepen the stress on ocean temperature, coral reefs, drought and fire.
Previous Year Questions
2026The relationship between El Niño and the Indian monsoon is becoming complex under the conditions of global warming. Critically examine.2008Discuss the mechanism and origin of Monsoon winds & explain the role of El Nino on Monsoon circulation.





Please upload remaining human geography article soon
Can I solely rely on these notes for geo prelims and GS?
Yes. It convers the whole syllabus except Human geography. You can read that from Ncert.
Thanks
👍