

- Ocean temperature varies horizontally, with latitude, currents, winds and the shape of the basins, and vertically, from a warm surface layer through the thermocline to near-freezing deep water.
- It matters far beyond the sea:
- with salinity it sets the density of seawater, and so the sinking and spreading of water masses;
- it controls evaporation and the supply of heat and moisture to the air, and so coastal climates, cyclones and the monsoon;
- it fixes where marine life can live and how productive the water is.
- Water has a very high specific heat. The top 3–4 m of the ocean can hold as much heat as the whole atmosphere, so the sea warms and cools slowly and acts as the planet’s heat store.
Heat in the Ocean
Sources of heat and heat loss
- The sun is almost the only source of ocean heat. Water reflects little sunlight when the sun is high (an albedo of about 6–7%), so most of the energy reaching the sea is absorbed.
- Minor sources add very little: heat conducted through the floor from the Earth’s interior (mainly at ridges and vents), sensible heat from warmer air, condensation on the sea surface, the friction of winds, waves and tides, and chemical, biological and radioactive processes.
- Heat is lost in three main ways:
- long-wave back radiation from the sea surface;
- evaporation, the largest single loss;
- conduction of sensible heat to colder air above.
- The balance of gains and losses is the ocean heat budget. Low latitudes gain more than they lose and high latitudes lose more than they gain, so currents must carry heat poleward. The temperature pattern described below is the outcome of that budget.
Measuring ocean temperature
- Reversing thermometers (accurate to about ±0.02 °C), the bathythermograph and later the CTD (conductivity–temperature–depth) probe gave the first subsurface readings.
- Satellites with infrared and microwave radiometers now map sea surface temperature (SST) daily, though they see only the skin of the sea.
- About 4,000 robotic Argo floats, the core of modern ocean observing programmes, profile the upper 2,000 m every ten days. India deploys floats in the Indian Ocean, and the Indian National Centre for Ocean Information Services (INCOIS) runs a regional Argo data centre.
Factors controlling ocean temperature
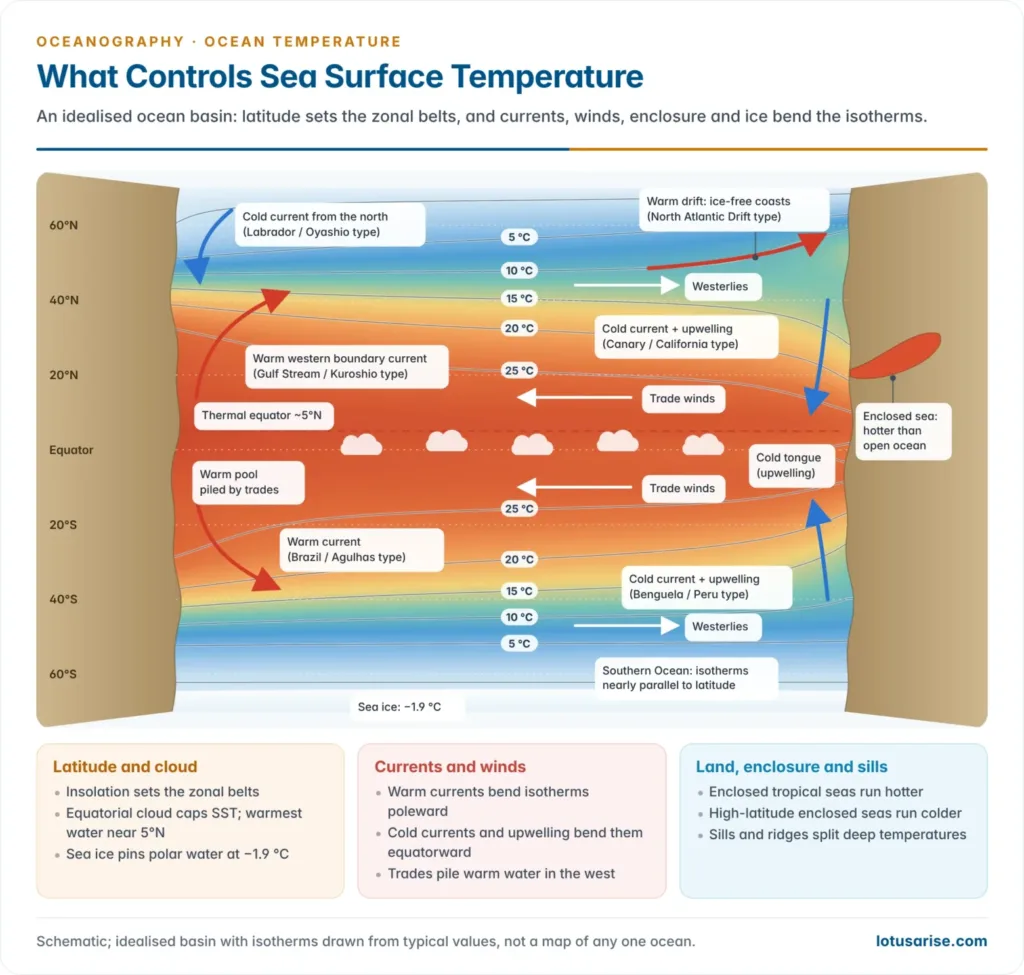
- Latitude and insolation are the master control. Towards the poles the sun’s rays strike more obliquely, pass through more atmosphere and spread over a larger area, and more light is reflected, so SST falls poleward.
- Cloud and local weather modify the pattern.
- Cloud and daily rain over the equator cut incoming sunlight, while the clear skies of the subtropical highs let more through.
- Cyclones stir the water and leave a cold wake a few degrees cooler along their track.
- Ocean currents move heat across latitudes.
- Warm currents carry tropical heat poleward. Thanks to the North Atlantic Drift, the Norwegian coast and Murmansk, north of the Arctic Circle, stay ice-free in winter.
- Cold currents chill the coasts they wash: the Labrador, Oyashio, Peru, California, Canary and Benguela currents.
- Prevailing winds and upwelling create east–west contrasts.
- Offshore winds drive surface water away from the coast, and cold water upwells to replace it. The trades do this off Peru, California and north-west and south-west Africa, and the south-west monsoon off Somalia and Oman.
- Onshore winds pile warm water against the coast. Driven by the trades, it piles up in the western Pacific and off Brazil, so the western sides of tropical oceans are warmer. In mid-latitudes the westerlies favour the eastern margins instead.
- Land and water distribution makes the land-dominated north less regular than the water-dominated south. Hot desert winds warm the Red Sea and Persian Gulf; cold winter winds chill the Baltic and North Seas.
- Shape and enclosure of the sea matter. Small, shallow seas heat and cool faster, and submarine ridges and sills block the exchange of deep water.
- Salinity and stratification: a fresh surface layer, as in the Bay of Bengal, resists mixing and traps heat near the surface.
- Sea ice pins the polar surface at the freezing point of seawater, about −1.9 °C, and reflects most sunlight.
| Factor | Effect on surface temperature | Example |
|---|---|---|
| Latitude and insolation | Falls from about 27 °C at the equator to −1.9 °C under ice | Zonal SST belts |
| Cloud and rain | Caps equatorial SST | Doldrums |
| Warm currents | Isotherms bend poleward | Gulf Stream, Kuroshio, Agulhas |
| Cold currents, upwelling | Isotherms bend equatorward | Peru, Benguela, Somali coast |
| Winds | Warm water piled downwind | Western Pacific warm pool |
| Enclosure and land | Hot tropical seas; cold high-latitude seas | Red Sea, Persian Gulf; Baltic |
| Sills and ridges | Different deep temperatures on two sides | Bab-el-Mandeb, Gibraltar |
Horizontal Distribution of Temperature
The latitudinal pattern
- Surface isotherms run roughly east–west, parallel to the latitudes, because insolation is the main control.
- Mean surface temperature falls from about 27 °C near the equator to about 22–23 °C at 20°, 14 °C at 40°, close to 1 °C at 60° in the Southern Ocean, and −1.9 °C under polar ice.
- The fall is slow in the tropics and steep in mid-latitudes. Isotherms crowd into oceanic fronts where warm and cold currents meet, as off Newfoundland and Japan.
- The warmest open water is not on the equator.
- The Indo-Pacific warm pool stays above 28 °C and peaks near 30 °C.
- The Persian Gulf and southern Red Sea exceed 32 °C in summer.
- The thermal equator, the line of highest SST, lies on average near 5°N and migrates with the seasons.
- The sea surface is usually slightly warmer than the air above, so the ocean heats the lower atmosphere. Where warm air crosses cold water, sea fog forms, as over the Grand Banks.
The northern and southern hemispheres
- At the same latitude, Northern Hemisphere oceans are warmer. Classical estimates give mean surface temperatures of about 19.4 °C for the northern oceans, 16.1 °C for the southern and 17.2 °C for the world ocean.
- Four reasons explain the contrast:
- the Atlantic overturning carries heat northward across the equator, which also holds the thermal equator north of the equator;
- the Southern Ocean is open to Antarctica, so cold water circulates freely round the ice continent;
- submarine ridges such as the Greenland–Scotland Ridge and the narrow outlets of the Arctic keep most Arctic cold water out of the northern oceans;
- large northern landmasses heat the seas they enclose in summer.
- Isotherms are irregular in the north, bent by land and boundary currents, and nearly parallel to the latitudes in the open Southern Ocean.
Seasonal isotherms: February and August
- Surface temperatures lag the sun. In the Northern Hemisphere the maximum comes in August and the minimum in February; the south reverses this.
- In the northern winter the warm belt above about 25 °C lies mostly south of the equator. In the northern summer it shifts north towards 40°N and northern isotherms bulge poleward, while southern ones stay regular.
- Every basin shows the same bends. Isotherms are pushed poleward along western margins by warm currents and pulled equatorward along eastern margins by cold currents and upwelling.
Atlantic and Pacific
- The Gulf Stream and North Atlantic Drift drive isotherms far north along Europe. Waters off northern Norway stay above freezing in winter, while the Labrador coast, much further south, is ice-bound.
- Off Newfoundland, where the Gulf Stream meets the cold Labrador Current, isotherms pack into a sharp front.
- In the South Atlantic the warm Brazil Current bends isotherms south and the cold Benguela Current bends them north.
- The western equatorial Pacific holds the warmest open water on Earth, while a cold tongue of upwelled water stretches west from Peru along the equator.
- The Kuroshio meets the cold Oyashio off Hokkaido, forming the Pacific counterpart of the Newfoundland front.
- In El Niño years the cold tongue weakens and warm water spreads east, with SST anomalies of several degrees.
Indian Ocean
- The northern Indian Ocean is closed by Asia at about 25°N, and the monsoon reverses its winds. Its temperatures therefore follow a pattern found in no other ocean.
- April–May is the warmest season. The Bay of Bengal and Arabian Sea exceed 30 °C, and a mini warm pool forms off Kerala just before the monsoon sets in.
- In the south-west monsoon upwelling off Somalia and Oman cools the western Arabian Sea sharply.
- The Arabian Sea therefore has two maxima (May and, more weakly, October–November) and two minima (August and January–February).
- The Bay of Bengal stays above about 28 °C for much of the year. River water and rain make a fresh, light surface layer that resists mixing and keeps heat near the surface, favouring cyclones and monsoon depressions.
- The warm Agulhas Current runs down south-east Africa; the cold West Australian Current bends isotherms equatorward off Australia.
Diurnal and annual range
- Diurnal range is small, usually 0.2–0.5 °C, and about 1 °C on calm, clear days.
- The maximum comes about 2 p.m. and the minimum about 4–5 a.m. Clear skies and light winds widen the range; cloud and strong winds narrow it.
- It is felt only in the top 10–15 m.
- Annual range is far smaller than on land and varies with setting. It is greater in the North Atlantic and North Pacific, where cold, dry winter winds blow off the continents, than at the same latitudes in the south.
- Annual variation fades with depth and is usually traced to about 100–200 m, locally 300 m.
| Setting | Typical annual range | Main cause |
|---|---|---|
| Tropical open ocean | 1–3 °C | Steady insolation |
| Mid-latitude open ocean | 5–8 °C | Seasonal insolation; winter winds off land |
| Western boundary fronts (Newfoundland, Japan) | Above 10 °C, locally 15 °C | Seasonal shift of warm and cold currents |
| Upwelling coasts (California, West Africa) | 8–10 °C | Seasonal upwelling |
| Shallow enclosed seas (Baltic, Black Sea, Persian Gulf) | 14 °C or more | Surrounding land |
| Polar seas | 1–2 °C | Ice holds the surface near freezing |
Vertical Distribution of Temperature
Light and heat with depth
- Sunlight is absorbed rapidly. The red and infrared part is used up in the top metre, which takes roughly half the incoming energy, and only about a sixth reaches 10 m.
- Even in clear water only about 1% of surface light reaches 100–150 m, the base of the photic (euphotic) zone. Below lies the dark aphotic zone.
- Winds, waves and convection spread surface heat down through the top layer. Below it, water warms only by slow mixing, so temperature falls with depth, steeply in the upper few hundred metres and very slowly below 1,000–2,000 m.
- Most of the ocean is cold: the average temperature of the whole world ocean is below 4 °C.
The three-layer structure
- In low and middle latitudes the water column has three thermal layers:
- Mixed (surface) layer
- Stirred by wind and waves, it is nearly uniform in temperature: 20–29 °C in the tropics, cooler further poleward.
- It is usually 20–200 m thick: shallow in the trade-wind tropics, deepest in stormy mid-latitude winters.
- Thermocline
- Here temperature falls rapidly with depth, typically from about 200 m to 1,000 m. Cold water is denser, so it is also a pycnocline.
- Its strong stratification is a barrier to mixing. It keeps nutrient-rich deep water away from the sunlit surface, which is why open tropical oceans are biologically poor.
- Deep layer
- Below about 1,000 m, temperature falls very slowly to between about 4 °C and 0 °C near the floor. Roughly three-quarters of the ocean’s water lies here.
- The coldest water masses, near 0 °C, form around Antarctica and in the far North Atlantic and spread along the floor towards the equator.
- Mixed (surface) layer
| Thermocline | Depth | Where and when | Cause |
|---|---|---|---|
| Diurnal | Top 10–15 m | Calm, sunny days | Daytime heating of a thin layer |
| Seasonal | About 40–100 m | Mid-latitude summers; erased by winter mixing | Summer heating over a shallow mixed layer |
| Permanent (main) | About 200–1,000 m | All year in tropics and subtropics; absent near the poles | Warm water floating over cold deep water |
- An older scheme, after Albert Defant, divides the column into an oceanic troposphere and an oceanic stratosphere.
- The troposphere runs from the surface to the base of the main thermocline (about 600–1,000 m) and is warm and well stirred. The stratosphere below is cold and nearly uniform.
- In sub-polar seas the troposphere thins out and the cold stratosphere reaches the surface.
Profiles at different latitudes
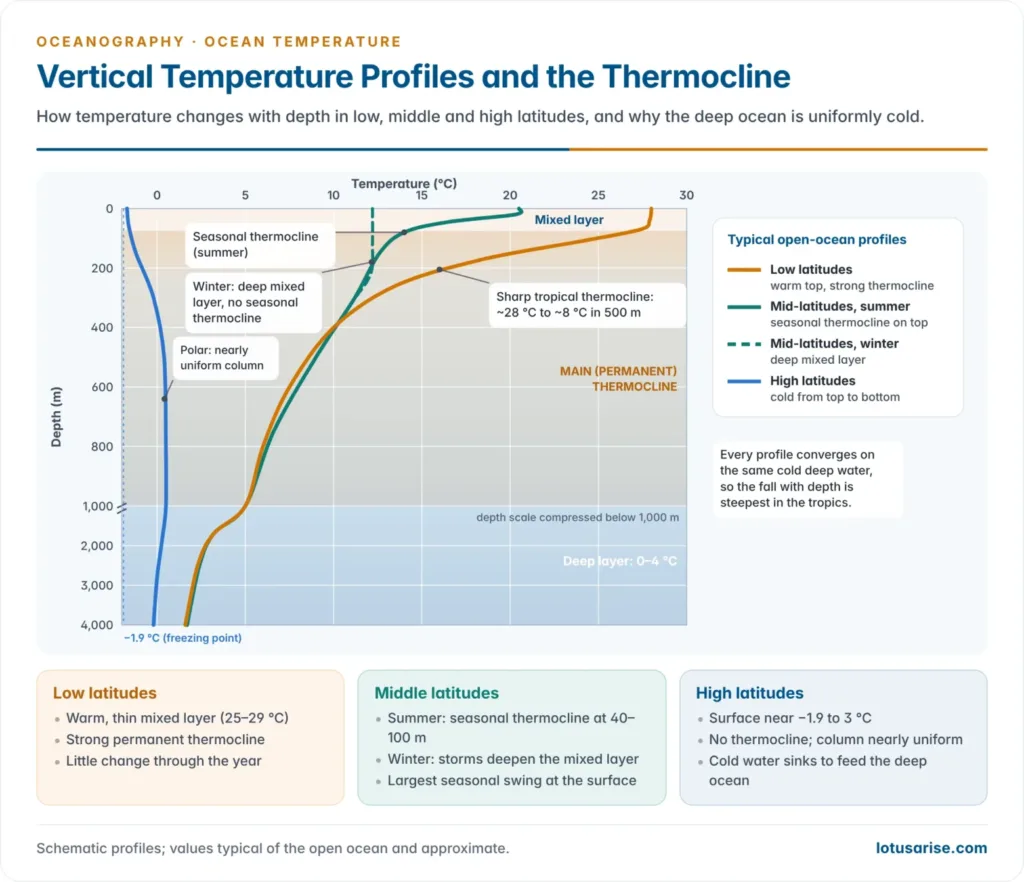
- Low latitudes: a warm surface (about 25–29 °C) over a strong, shallow thermocline. The vertical drop is greatest here, and the profile changes little through the year.
- Middle latitudes: a seasonal thermocline forms in summer above the weaker permanent one. Winter storms and cooling deepen the mixed layer and erase it, so the seasonal swing at the surface (8–15 °C) is the largest of the three zones.
- High latitudes: the surface (about −1.9 °C to 3 °C) is almost as cold as the deep water, so there is no thermocline and the column is nearly uniform.
- With weak stratification, cold surface water can sink and nutrient-rich water can mix upward. This is why polar seas are productive and why they feed the deep water masses.
- Deep temperatures are similar everywhere. Water at 100 m near 7°N is about as warm as the surface near 40°N, and water at about 800 m there matches the surface near 60°N. So the rate of fall with depth increases towards the equator.
Departures from the normal profile
- Upwelling makes the surface cold, so the drop with depth is small. Where onshore winds pile up warm water, the drop is large.
- The thermocline tilts across the equatorial Pacific. It lies at about 150–200 m in the west, under the warm pool, and at about 50 m in the east, where upwelling lifts it. El Niño flattens the tilt.
- Mode waters are thick layers of uniform temperature. In the Sargasso Sea, about 18 °C water (“Eighteen Degree Water”) reaches some 400–500 m down.
- Temperature inversions (warmer water beneath colder) occur where cold, fresh surface water lies over saltier water that stays dense despite being warmer.
- In the Arctic Ocean, water at about −1.8 °C overlies an Atlantic layer above 0 °C at a few hundred metres.
- The Bay of Bengal shows winter inversions under its fresh surface layer.
- Potential temperature corrects for pressure. Seawater warms slightly when compressed, so in the deepest trenches the measured temperature rises a little towards the floor. Oceanographers use potential temperature, the value a parcel would have if raised adiabatically to the surface.
Enclosed and partially enclosed seas
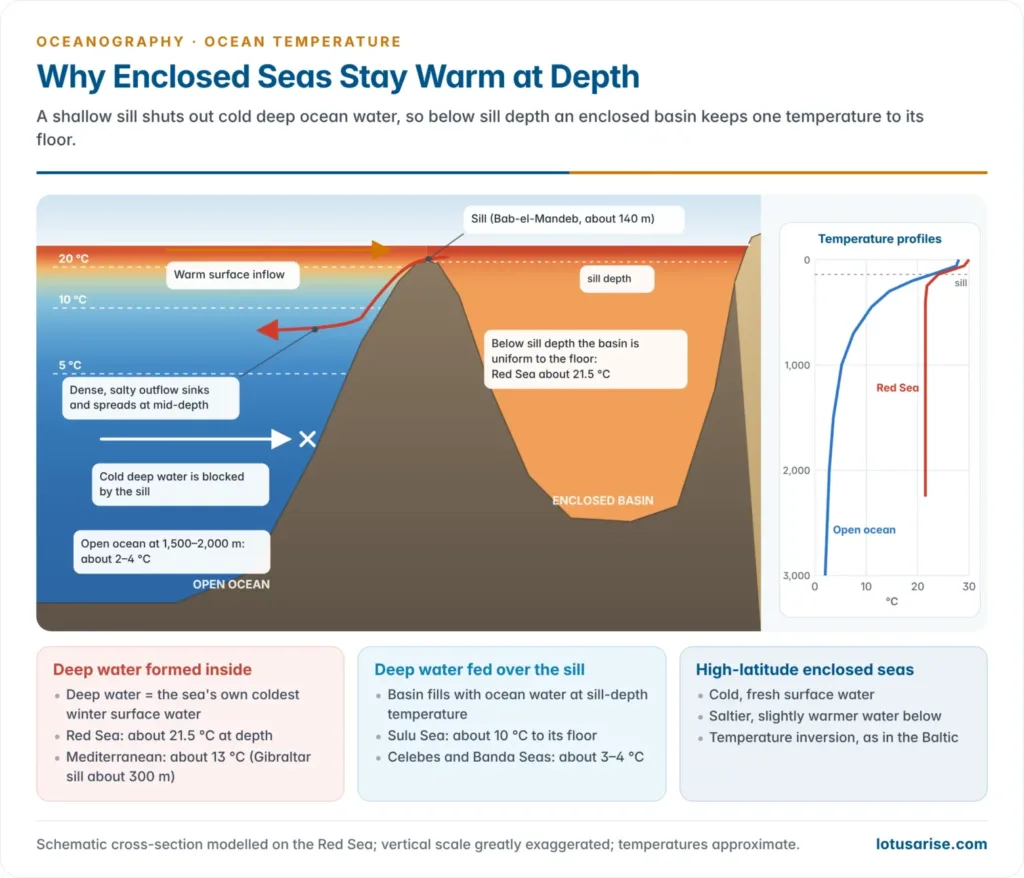
- At the surface, enclosed seas follow the surrounding land. In low latitudes they are warmer than the open ocean (Red Sea, Persian Gulf); in high latitudes they are colder (the Baltic and Hudson Bay freeze in winter).
- At depth, the sill decides. Open-ocean water colder than the sill-depth temperature cannot enter, so below sill depth the temperature stays almost constant to the floor.
- Albert Defant recognised two types:
- Deep water formed inside the basin. The deep water takes the sea’s own lowest winter surface temperature, as cooled surface water sinks.
- The Red Sea, behind the Bab-el-Mandeb sill (about 140 m), is about 21.5 °C from a few hundred metres to the floor, against only 2–3 °C in the Indian Ocean at the same depths.
- The Mediterranean, behind the Gibraltar sill (about 300 m), is about 13 °C at depth, against 3–4 °C in the Atlantic at 2,000 m.
- Deep water fed over the sill. The basin fills with open-ocean water at sill-depth temperature. The Sulu Sea, behind sills a few hundred metres deep, stays near 10 °C right down to its floor.
- Deep water formed inside the basin. The deep water takes the sea’s own lowest winter surface temperature, as cooled surface water sinks.
- High-latitude enclosed seas often show inversions. In the Baltic, salty, slightly warmer North Sea water creeps in along the bottom beneath fresh, cold surface water.
- Open-ocean ridges act like sills. Deep temperatures differ on the two sides of the Greenland–Scotland Ridge and other parts of the ocean floor relief.
A Warming Ocean
Rising sea surface temperature
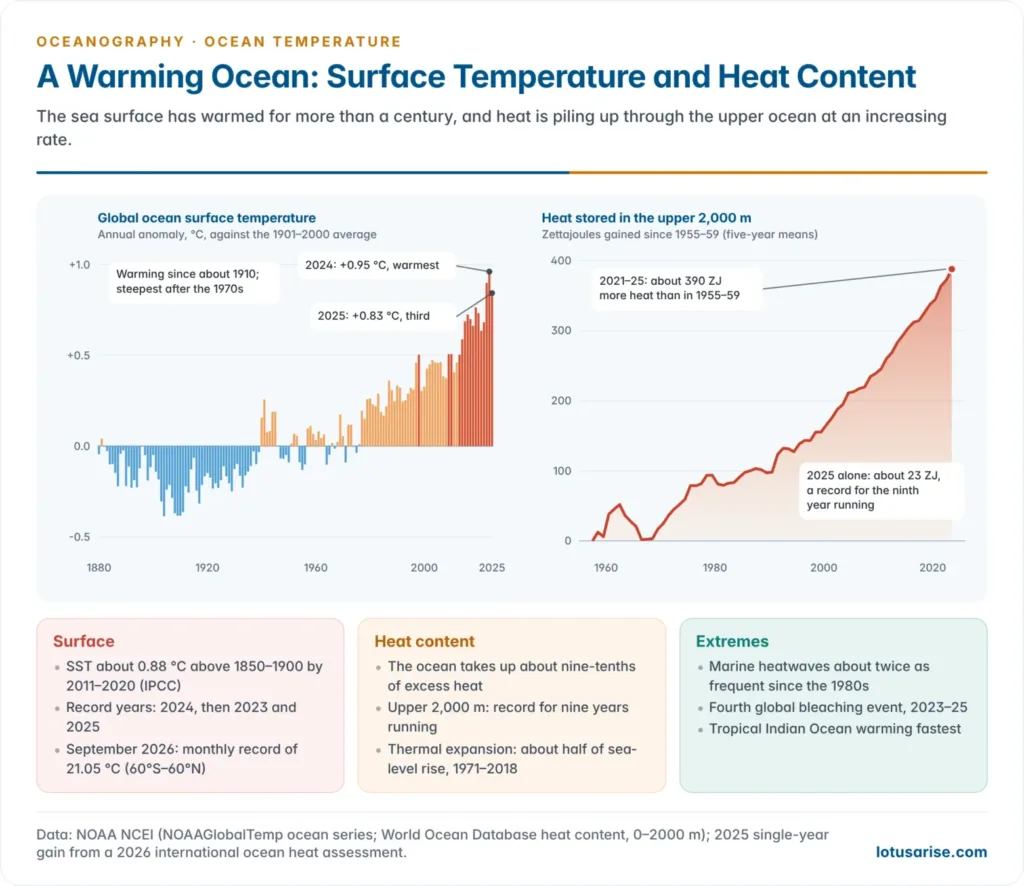
- The Intergovernmental Panel on Climate Change (IPCC) Sixth Assessment Report (2021) found that global mean SST rose by about 0.88 °C between 1850–1900 and 2011–2020, with human influence the main driver of upper-ocean warming since the 1970s.
- The 2020s hold the record years. In NOAA’s record the ocean surface was about 0.95 °C above the 20th-century average in 2024, the warmest year since 1850, followed by 2023 and 2025.
- Copernicus gives the same order. The 2025 mean for the ocean between 60°S and 60°N was 20.73 °C, third after 2024 and 2023.
- 2026 is running higher. A strong El Niño is under way, which NOAA’s October 2026 outlook expects to last into early 2027. September 2026 set a monthly record SST of 21.05 °C for the extra-polar ocean.
Ocean heat content
- SST measures only the surface. Warming is better gauged by heat content, the extra heat stored in the upper 700 m or 2,000 m. The ocean takes up about nine-tenths of the excess heat trapped by greenhouse gases.
- Upper-ocean heat content set a record for the ninth year running in 2025.
- The upper 2,000 m gained about 23 zettajoules (1 ZJ = 10²¹ J) in that year, up from about 16 ZJ in 2024, nearly forty times humanity’s annual primary energy use.
- NOAA’s five-year means show a gain of roughly 390 ZJ between 1955–59 and 2021–25, at a rising rate.
- Warming is strongest near the surface, so the upper ocean has become more stratified, weakening the mixing of nutrients upward and oxygen downward.
- Thermal expansion caused about half of global sea-level rise between 1971 and 2018 (IPCC AR6).
Marine heatwaves
- A marine heatwave (MHW) is a spell of at least five days with SST above the 90th percentile of the local seasonal climatology, as defined by Alistair Hobday and colleagues in 2016.
- The IPCC finds that MHWs have roughly doubled in frequency since the 1980s and are becoming longer and more intense.
- The fourth global coral bleaching event was confirmed on 15 April 2024. Bleaching-level heat stress reached about 84% of the world’s reef area in 83 countries and territories. NOAA’s Coral Reef Watch judged that it had likely ended in 2025, leaving many coral reefs little time to recover.
Warming of the Indian Ocean
- The tropical Indian Ocean is warming faster than the other tropical oceans. A 2024 assessment led by Roxy Mathew Koll of the Indian Institute of Tropical Meteorology (IITM), Pune, found:
- warming of about 1.2 °C per century over 1950–2020, with 1.7–3.8 °C per century projected for 2020–2100;
- marine-heatwave days rising from about 20 a year to 220–250 a year, a near-permanent heatwave state.
- An IITM study of 1982–2018 found MHWs rising by about 1.5 events per decade in the western Indian Ocean (a four-fold rise) and about 0.5 per decade in the north Bay of Bengal.
- INCOIS issues MHW advisories graded Watch (up to 0.5 °C above the 90th-percentile threshold), Alert (0.5–1 °C) and Warning (more than 1 °C). In April 2026 it flagged heatwave conditions across six basins, from the Arabian Sea to the Andaman waters. It also runs a coral bleaching alert system.
- Cyclone Biparjoy (June 2023) lasted 13 days and 3 hours over a warm Arabian Sea. The India Meteorological Department (IMD) recorded it as the longest-lived Arabian Sea cyclone since 1977.
Hazards of rising sea surface temperature
- Stronger tropical cyclones: more latent heat favours rapid intensification, heavier rain and longer-lived storms.
- Coral bleaching: heat stress of about 1 °C above the usual summer maximum, if sustained, makes corals expel their algae. Repeated events allow no recovery.
- Lower productivity and shifting fisheries: stronger stratification starves the surface of nutrients. Phytoplankton in the western Indian Ocean has been reported to have fallen by up to a fifth over six decades, and fish stocks shift poleward and deeper.
- Deoxygenation: warm water holds less oxygen, and the oxygen minimum zones of the Arabian Sea and Bay of Bengal are expanding. Harmful algal blooms become more frequent.
- Sea-level rise through thermal expansion, threatening low islands such as Lakshadweep and delta coasts.
- Ice loss: warmer water melts sea ice and the floating ice shelves of Antarctica and Greenland from below.
- Circulation and weather changes: altered monsoon rainfall and rain extremes, shifts in ENSO behaviour, and a weakening of the Atlantic overturning circulation.
- Weaker carbon uptake: warm water dissolves less CO₂, so a warming ocean weakens one of the planet’s main carbon sinks.
Previous Year Questions
2021Discuss the hazards associated with the rising of sea surface temperature.2011“Temperature, salinity and density differences in ocean water are the prime causes of ocean water circulation.” Elaborate.





Very informative
Useful website
Nice and informative