

- Land is a basic resource: people live on it and obtain most of their needs from it. It is the mother of biotic resources, or of the biosphere, since all plants and animals depend on it.
- Soil composition, groundwater and local climate form the basis on which land is used and developed.
- Hidden resources also shape its use. Once minerals, groundwater and similar assets become economically viable, they bring industrial complexes, mining sites, tourist centres, settlements and other uses.
- India’s varied geography gives it a varied land use pattern, which differs from region to region and from one period to another.
Land Use in India
What Decides Land Use
- Physical factors: topography, soil and climate set the limits of what a piece of land can do.
- Human factors: how crowded an area is, how long it has been settled, who holds the land (land tenure) and what techniques its people command.
- The two sets act on each other all the time, so land use varies across space and changes through time.
Reporting Area and the Nine Classes
- India’s total geographical area is about 328.73 million hectares.
- Land use statistics cover a smaller reporting area, the land for which village records exist.
- It was first published as 305.90 million hectares for 2010-11, later revised to 307.22.
- It stands at 306.96 million hectares in 2023-24 (provisional), about 93% of the country.
- The Ministry of Agriculture sorts this reporting area into a nine-fold classification. Area sown more than once is tracked beside it and is not a tenth class, because double-cropped land is counted only once in net sown area.
| Class | What it holds | Share of reporting area, 2023-24 (%) |
|---|---|---|
| Net area sown | Land under crops and orchards, counted once a year | 45.28 |
| Forests | Land classed or run as forest, wooded or not | 23.46 |
| Non-agricultural uses | Settlements, roads, railways, water bodies | 9.30 |
| Barren and unculturable | Mountains, deserts, rock | 5.40 |
| Current fallow | Cropland rested in the current year | 4.86 |
| Culturable waste | Cultivable land idle for five years or more | 3.77 |
| Other fallow | Rested for one to five years | 3.64 |
| Permanent pastures | Grazing land, including village commons | 3.33 |
| Miscellaneous tree crops | Cultivable land under groves, outside net sown area | 0.96 |
- The broad pattern has long been stated in round figures:
- Net sown area is about 46% of the reporting area (46.05% in 2010-11), helped by India’s large extent of flat ground.
- That share is of the reporting area, not of the whole geographical area.
- About 22% of the country is under forest cover, and about 23% of the reporting area is recorded forest.
- Non-agricultural uses take about 8.5% and barren and unculturable land about 5.5% (2010-11: 8.6% and 5.5%).
- The rest is under tree crops, groves, permanent pastures, grazing lands, culturable waste and fallow.
- Net sown area is about 46% of the reporting area (46.05% in 2010-11), helped by India’s large extent of flat ground.
How the Budget Has Changed
| Class (million hectares) | 1950-51 | 1980-81 | 2000-01 | 2010-11 | 2023-24 (provisional) |
|---|---|---|---|---|---|
| Reporting area | 284.32 | 304.16 | 305.20 | 307.22 | 306.96 |
| Net area sown | 118.75 | 140.29 | 141.34 | 141.37 | 138.99 |
| Forests | 40.48 | 67.46 | 69.84 | 71.59 | 72.02 |
| Non-agricultural uses | 9.36 | 19.60 | 23.75 | 26.42 | 28.55 |
| Barren and unculturable | 38.16 | 19.96 | 17.48 | 16.99 | 16.59 |
| Permanent pastures | 6.68 | 11.99 | 10.66 | 10.30 | 10.21 |
| Tree crops and groves | 19.83 | 3.58 | 3.45 | 3.20 | 2.95 |
| Culturable waste | 22.94 | 16.74 | 13.63 | 12.64 | 11.59 |
| Other fallow | 17.45 | 9.72 | 10.27 | 10.33 | 11.16 |
| Current fallow | 10.68 | 14.83 | 14.78 | 14.38 | 14.91 |
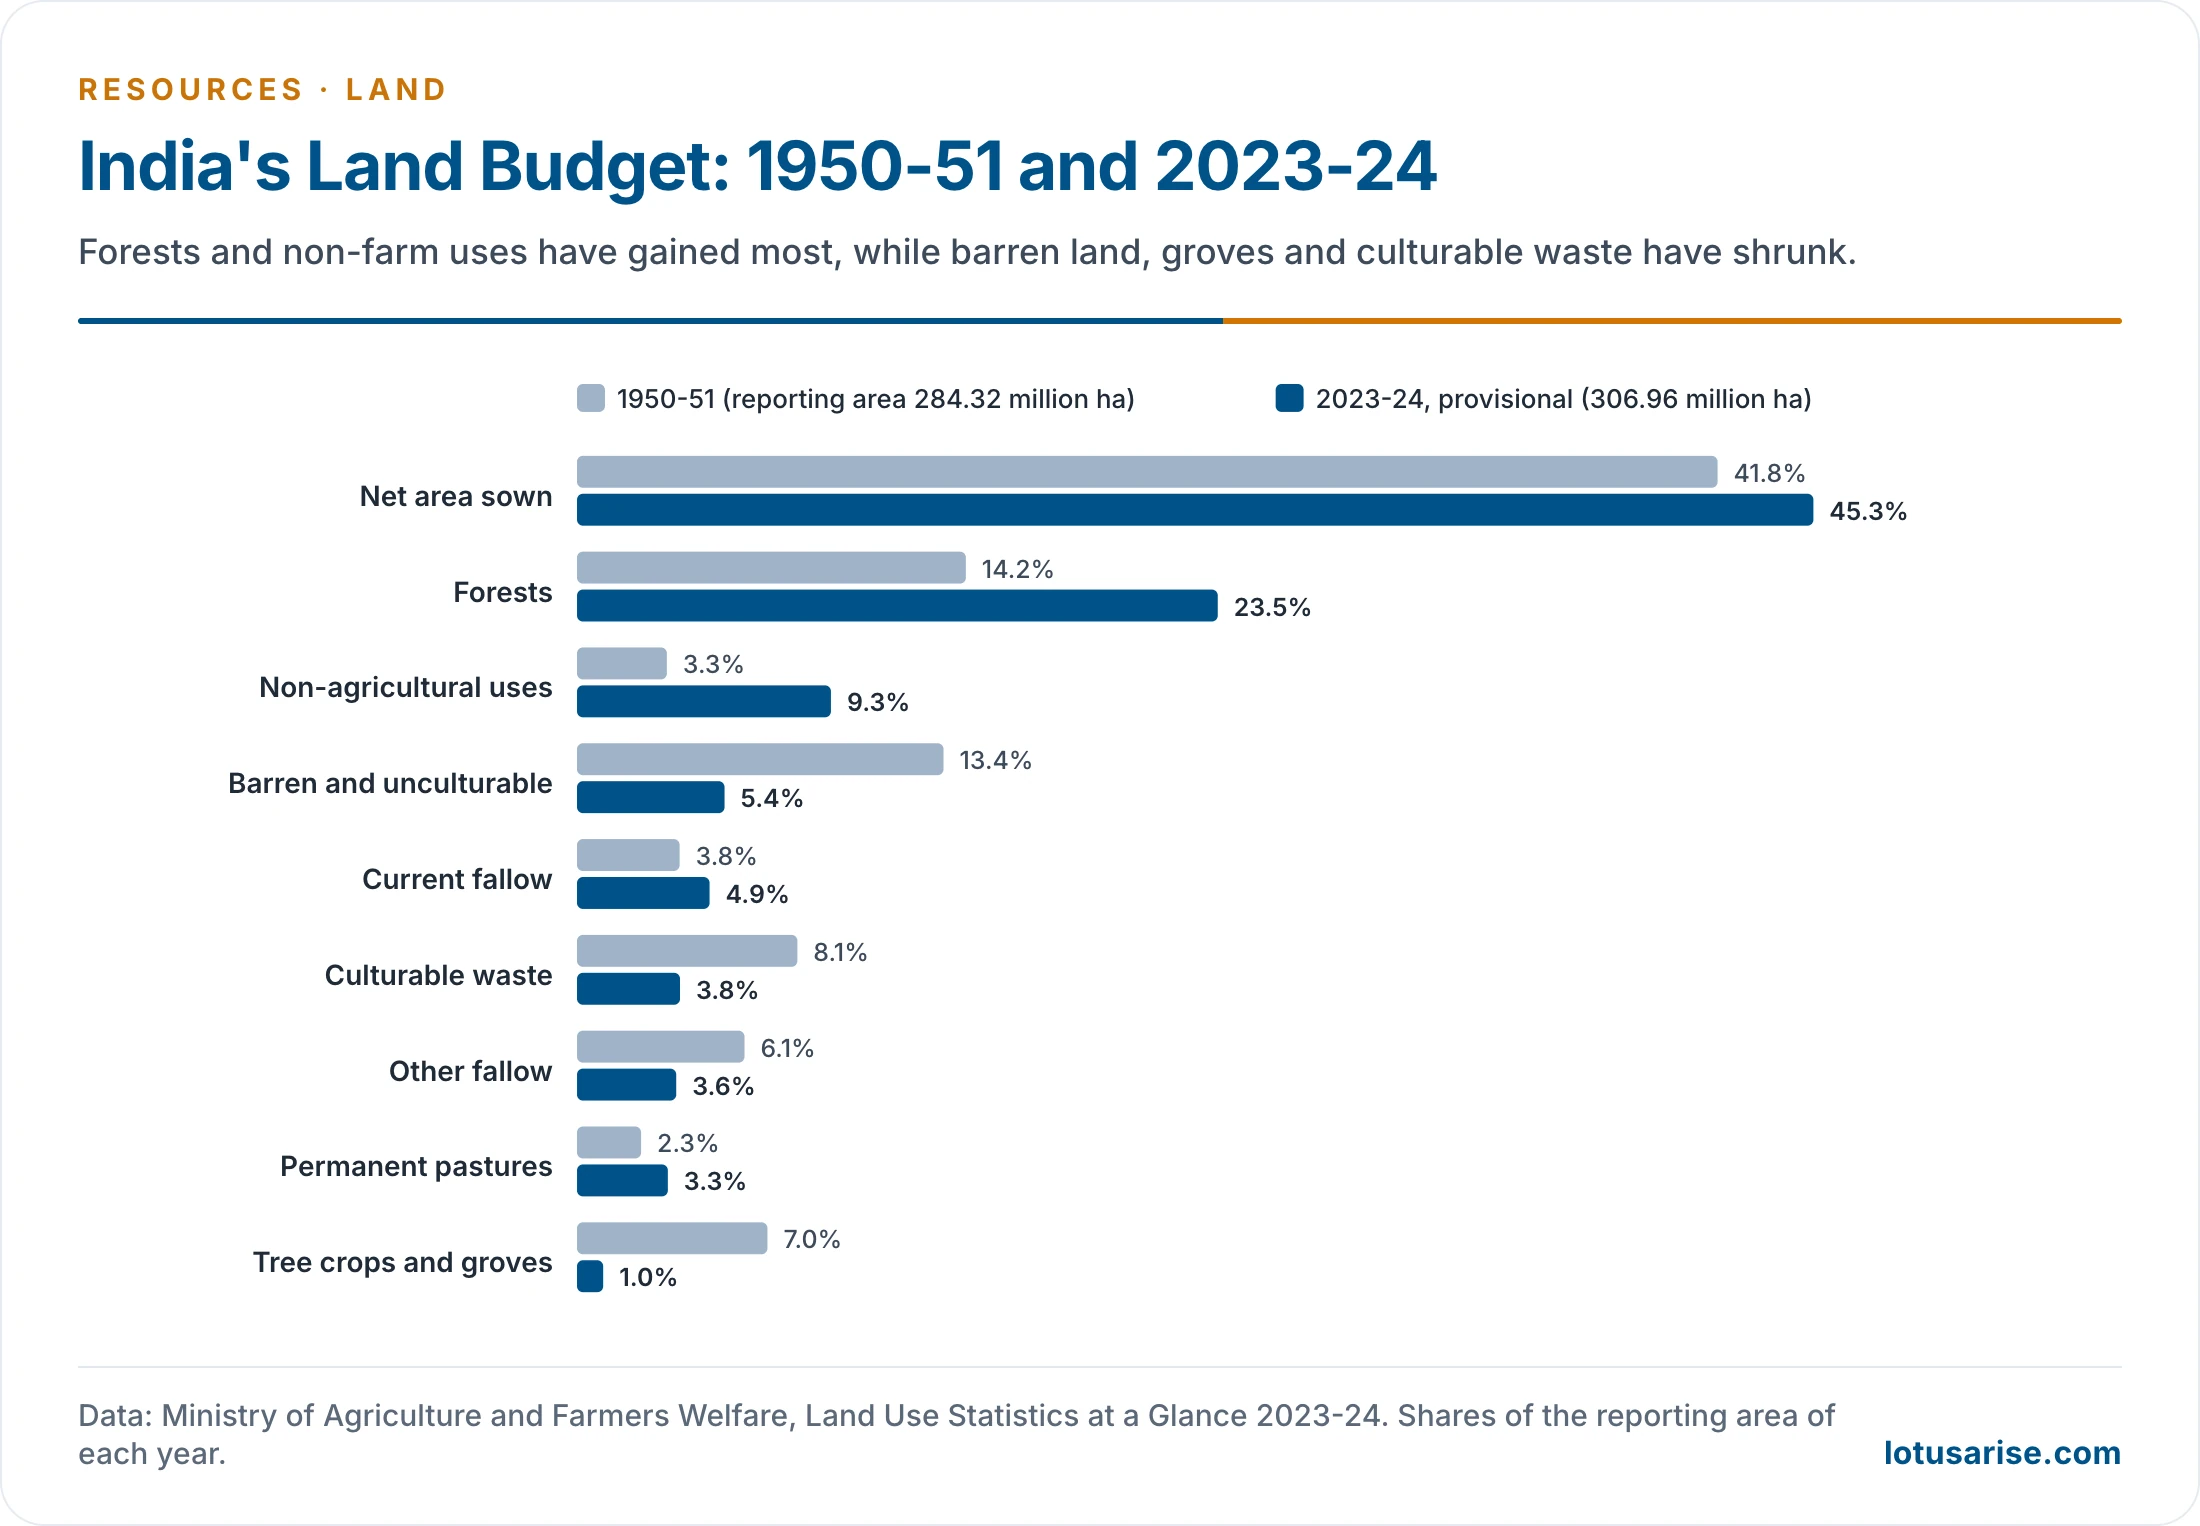
- The 2010-11 column uses the revised figures. Figures first published for that year differ slightly, as with net sown area at 141.58 million hectares.
- Three shifts stand out:
- Forests and built-up or other non-farm land have gained the most.
- Barren land, groves and culturable waste have shrunk, much of it taken up as pressure on land rose.
- Net sown area rose until about 1990-91, when it touched 143.00 million hectares, and has since slipped.
- How farmers use this land, and how the pattern has moved over time, belongs to the study of changes in the pattern of land use and of land capability.
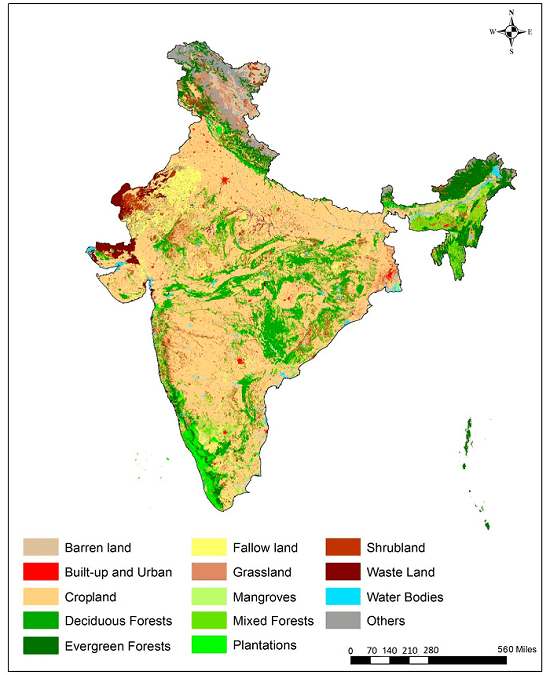
- This map shows land cover, sorted from satellite images by what lies on the ground, so its classes such as cropland and shrubland do not match the nine reporting classes.
The Land Use Classes
Net Sown Area
- This is the actual area on which crops are sown and harvested in a year. Food and farm output rest largely on this land, which gives it special weight in an agricultural country.
- Trend:
- It grew from 118.7 million hectares in 1950-51 to about 141.58 million hectares in 2010-11, against 141.34 in 2000-01, so the first decade of this century was flat.
- It fell to 139 million hectares in 2023-24, after 140.7 in 2022-23.
- The decline began in the late 1990s, after a slow rise. Most of the loss appears to have gone to non-agricultural uses.
- Scope to expand is small, because topography, soils and climate rule out much of what remains.
- Land per person has fallen sharply, from 0.53 hectare in 1951 to 0.11 hectare in 2011-12.
- World comparison (about 2010-11): India’s 46% compares with a world average of about 32%, the USA 40%, Russia 25%, Brazil 16% and Canada 6%.
- Prosperity depends on the share, not the total. A State’s farm wealth follows the proportion of its land under the plough more closely than the raw acreage.
- Highest shares: Punjab (82.6%) and Haryana (80.5%) in 2010-11, and 81.6% and 81.4% in 2023-24.
- Lowest: Arunachal Pradesh, at about 3–4%.
- Largest areas in hectares: Rajasthan (18.35 million in 2010-11, 18.20 million in 2023-24), then Maharashtra (17.41 million) and Uttar Pradesh in the older table. Uttar Pradesh (16.37 million) stands second in 2023-24.
- Where the share is high: the Satluj and Ganga plains, Gujarat plains, Kathiawar, the Maharashtra plateau and the West Bengal basin. Gentle slopes, fertile alluvial and black soils, good climate, irrigation and dense settlement all help.
- Where it is low: the Himalaya and the driest tracts, which suffer from rugged ground, harsh climate or poor soil.
Area Sown More Than Once
- This land carries two or more crops in a single year, which calls for rich soil and an assured water supply.
- Extent:
- Older figures put it at 34.3% of net sown area and 16.6% of the reporting area.
- It rose from 13.15 million hectares in 1950-51 to 44.00 million in 2000-01 and 57.39 million in 2010-11, a gain of over 13 million hectares in a decade.
- In 2023-24 it reached 78.89 million hectares, which is 56.8% of net sown area and 25.7% of the reporting area.
- Cropping intensity has climbed with it, from 111.1% in 1950-51 to 155.9% in 2022-23 and 156.8% in 2023-24.
- Limits: the share has long been held low by infertile soils, lack of moisture, and too little manure and fertiliser.
- Why it matters: nearly all arable land is already ploughed, so raising cropping intensity is the main route left to higher output.
- Where it is high: much of the Indo-Ganga plain, across Punjab, Haryana, Uttar Pradesh and Bihar, and the coasts.
Forests
- Recorded forest is not the same as forest cover:
- Recorded forest is land the Government has identified and demarcated for forest, whether wooded or not. It may be state-owned or private, and crops and grazing inside it are still counted as forest. Land revenue records follow this definition.
- Forest cover is what satellites actually see.
- So a rise in recorded forest need not mean any more trees on the ground.
- Recorded area in land use statistics:
- 40.48 million hectares in 1950-51, about 14% of the reporting area.
- 69 million hectares in 1999-2000 and 69.84 million in 2000-01.
- 72.02 million hectares in 2023-24, about 23.5%.
- Much of this rise reflects more land being demarcated as forest, rather than any real gain in cover.
- Forest cover as measured by the India State of Forest Report:
- ISFR 2019: forest cover 7,12,249 sq km (21.67%), and forest and tree cover together 8,07,276 sq km (24.56%, up from 24.39% in the previous assessment).
- ISFR 2023: forest cover 7,15,343 sq km (21.76%), and forest and tree cover together 8,27,357 sq km (25.17%).
- The goal: about 33% of the land should be under forest, a target a tropical country like India has not met on any of these counts.
- Closing the gap calls for massive tree planting, firm curbs on reckless felling and the reclaiming of forest land.
- Expert committees have also urged that much land taken from forest for farming be retired and returned to forest, to undo the harm of deforestation.
Land Not Available for Cultivation
- It splits into non-farm land and barren, unculturable waste.
- Non-farm land:
- It covers rural and urban settlements, infrastructure such as roads, railways and canals, industries, shops, and water bodies such as rivers, lakes, tanks and ponds.
- It has grown fastest of all the classes, about threefold since 1950-51.
- The economy leans ever more on industry and services, with their infrastructure.
- Towns and villages have spread as well.
- The growth comes at the expense of wastelands and farmland.
- Barren and unculturable waste:
- It takes in bare hill terrain, deserts, ravines and rocky ground, which available technology cannot normally bring under cultivation, or only at a very high cost for poor returns.
- As pressure from farm and non-farm demand has grown, both barren land and culturable waste have declined.
- Extent of the class:
- It has varied since 1950-51, the first year of the data: 47.52 million hectares then, 41.48 million in 2000-01 and 43.56 million in 2010-11.
- It was 13.8% of the reported area in 1999-2000, 14% in 2010-11 and 14.7% (45.14 million hectares) in 2023-24.
- States:
- The older State table puts Andhra Pradesh first, then Rajasthan, Gujarat, Madhya Pradesh, Uttar Pradesh and Maharashtra, with Bihar lower down.
- Himachal Pradesh ranks high only by share, with about a quarter of its reporting area in this class, though much less in hectares.
Permanent Pastures and Other Grazing Lands
- Ownership: most of this land belongs to the village panchayat or the Government, and little is private.
- The panchayat’s share forms part of the Common Property Resources.
- Extent: 10.3 million hectares in 2010-11, about 4% of the reporting area (3.4% strictly), and 10.21 million hectares (3.33%) in 2023-24.
- Livestock grazes mostly in forests and on other uncultivated land, wherever fodder is found, because this area is too small for the country’s huge animal population.
- Grassland proper is put at only about 3% of India’s area.
- Spread:
- Himachal Pradesh has about one-third of its reporting area under pasture (31.9% in 2023-24).
- Madhya Pradesh, Karnataka, Gujarat, Rajasthan, Maharashtra and Odisha stand at 4–10%, and the rest of the country below 3%.
- By area, Rajasthan (1.65 million hectares), Maharashtra (1.41 million) and Madhya Pradesh (1.26 million) lead in 2023-24.
- Decline: the area has dropped from 13.97 million hectares in 1960-61. Pressure from cropping is the main cause, largely through illegal encroachment on common pastures.
Land Under Miscellaneous Tree Crops and Groves
- Cultivable ground outside net sown area, yet with some agricultural use, falls here: casuarina, thatching grass, bamboo, bushes and groves for fuel. Orchards are counted elsewhere, under net sown area.
- Most of it is privately owned.
- Trend:
- It fell steeply: 1950-51 had 19.8 million hectares (6.97%), 1960-61 had 4.46 million (1.49%), and 1970-71 about 4.29–4.37 million (about 1.41%).
- It then moved unevenly, to 3.21 million hectares (1%) by 2010-11 and 2.95 million hectares (0.96%) by 2023-24.
- States:
- Odisha has often been listed first, then Uttar Pradesh, Bihar, Karnataka, Andhra Pradesh, Assam and Tamil Nadu.
- The State table for 2010-11 instead gives Uttarakhand (3.86 lakh hectares), Uttar Pradesh (3.54 lakh), Andhra Pradesh (2.90 lakh) and Karnataka (2.86 lakh) ahead of Odisha (2.20 lakh).
Culturable Waste Land
- Definition: the Wasteland Survey and Reclamation Committee treated it as land fit for cultivation but not being cultivated, for one reason or another.
- Some of it was farmed in the past and then abandoned.
- What holds it back: lack of water, salinity or alkalinity, soil erosion, waterlogging, a poor physiographic position, or human neglect.
- Test of time: land left uncultivated beyond five years falls here. Reclamation can bring it back.
- Examples: reh, bhur, usar and khola lands in Uttar Pradesh, Punjab and Haryana, and similar land elsewhere, damaged by soil deficiencies that faulty farming left behind.
- Reh and usar are the saline and alkaline soils.
- States:
- Rajasthan has about 43 lakh hectares, about a third of the national total (often quoted as 36%).
- Gujarat (13.6%), Madhya Pradesh (10.2%), Uttar Pradesh (6.93%) and Maharashtra (6.83%) follow.
- Goa has about one-sixth of its own reporting area in this class.
- In 2023-24, Rajasthan (35.2 lakh hectares), Gujarat (17.2 lakh) and Madhya Pradesh (9.6 lakh) lead.
- Trend: about 22.9 million hectares in 1950-51, 13.8 million by 1999-2000, 12.66 million by 2010-11 (about 4–5% of the reporting area) and 11.59 million by 2023-24.
- Land reclamation schemes launched after Independence explain much of the fall, along with the pressure on land from farm and non-farm demand.
- Best use: bringing it under the plough could add to output, but afforestation serves long-term conservation and ecological balance better than crop farming.
- Mapping: the National Remote Sensing Agency (NRSA), Hyderabad, which became the National Remote Sensing Centre of ISRO on 1 September 2008, maps India’s wastelands from satellite images.
Fallow Land
- This is land once cultivated but temporarily out of use, left idle for one to five years so that the soil regains fertility naturally. The length of rest depends on the soil and the type of farming.
- Two types:
| Feature | Current fallow | Fallow other than current fallow |
|---|---|---|
| Period | One year | More than a year, under five |
| 1950-51 (million hectares) | 10.68 | 17.45 |
| Later | 14.70 in 1999-2000; 14.27 in 2010-11 | 11.18 in 1960-61; 10.32 in 2010-11 |
| 2023-24 (million hectares) | 14.91 | 11.16 |
| Trend | Fluctuates with rainfall and cropping cycles | Sharp early fall, then flat |
| Share of reported area, 2010-11 | About 5% | About 3% |
- Current fallow is an old cultural practice of resting land, which recovers through natural processes.
- States (2010-11): Andhra Pradesh about 2.2 million hectares, then Jharkhand 1.73 million, Maharashtra 1.37 million, Rajasthan 1.24 million, Uttar Pradesh and Karnataka about 1.2 million each, Tamil Nadu 1.01 million, and Bihar 0.92 million.
- In 2023-24, Andhra Pradesh (2.43 million), Rajasthan (1.73 million) and Maharashtra (1.44 million) lead.
- Other fallow:
- States (2010-11): Rajasthan over 1.7 million hectares, then Tamil Nadu 1.58 million, Andhra Pradesh 1.5 million and Maharashtra over one million.
- In 2023-24, Rajasthan (1.96 million), Tamil Nadu (1.87 million) and Maharashtra (1.16 million) lead.
- Reducing fallow would raise output. The tools are fertiliser in the right dose, irrigation, crop rotation and crop combination, along with similar farm techniques.
Land Degradation and Wastelands
Three Measures of Damaged Land
- The word “waste” carries three different meanings in Indian data, so their figures cannot be added or compared directly:
| Measure | Basis | Latest area (million hectares) | Share of India (%) | Agency |
|---|---|---|---|---|
| Culturable waste | Village land records | 11.59 (2023-24) | 3.5 | Ministry of Agriculture |
| Wastelands | Satellite mapping | 55.76 (2015-16) | 16.96 | Department of Land Resources, NRSC |
| Degraded land | Satellite mapping | 97.85 (2018-19) | 29.77 | Space Applications Centre, ISRO |
Wastelands
- The Wastelands Atlas of India 2019, released on 5 November 2019, shows 55.76 million hectares in 2015-16, against 56.60 million (17.21%) in 2008-09.
- About 1.45 million hectares moved out of the wasteland categories in that period.
- The 2019 edition also brought in 12.08 million hectares of Jammu and Kashmir not mapped earlier, so the two totals are not on quite the same footing.
Land Degradation
- The Desertification and Land Degradation Atlas of India (2021) from the Space Applications Centre shows a slow, steady rise:
| Period | Degraded land (million hectares) | Share of India (%) |
|---|---|---|
| 2003-05 | 94.53 | 28.76 |
| 2011-13 | 96.40 | 29.32 |
| 2018-19 | 97.85 | 29.77 |
- Of the 2018-19 total, 83.69 million hectares lies in the drylands and counts as desertification.
- Leading processes (share of India’s area): water erosion 11.01%, vegetation degradation 9.15% and wind erosion 5.46%.
- Where it is concentrated: Rajasthan, Maharashtra, Gujarat, Karnataka, Ladakh, Jharkhand, Odisha, Madhya Pradesh and Telangana together hold 23.79% of India’s area under degradation, most of the national total.
- By share of a State’s own area (2011-13): Jharkhand 68.98%, Rajasthan 62.90%, Gujarat 52.29% and Maharashtra 44.93%.
- Degradation rose in 28 of 31 States and Union Territories between 2011-13 and 2018-19.
- Main forms: the soil erosion and land degradation set includes erosion by water and wind, loss of fertility, waterlogging, salinity and alkalinity, and the loss of farmland to towns and transport.
- Causes:
- Deforestation and overgrazing strip the protective cover.
- Shifting cultivation with shortened cycles exposes hill slopes.
- Canal irrigation without drainage and heavy use of chemicals bring waterlogging and salts.
- Mining and quarrying remove topsoil outright.
- Remedies:
- Replant degraded forest land, and move marginal farmland to social forestry and agroforestry.
- Use watershed programmes and rainwater harvesting in rainfed tracts.
- Stabilise dunes under the Desert Development Programme.
- The national target: India aims to restore 26 million hectares of degraded land by 2030, under its commitment to Land Degradation Neutrality (Sustainable Development Goal target 15.3).
Previous Year Questions
2025What are the causes and consequences of land degradation due to desertification in India? Examine with reference to various regional issues.2025Highlight the characteristics of land utilization in Eastern Ghats region of India. What are the land utilization problems in the region?2020The pattern of growing ecological footprints is uneven in nature. Analyse with reference to land resources in India.2020“Land degradation is a threat to productivity and sustainable resource management.” Explain with suitable examples from India.2015Explain how change in land use can promote eco-development at different levels in the country.2011Analyse the causes of desertification in India. Represent the desertified areas of the country on a sketch map suggest remedial measures to control it.





Great content. 👍
Good