

- Land is a crucial natural resource and an important determinant of a country’s socio-economic health.
- The pattern of land use in India has changed markedly in space and in time, under the steady push of physical limits and human pressure.
- The radical changes reach across the country, but changes in agricultural land use are most substantial in the areas of the Green Revolution.
Land Use Categories Then and Now
The Five Categories of 1950-51
- In 1950-51, the country’s area was divided into five categories on the basis of land use:
- Forest
- Land not available for cultivation
- Land put to non-agricultural uses
- Barren and uncultivated land
- Other uncultivated land, excluding fallow
- Permanent pastures and other grazing lands
- Miscellaneous trees and groves not included in net area sown
- Fallow land: old fallow and current fallow
- Net sown area
- Splitting these groups gives the nine-fold classification now in use, defined class by class in India’s land resources.
How the Shares Have Moved
- The table turns the official land budget into shares of the reporting area, which itself grew from 284.32 to 306.96 million hectares as coverage improved.
| Class (% of reporting area) | 1950-51 | 1980-81 | 2000-01 | 2010-11 | 2023-24 (provisional) |
|---|---|---|---|---|---|
| Net area sown | 41.8 | 46.1 | 46.3 | 46.0 | 45.3 |
| Forests | 14.2 | 22.2 | 22.9 | 23.3 | 23.5 |
| Non-agricultural uses | 3.3 | 6.4 | 7.8 | 8.6 | 9.3 |
| Barren and unculturable | 13.4 | 6.6 | 5.7 | 5.5 | 5.4 |
| Permanent pastures | 2.3 | 3.9 | 3.5 | 3.4 | 3.3 |
| Tree crops and groves | 7.0 | 1.2 | 1.1 | 1.0 | 1.0 |
| Culturable waste | 8.1 | 5.5 | 4.5 | 4.1 | 3.8 |
| Other fallow | 6.1 | 3.2 | 3.4 | 3.4 | 3.6 |
| Current fallow | 3.8 | 4.9 | 4.8 | 4.7 | 4.9 |
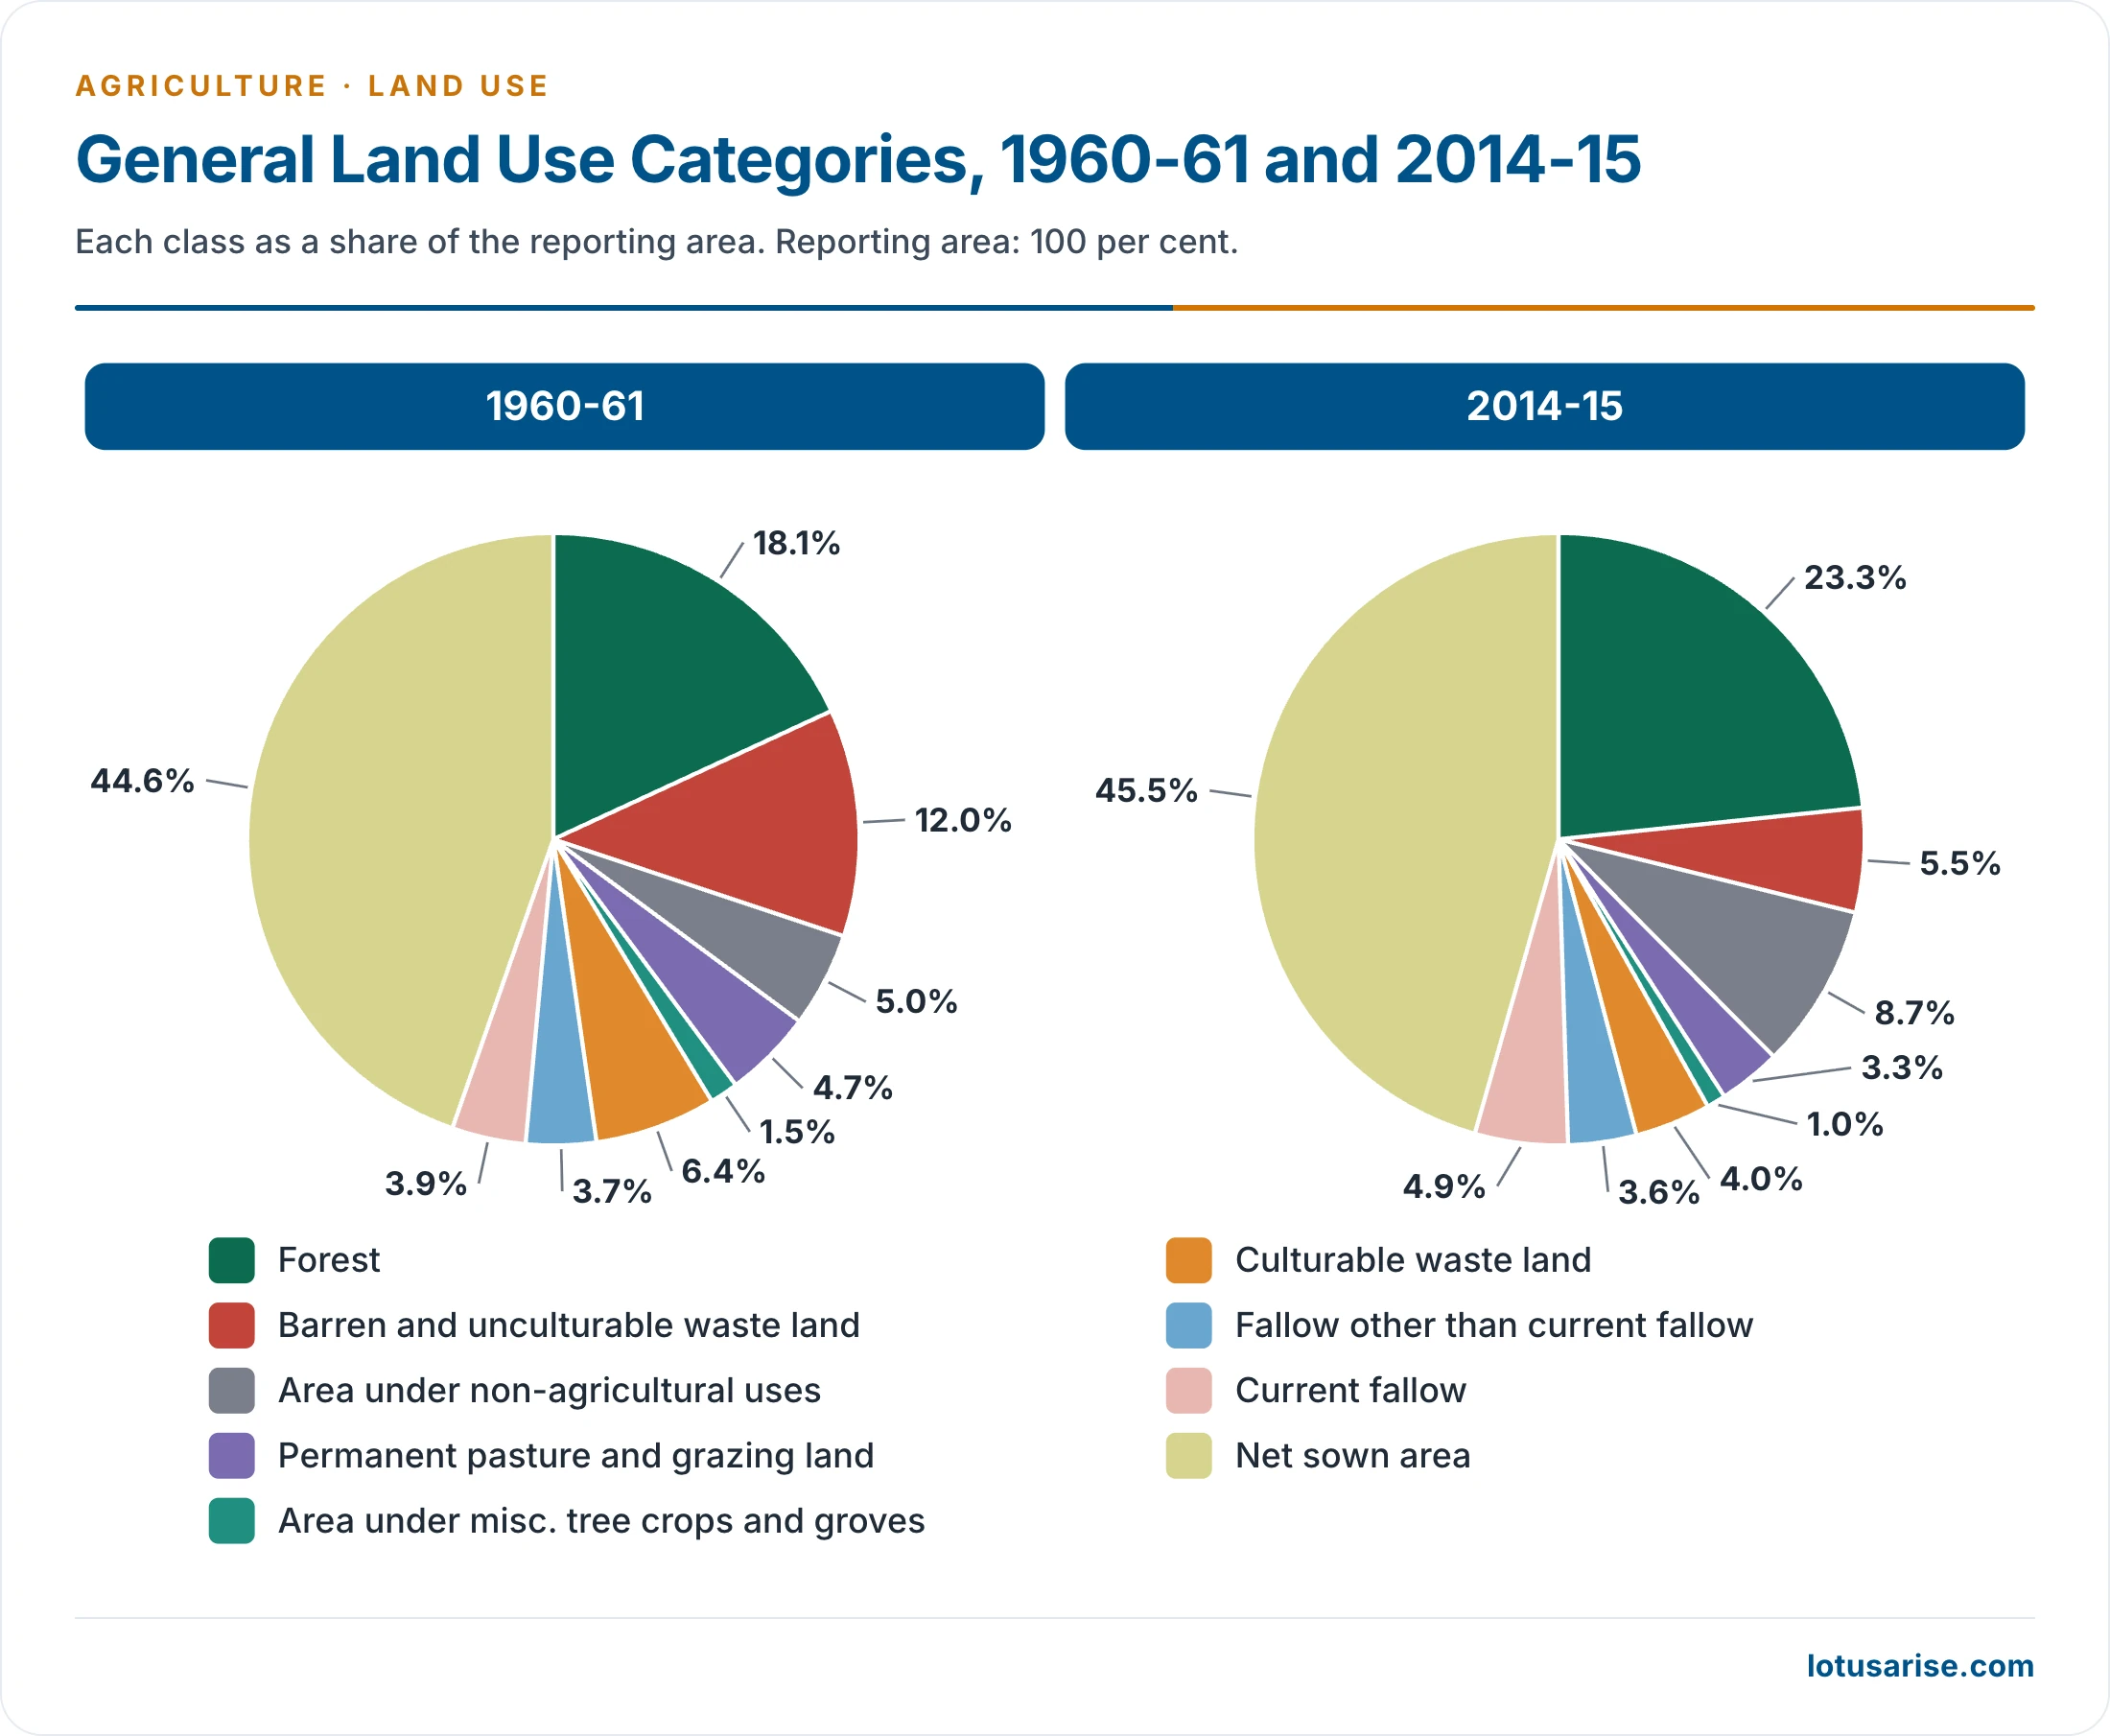
- For 1960-61, the official land budget gives about 12% for barren land and 44.6% for net sown area (133.20 of 298.46 million hectares).
Facts and Data Analysis
- Net sown area rose from 118.75 million hectares in 1950-51 to a peak of 143.00 million in 1990-91, then slipped to 138.99 million in 2023-24.
- The frontier of cultivation has closed, since topography, soil and climate leave little more to plough.
- Cultivated land per person fell sharply, from 0.53 hectare in 1951 to 0.11 hectare in 2011-12.
- Area sown more than once has carried the growth instead: 13.15 million hectares (1950-51), 42.74 million (1990-91), 57.39 million (2010-11) and 78.89 million (2023-24).
- Gross cropped area therefore climbed from 131.89 million hectares in 1950-51 to 198.97 million in 2010-11.
- Cropping intensity rose from 111.1% to 156.8% in 2023-24.
- Forests gained most on paper, from 14% to about 23.5% of the reporting area, because this class counts land recorded as forest, wooded or not. It remains short of the one-third that India’s forest policy seeks.
- Non-agricultural uses have roughly trebled their share as towns, roads, railways, canals and industry spread.
- An older estimate put farmland diverted to other uses at about 4 lakh hectares a year.
- Barren land, tree crops and groves, and culturable waste have all shrunk.
- Tree crops and groves fell abruptly from 19.83 million hectares in 1950-51 to 4.46 million in 1960-61.
- Reclamation schemes after Independence took up part of the culturable waste. The reh, bhur, usar and khola tracts of Uttar Pradesh, Punjab and Haryana are examples of land once farmed and later given up, because of soil defects left by faulty practices.
- Fallows have held fairly steady in recent decades, and pastures remain small for so large a livestock population.
- Spatial contrasts are sharp (2010-11):
- Punjab (82.6%) and Haryana (80.5%) had among the highest shares of net sown area, against 3% in Arunachal Pradesh.
- Rajasthan (18.35 million hectares) and Maharashtra (17.41 million) led in absolute net sown area.
- Gentle slopes, fertile alluvial and black soils, irrigation and dense settlement explain the high shares, while rugged relief and dryness explain the low ones.
Changes within Farmland
- Agricultural land use has also seen substantial changes in the cropping pattern.
- Wheat and rice gained area at the cost of pulses, millets and fodder.
- Oilseeds, sugarcane, vegetables and orchards also gained.
- Food crops held about three-fourths of cropped area at Independence and rose further with the Green Revolution. Diversification then lowered their share:
| Year | Food crops (% of cropped area) | Other crops (%) |
|---|---|---|
| 1990-91 | 68.82 | 31.18 |
| 2000-01 | 65.29 | 34.71 |
| 2009-10 | 63.86 | 36.14 |
- In 2010-11, the leading shares of gross cropped area were rice 22.05%, wheat 14.99%, all oilseeds 14.60%, coarse cereals 14.20%, pulses 12.94%, cotton 5.50% and sugarcane 2.66%.
- Good farmland has been lost to urbanisation, industry, roads and railways, while former fallow, pasture and degraded forest have been brought under the plough in its place. Output therefore rests on poorer land at the margin.
The Global Picture
- Emissions: agriculture, forestry and other land use account for about 23% of human greenhouse gas emissions (Intergovernmental Panel on Climate Change, IPCC, 2019), against an often-quoted round figure of 25%.
- Land use change thus affects the atmospheric concentration of carbon dioxide and contributes to global climate change.
- Land degradation undermines the well-being of at least 3.2 billion people (Intergovernmental Science-Policy Platform on Biodiversity and Ecosystem Services, IPBES, 2018).
- Ecosystem services from forest, farmland, grassland and tourism worth up to $10.6 trillion a year are lost to it.
- Human footprint:
- Human use directly affects more than 70% of the world’s ice-free land (69–76%, IPCC, 2019).
- IPBES (2018) finds about 75% of land substantially altered, heading to over 90% by 2050.
- Land demand: the World Resources Institute puts the gap between farmland in 2010 and the farmland needed in 2050 at 593 million hectares, if yields merely keep growing at past rates. Food and Agriculture Organization projections of net cropland growth are much smaller, about 70 million hectares by 2050.
Reasons and Remedies
Reasons for the Change
- Population growth: rapid growth and high pressure hurt land resources, and cities spread far beyond their formal limits.
- Encroachment and heavy use of forest resources:
- Demand for food and shelter pushes people onto uncultivated land, forests, shrubland and wetlands.
- The IPCC’s 2019 report on climate change and land names farmland for food, animal feed and fibre as a driver.
- Overgrazing: farmers give up cultivated land for grazing as its soil fertility declines.
- Two types of land use change follow:
- Direct (anthropogenic): deforestation, reforestation and afforestation, agriculture and urbanisation.
- Indirect: climate change or a change in carbon dioxide concentration, which alters vegetation and so land use.
Solutions and Way Forward
- Smart forest and land management:
- Better cropland and livestock management, agroforestry and fewer post-harvest losses help restore land.
- Grazing control and forest fire management must also improve.
- Responsible land governance: this is the key to better land use adaptation and to the livelihoods of small farmers. It also enables ecosystem restoration and the protection of biodiversity.
- Domestic choices:
- Raise output through cropping intensity on existing land, using fertiliser in the right dose, irrigation, rotation and crop combination to shrink fallows.
- Place culturable waste under afforestation where conservation gains outweigh small crop gains, and retire farmland reclaimed from forest.
- Frame a clear agricultural land use policy, guided by land capability, because farmers otherwise choose crops without any national or regional plan.
- International commitments:
- As a member of the United Nations Convention to Combat Desertification, India can adopt an ambitious resolution on land use change and landholdings.
- There is urgency to slow and reverse land use change. The sector is critical to the Paris Agreement aim of holding warming well below 2°C.
What Is the UNCCD?
- Established in 1994, the United Nations Convention to Combat Desertification is the sole legally binding international agreement linking environment and development to sustainable land management.
- Focus areas: the arid, semi-arid and dry sub-humid areas, or drylands, home to some of the most vulnerable ecosystems and peoples.
- In India: the Ministry of Environment, Forest and Climate Change is the nodal ministry, and the country has pledged to restore 26 million hectares of degraded land by 2030.
- Recent meetings: the 16th conference of its 197 Parties met in Riyadh (2–13 December 2024), and the 17th met in Ulaanbaatar, Mongolia (17–28 August 2026), and endorsed the Ulaanbaatar Declaration on land degradation neutrality.
Previous Year Questions
2022Sequential changes in land use and land cover have brought global and regional ecological changes and imbalances. Elucidate.2015Explain how change in land use can promote eco-development at different levels in the country.1989Formulate a suitable agricultural land-use policy that will achieve the twin goals of optimum agricultural efficiency and crop productivity.





Great work. Even though I’m a Sociology optional student, I found your write-ups pretty lucid and to the point. Keep it up.
Thanks Arushi, Keep reading.
Sir every topic is greatly helping me in my geography optional. All I can say is thanks A lot from bottom of my heart.keep up the good work;)