

- Caste and tribe composition is the share and distribution of a population by caste groups and tribal communities. In India it is measured through the two constitutionally listed groups: Scheduled Castes (SCs) and Scheduled Tribes (STs).
- Together they formed 25.2% of India’s population in 2011: SCs 16.6% (20.14 crore) and STs 8.6% (10.45 crore).
- Their distributions are almost mirror images: SCs live in the agricultural plains, STs in the hills, forests and islands. The contrast is one of the clearest patterns in India’s social geography.
Caste and Tribe in India’s Population

Nature of India’s Social Diversity
- India’s population is differentiated by language, religion, caste and tribe, which makes it one of the most complex population structures in the world.
- Caste began as an institution of Hindu society, but it has shaped Muslim, Christian and Sikh communities too, through social stratification and assimilation.
- The wider South Asian region (Nepal, Pakistan, Bangladesh, Sri Lanka) shares many of these traits, a sign of a common civilisational past.
Caste as a Structural Component
- Caste (jati) is a hereditary, endogamous status group, ranked in a hierarchy and traditionally tied to an occupation.
- Varna is the classical fourfold scheme; jati is the working unit, with thousands of regional groups.
- Its main features are ascribed status by birth, endogamy, hereditary occupation, ideas of purity and pollution, and restrictions on commensality.
- Caste has a spatial expression:
- Caste-segregated hamlets in villages: the tola (Bihar, UP), cheri (Tamil Nadu), wada (Maharashtra).
- The social morphology of rural settlements typically places the dominant landowning castes at the core, with artisan and service castes around them and SC hamlets at the edge.
- Access to wells, temples and common land has long followed this layout.
- Occupational clustering, for example of leather, weaving or fishing castes.
- Political mobilisation along caste lines.
- Caste-segregated hamlets in villages: the tola (Bihar, UP), cheri (Tamil Nadu), wada (Maharashtra).
- Urbanisation, education and economic diversification have weakened the link between caste and occupation, but caste endogamy and residential segregation persist.
- Caste-like ranking exists outside Hinduism as well:
- among Muslims, the Ashraf, Ajlaf and Arzal strata, with the backward groups now organised as Pasmanda Muslims;
- among Christians, Dalit Christians, who remain outside the SC list;
- among Sikhs, the Mazhabi and Ravidasia Sikhs, who are listed as SCs.
Who Are SCs and STs
- Scheduled Castes: groups historically subjected to untouchability and placed at the bottom of the caste order.
- Notified under Article 341, defined in Article 366(24).
- Only Hindus, Sikhs (from 1956) and Buddhists (from 1990) can be listed as SCs.
- Over 1,200 communities are notified, varying from State to State.
- Scheduled Tribes: communities with distinct culture, language and territory, often living in isolation.
- Notified under Article 342, defined in Article 366(25).
- The Constitution gives no criteria. The Lokur Committee (1965) suggested five: primitive traits, distinctive culture, geographical isolation, shyness of contact with the wider community, and backwardness.
- STs may follow any religion. 705 groups were notified in 2011, including 75 Particularly Vulnerable Tribal Groups (PVTGs).
| Feature | Scheduled Castes | Scheduled Tribes |
|---|---|---|
| Basis of listing | Untouchability, caste disadvantage | Distinct culture, isolation |
| Constitution | Art. 341, 366(24) | Art. 342, 366(25) |
| Religion | Hindu, Sikh, Buddhist only | Any |
| Society | Part of the village caste order | Outside or at the edge of it |
| Habitat | Plains, deltas | Hills, forests, islands |
Data Constraints
- The 1931 Census was the last to count all castes. After Independence the census counted only SCs and STs.
- The Socio-Economic and Caste Census (2011) collected caste data, but its caste tables were not released.
- Some States ran their own surveys. Bihar’s caste survey (2023) found Extremely Backward Classes 36.0%, Other Backward Classes 27.1%, SCs 19.7%, STs 1.7% and the unreserved 15.5%.
- On 30 April 2025 the Union Cabinet decided to include caste enumeration in the next census. Its reference date is 1 March 2027, so Census 2011 remains the official source for SC and ST data.
- Between censuses, sample surveys report indicators by social group (ST, SC, OBC, others): the National Family Health Survey for health and fertility, and the Periodic Labour Force Survey for work and wages.
- Census tables give SC and ST population down to villages and town wards, which allows district-level maps of concentration.
Scheduled Castes: Demography and Spatial Pattern
Demographic Profile
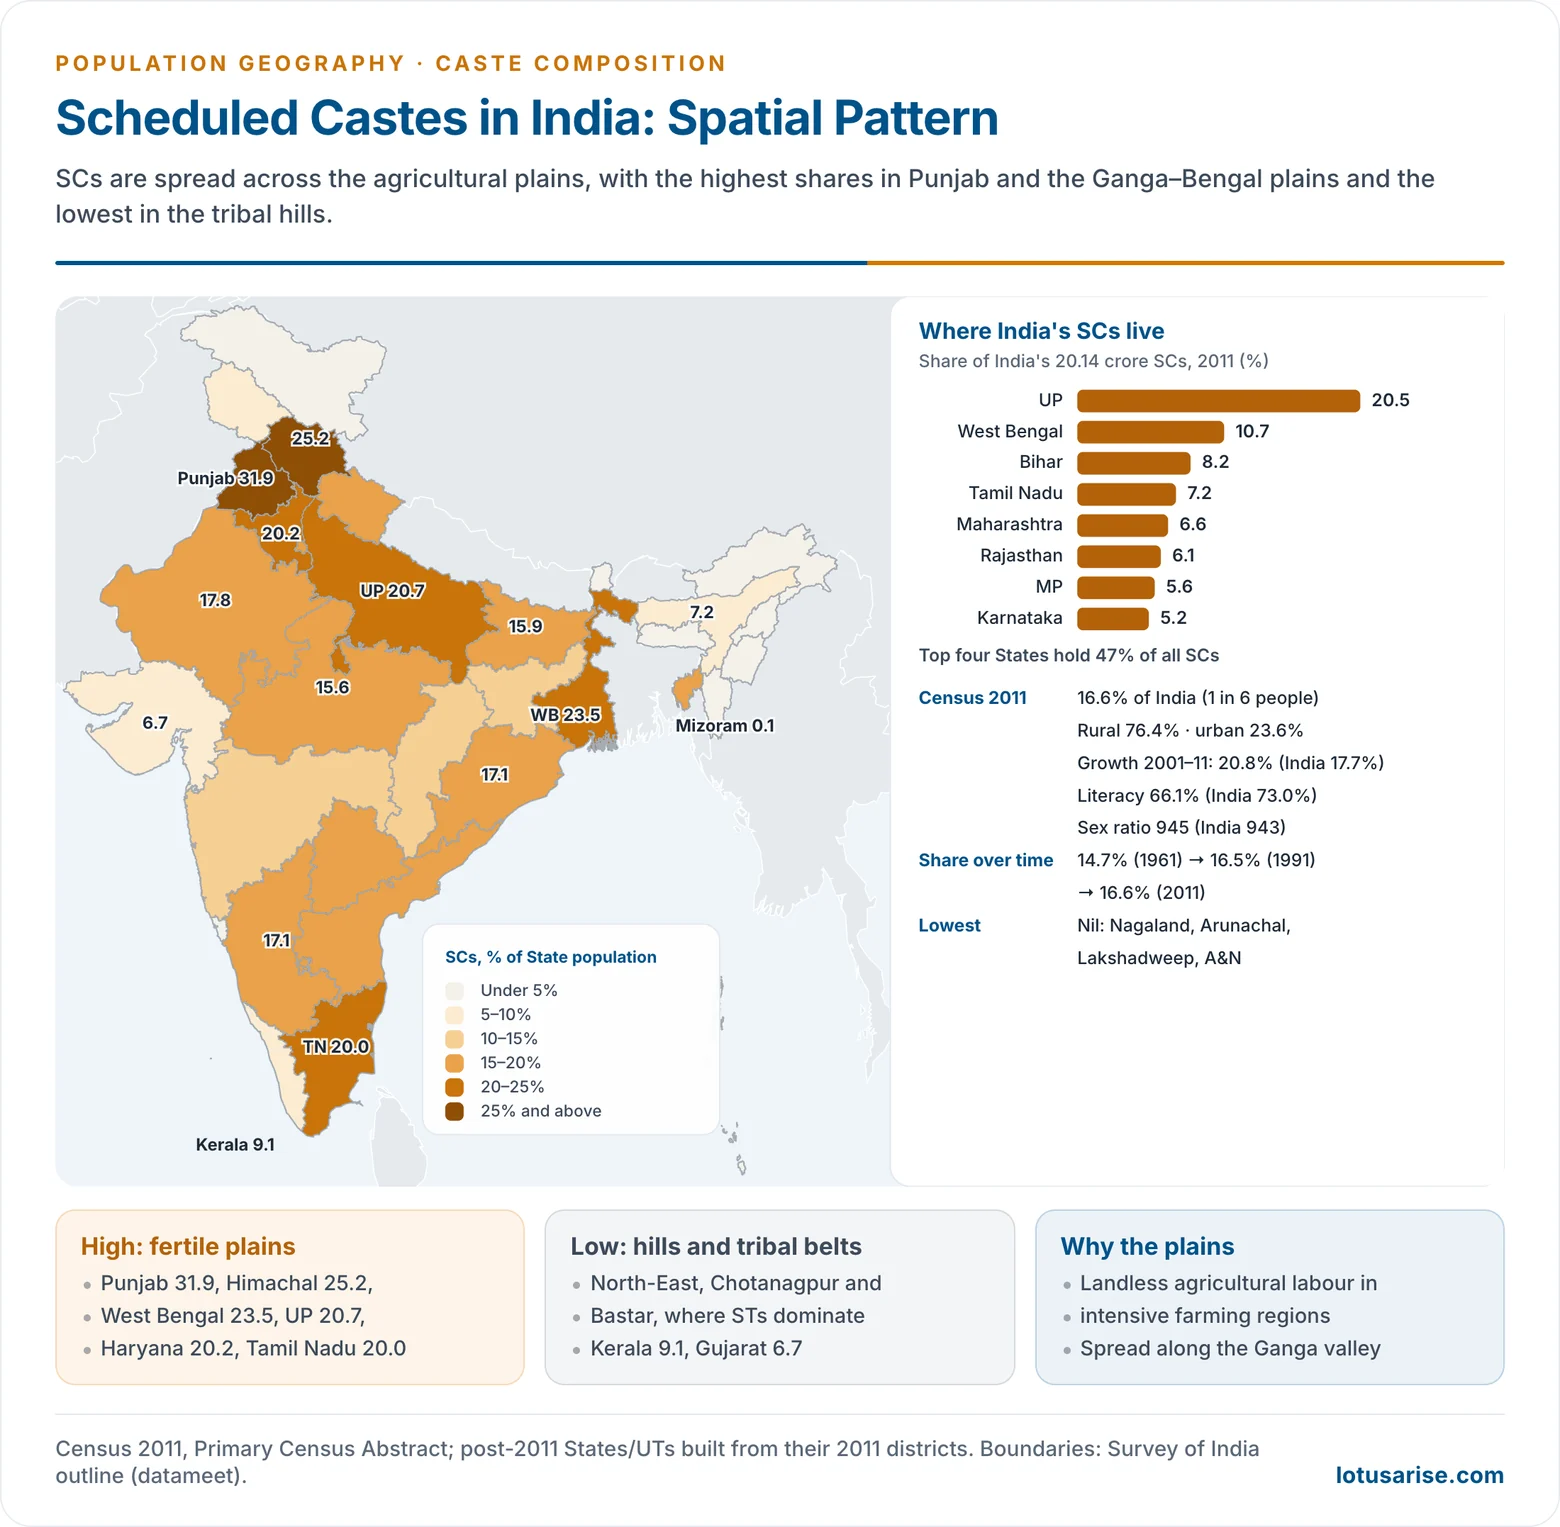
- Size: 20.14 crore, or 16.6% of India: about one in six Indians.
- Growth: the SC population rose from 6.44 crore (1961) to 20.14 crore (2011).
- Its share rose from 14.7% (1961) to 16.5% (1991) and 16.6% (2011).
- Decadal growth in 2001–11 was 20.8%, above the national 17.7%.
- Causes: higher fertility and the addition of communities to State lists.
- Lists change between censuses through Presidential orders and Acts of Parliament. The ST list, for example, added the Pahari people of Jammu and Kashmir in 2024, so shares are not strictly comparable over time.
- Rural character: 76.4% rural in 2011, down from about 80% in 2001.
- The urban SC population grew by about 41% in 2001–11, through migration to industrial and service jobs in the urban informal economy.
- Urban integration is still partial: SCs are over-represented in sanitation work, construction and casual labour.
- Occupation: mostly agricultural labourers, reflecting high landlessness, and workers in rural crafts and services.
- Social indicators:
- Literacy 66.1% against 73.0% for India; male 75.2%, female 56.5%. Female literacy rose from 41.9% in 2001.
- Sex ratio 945, close to the national 943.
Spatial Pattern
- High concentration: the fertile plains.
- The Indo-Gangetic plains: Punjab (31.9%), Haryana (20.2%), Uttar Pradesh (20.7%), and West Bengal (23.5%).
- Himachal Pradesh (25.2%), where SCs form a large part of the hill peasantry.
- The Kaveri delta and Tamil Nadu (20.0%), and the coastal plains of Andhra Pradesh.
- Punjab has the highest share of any State. The highest district is Koch Bihar (50.2%) in West Bengal, followed by the Doaba and south-western districts of Punjab (around 40%).
- Moderate (15–20%): Rajasthan, Uttarakhand, Bihar, Odisha, Karnataka, Andhra Pradesh, Telangana, Madhya Pradesh, Tripura.
- Low (5–15%): Maharashtra, Jharkhand, Chhattisgarh, Kerala, Assam, Gujarat, Jammu and Kashmir.
- Very low or nil: the north-eastern hills and the islands. Nagaland, Arunachal Pradesh, Lakshadweep and the Andaman and Nicobar Islands have no SC population; Mizoram and Meghalaya have under 1%.
- Major SC communities by region:
- Chamar/Jatav and Pasi in Uttar Pradesh; Ravidasia and Mazhabi in Punjab.
- Dusadh (Paswan) and Musahar in Bihar; Rajbanshi and Namasudra in West Bengal.
- Mahar and Matang in Maharashtra; Mala and Madiga in Andhra Pradesh and Telangana.
- Paraiyar, Pallar and Arunthathiyar in Tamil Nadu; Pulaya in Kerala.
- Regional concentration: four States hold about 47% of all SCs: Uttar Pradesh (20.5%), West Bengal (10.7%), Bihar (8.2%) and Tamil Nadu (7.2%).
- The pattern is positively associated with fertile agricultural regions and negatively associated with tribal, rugged terrain.
Factors in the SC Distribution
- Agrarian economy: intensive farming on the plains needed a large labour force, which the caste order drew from SC communities.
- Landlessness: without land, SCs depended on wage labour and stayed tied to village agriculture.
- Historical social structure: hereditary occupations and untouchability produced segregated settlements at the edge of villages.
- Absence of the caste order: tribal hills and the north-east, where Hindu caste society never took root, have few SCs.
- Religious conversion: conversion to Islam or Christianity removes people from the SC lists, lowering SC shares where conversion was large (Kerala, the coasts).
- Migration and urbanisation: movement to industrial and urban centres (Delhi, Chandigarh, Punjab’s towns) is slowly changing the old pattern.
Scheduled Tribes: Demography and Spatial Pattern
Demographic Profile
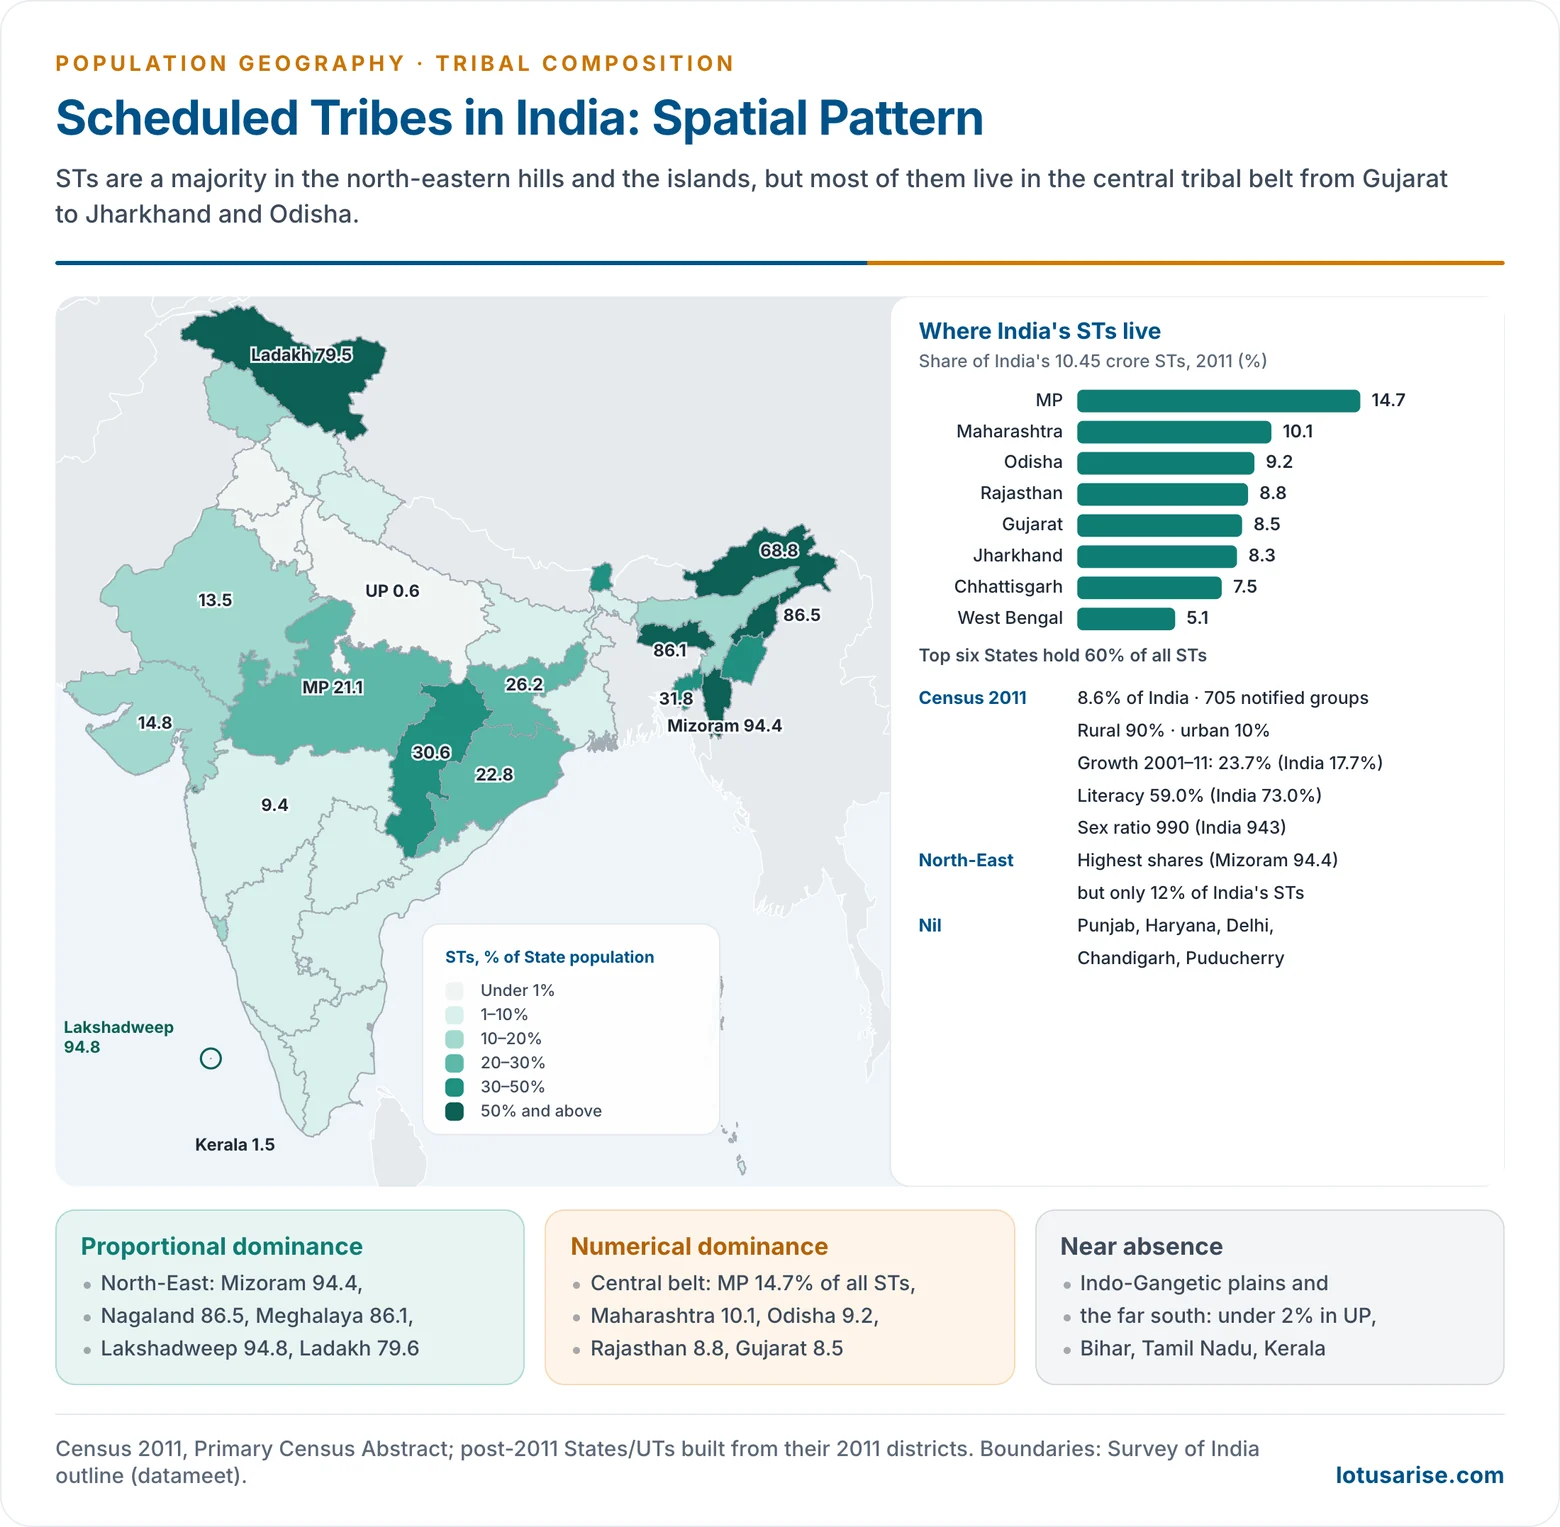
- Size: 10.45 crore, or 8.6% of India. The share rose from 7.8% (1981) to 8.2% (2001) and 8.6% (2011).
- Growth: 23.7% in 2001–11, faster than SCs (20.8%) and India (17.7%), because of higher fertility and new notifications.
- Rural character: about 90% rural. The urban ST population grew by about 50% in 2001–11, but it is still only about 10% of all STs.
- Social indicators:
- Literacy 59.0%, lower than among SCs; male 68.5%, female 49.4%, a gender gap of 19 points.
- Literacy varies enormously between tribes: from about 97.5% among the Mizos to 31.8% among the Bakarwals of Jammu and Kashmir.
- Sex ratio 990 and child sex ratio 957, both well above India’s 943 and 919, reflecting the better status of women in many tribal societies.
- STs are a minority in national terms but extremely diverse: 705 notified groups speaking languages of four families (Austro-Asiatic, Tibeto-Burman, Dravidian and Indo-Aryan).
Socio-Economic Characteristics
- Most tribal households are rural and land- or forest-based: settled farming, shifting cultivation (jhum) in the north-east, minor forest produce, and wage work in mines and plantations.
- Women’s work is central, which helps explain the high sex ratio.
- Limited access to schools, health care and roads follows from remoteness and scattered settlement.
- Tribal societies also hold ecological knowledge and practise community management of forests, water and land, making them custodians of biodiversity.
- Their marginalisation has three roots: geographical isolation, colonial forest laws that cut access to forests, and development-induced displacement after Independence.
Spatial Pattern
- North-eastern tribal region: proportional dominance.
- Mizoram (94.4%), Nagaland (86.5%), Meghalaya (86.1%), Arunachal Pradesh (68.8%).
- Sikkim (33.8%), Tripura (31.8%), Manipur (40.9%).
- Assam (12.4%) is the exception: its Brahmaputra valley is dominated by non-tribal plains people.
- Central tribal belt: numerical dominance.
- From Gujarat and Rajasthan through Madhya Pradesh, Maharashtra and Chhattisgarh to Jharkhand and Odisha.
- Chhattisgarh (30.6%), Jharkhand (26.2%), Odisha (22.9%), Madhya Pradesh (21.1%).
- Madhya Pradesh has the most STs (14.7% of India’s total), followed by Maharashtra (10.1%) and Odisha (9.2%).
- Islands and the trans-Himalaya: Lakshadweep (94.8%), Ladakh (79.6%), Dadra and Nagar Haveli (52.0% in 2011), and the Andaman and Nicobar Islands (7.5%, including PVTGs such as the Jarawa, Onge and Sentinelese).
- Low or nil: the Indo-Gangetic plains and the far south.
- Nil in Punjab, Haryana, Delhi, Chandigarh and Puducherry; under 2% in Uttar Pradesh, Bihar, Tamil Nadu and Kerala.
- Karnataka (7.0%) and Telangana (9.3%) are moderate.
- Numerical vs proportional dominance:
- Six States (Madhya Pradesh, Maharashtra, Odisha, Rajasthan, Gujarat, Jharkhand) hold about 60% of all STs.
- The north-east has the highest shares but only about 12% of India’s STs.
- District level: STs form a majority in 90 of 640 districts (2011), such as Alirajpur (89.0%), Jhabua (87.0%), Nandurbar (69.3%), Gumla (68.9%) and Bastar (65.9%).
Determinants of the ST Distribution
- Relief and terrain: STs live mainly in hills, plateaus and forests: Chotanagpur, Bastar, the Satpura–Vindhya and Aravalli ranges, the Western Ghats’ Nilgiris and the north-eastern hills.
- Historical refuge: isolated areas acted as refuges from expanding agrarian states and kept distinct cultures.
- Economic base: shifting cultivation, forest produce, hunting and gathering, and terrace farming, with limited market links until recently.
- Marginalisation: colonial forest laws, later mining, dams and industry (Chotanagpur, Odisha) have displaced many tribal people and pushed migration to plantations, mines and cities.
- The largest tribal groups of these regions are the Bhils, Gonds, Santhals, Mundas and Oraons of the central belt and the Nagas, Khasis, Garos and Mizos of the north-east. Their tribal areas share problems of land alienation, displacement, debt and poor services.
SCs and STs Compared
Why Their Distributions Differ
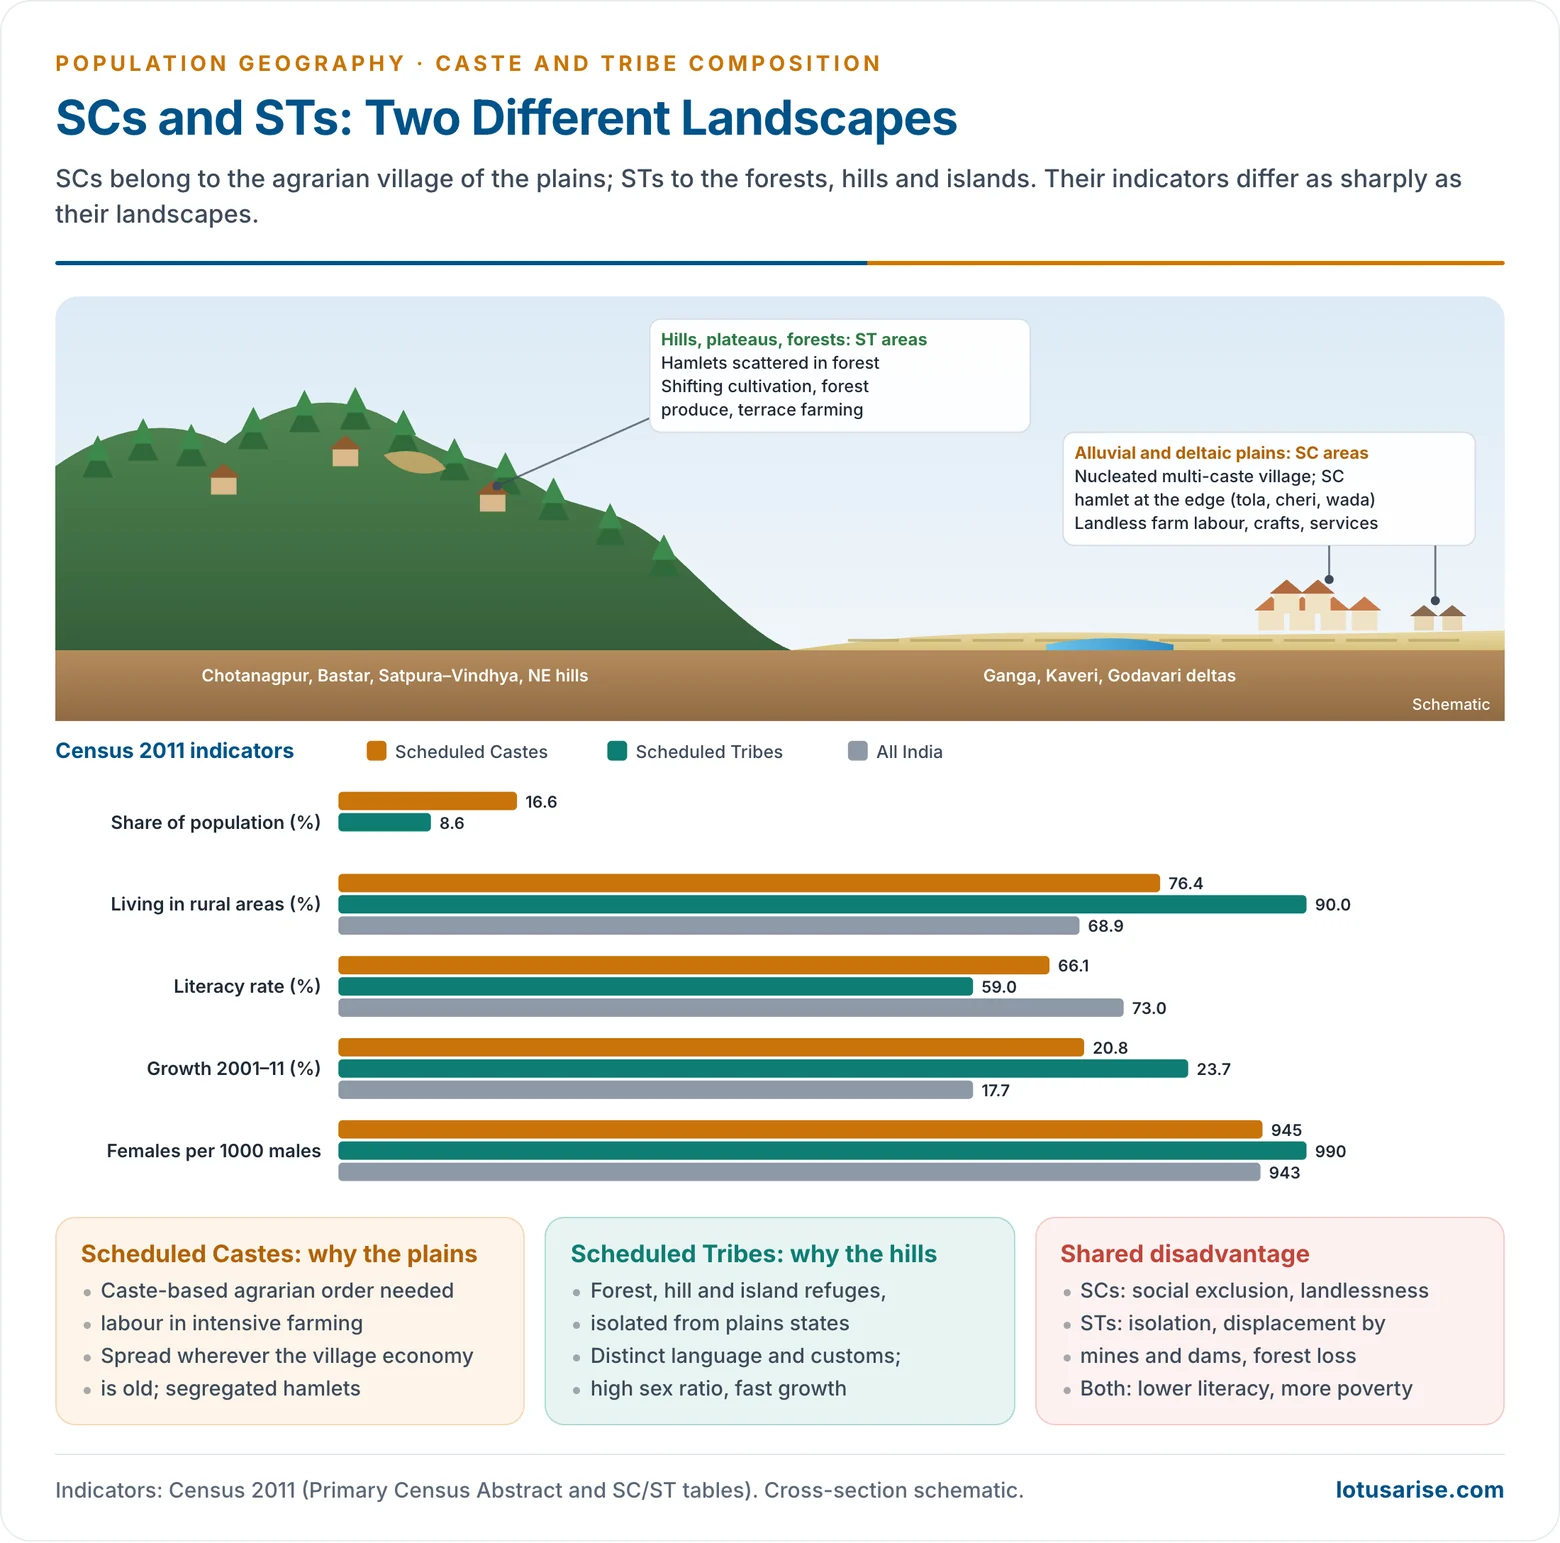
- Two historical economic systems:
- The agrarian caste economy of the plains placed SCs at its base as labourers and service castes.
- The forest and hill economy of tribal regions lay outside the caste order.
- Terrain: SCs follow fertile, irrigated, densely settled land; STs follow rugged, forested, sparsely settled land. The two maps are therefore nearly complementary.
- Religion: STs show a negative association with Muslim concentrations and, in the north-east, a positive association with Christianity.
- Transition zones: where plains meet plateaus, both groups are large. Odisha (SC 17.1%, ST 22.9%), Jharkhand (12.1%, 26.2%), Chhattisgarh (12.8%, 30.6%) and Tripura (17.8%, 31.8%) have SCs in the valleys and STs in the uplands.
Measuring Concentration
- Population geographers compare regions with the location quotient (LQ):
- LQ = (group’s share of the region’s population) ÷ (group’s share of the national population).
- LQ above 1 means the group is over-represented; below 1, under-represented.
- Examples (Census 2011):
- SCs: Punjab 31.9 ÷ 16.6 = 1.9; Uttar Pradesh 1.2; Gujarat 0.4; Mizoram almost 0.
- STs: Mizoram 94.4 ÷ 8.6 = 11.0; Chhattisgarh 3.6; Madhya Pradesh 2.5; Uttar Pradesh 0.1.
- The ST distribution is far more concentrated than the SC distribution: ST LQs range from 0 to over 11, SC LQs from 0 to about 2.
- A choropleth of LQs or percentage shares is the usual way to map caste and tribe composition.
Shared Disadvantage
- Both groups are over-represented among the poor and the landless, with lower literacy and poorer health.
- In 2015–16, 50.6% of STs and 33.3% of SCs were multidimensionally poor, against 27.2% of OBCs (Global MPI 2021, from NFHS-4).
- Five out of six multidimensionally poor Indians lived in households headed by a member of an ST, SC or OBC.
- The roots differ: social exclusion and landlessness for SCs; isolation, displacement and loss of forest rights for STs.
- Regions of high SC or ST concentration often coincide with low human development: the Ganga plain for SCs, the central tribal belt for STs.
- Caste and tribe intersect with gender, class and region to produce multi-dimensional inequality.
Constitutional and Policy Framework
- Article 46 directs the State to promote the educational and economic interests of SCs and STs and protect them from social injustice and exploitation.
- Article 17 abolishes untouchability.
- Reservation in education and public jobs (Articles 15(4), 16(4)) and in Lok Sabha and State Assemblies (Articles 330, 332).
- Commissions: the National Commission for Scheduled Castes (Article 338) and the National Commission for Scheduled Tribes (Article 338A, 2003).
- Tribal self-rule: the Fifth and Sixth Schedules, PESA (1996) and the Forest Rights Act (2006).
- Protection: the SCs and STs (Prevention of Atrocities) Act, 1989.
- Planning: the old Special Component Plan for SCs and the Tribal Sub-Plan now run as development action plans in which ministries earmark funds for SCs and STs.
Contemporary Transformations
- Urbanisation and education are widening occupational mobility and weakening caste roles.
- Sub-classification: in August 2024 the Supreme Court allowed States to sub-classify SCs for reservation, so that the most deprived groups within the list (for example the Musahars or Valmikis) get a fair share.
- Targeted tribal programmes now focus on the poorest: PM-JANMAN (2023) for the 75 PVTGs covers housing, roads, water and health in their habitations.
- Political assertion: caste-based parties and movements have strengthened democratic participation and identity politics.
- Persisting problems:
- Caste discrimination and violence, and segregated settlements.
- Tribal displacement by mining and dams, and loss of livelihoods.
- Wide regional disparities in development.
- The caste data of the 2027 census will, for the first time since 1931, give a full caste composition of India.




