

- Water scarcity is the lack of enough fresh water of acceptable quality to meet the needs of people, economies and ecosystems in an area.
- It arises when demand exceeds available supply, or when supply cannot reach users because of poor infrastructure, pollution or unfair allocation.
- Scale:
- roughly half of humanity, about 4 billion people, faces severe water scarcity for at least one month a year;
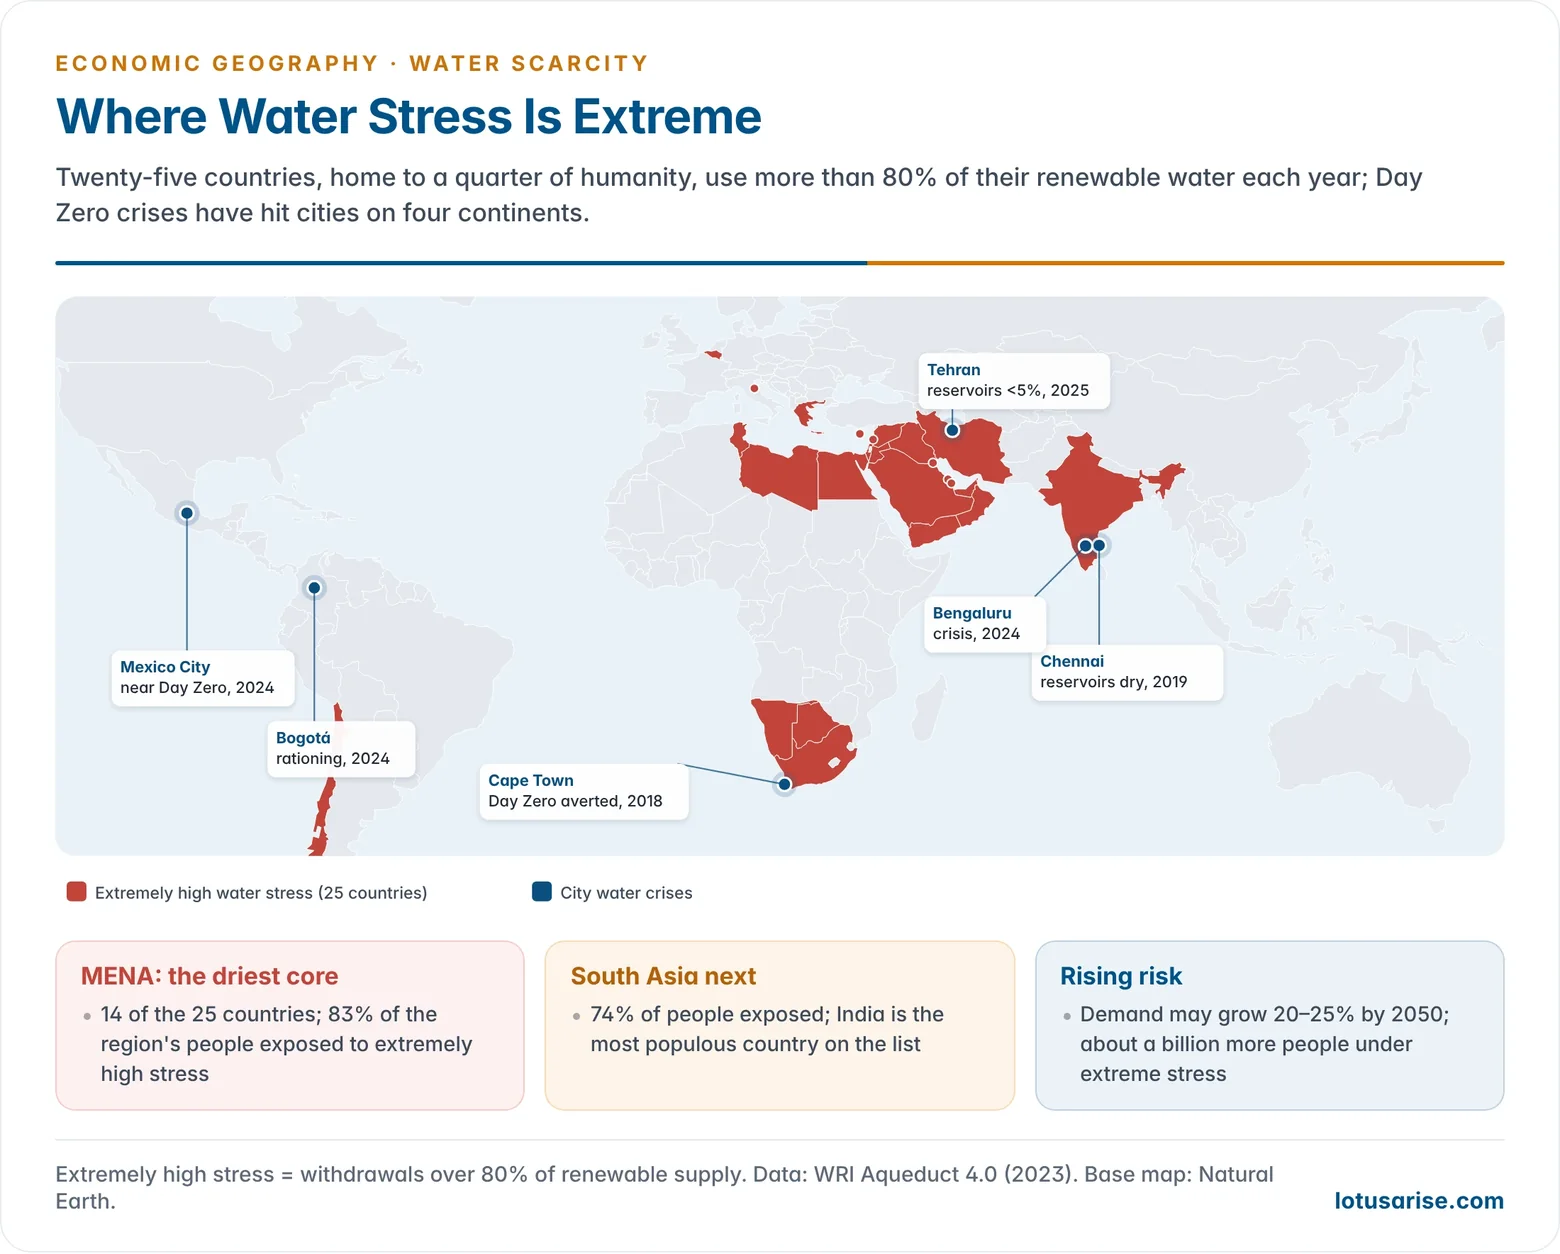
- 25 countries, home to a quarter of the world’s population, face extremely high water stress;
- about 2 billion people lack safely managed drinking water.
- Water is a renewable but finite resource, and its supply is fixed by the hydrological cycle. Rising demand, pollution and climate change shrink the amount that is usable when and where it is needed.
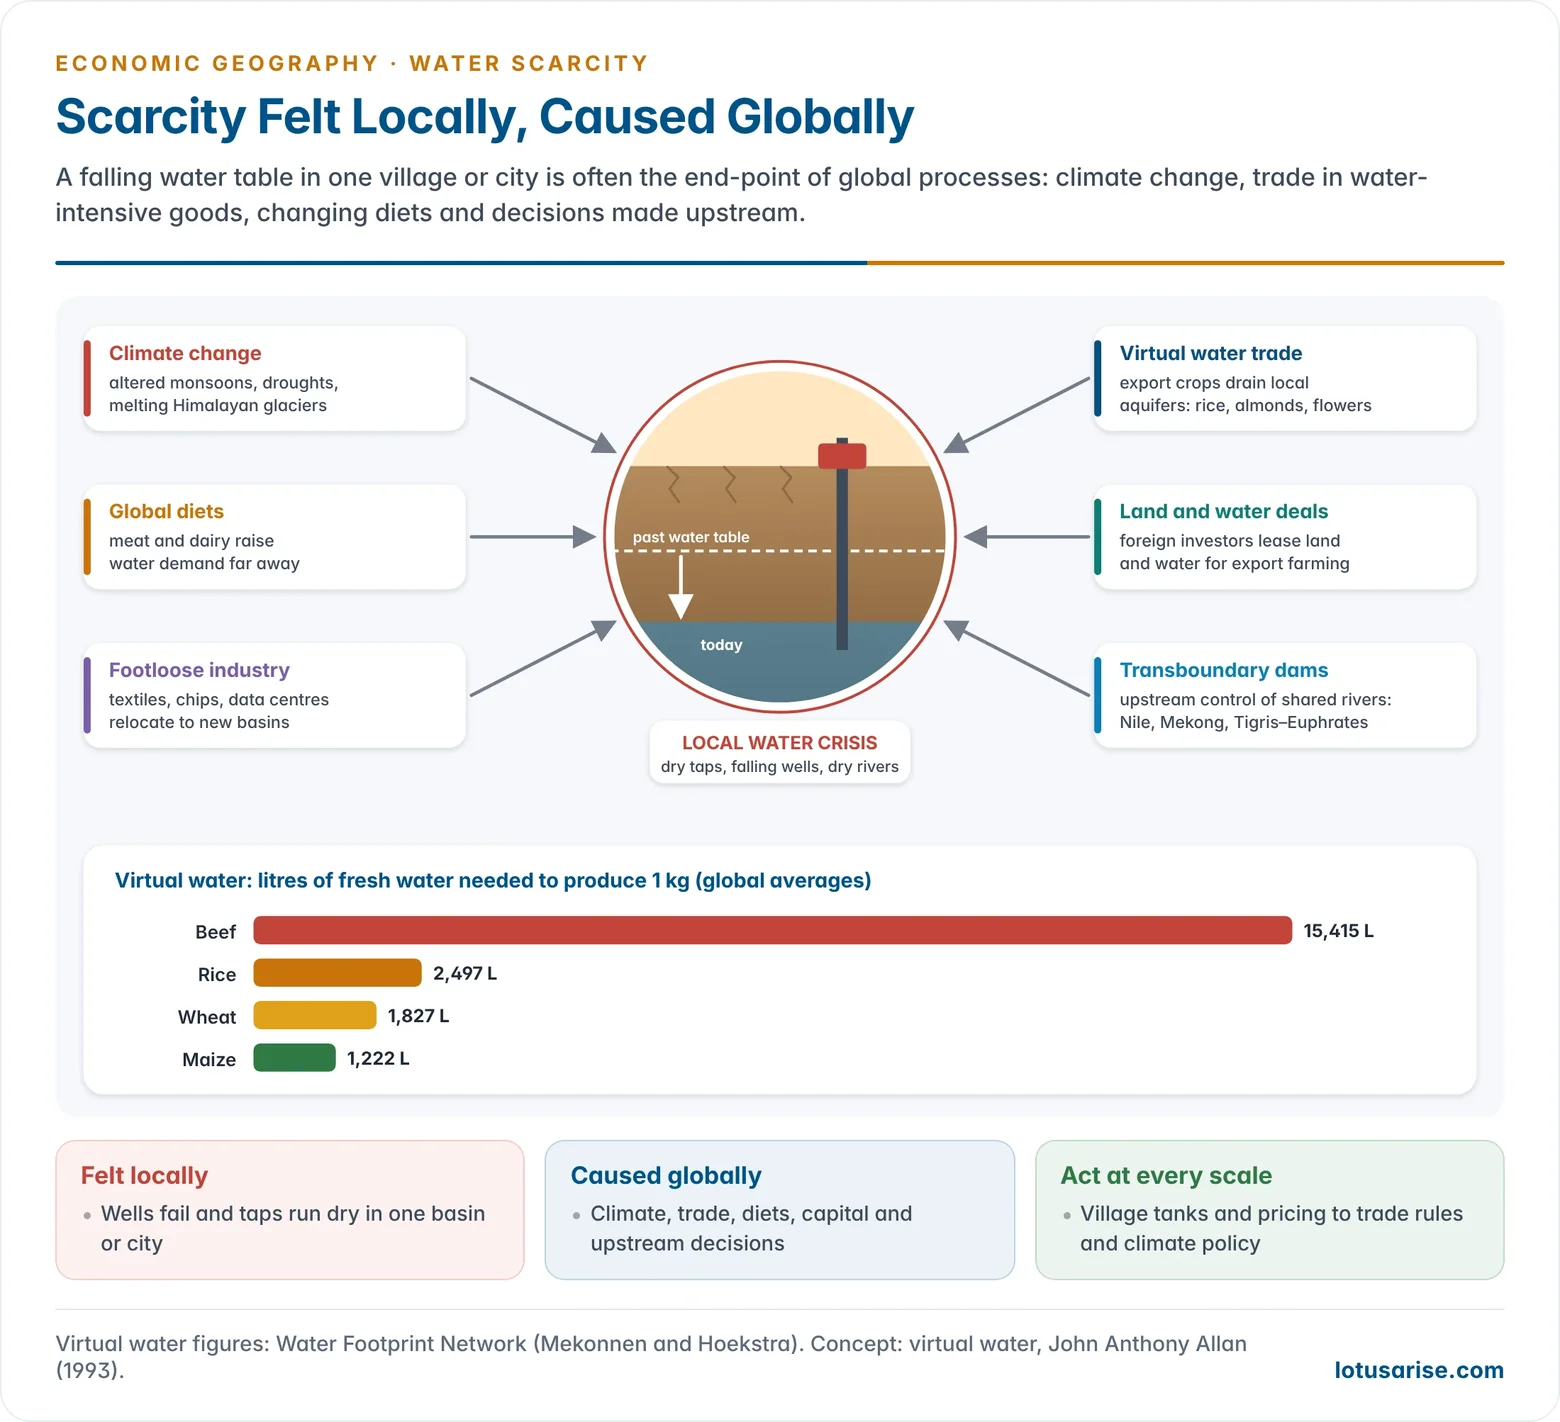
- The key geographical insight: scarcity is felt locally (a dry tap, a falling well, a drying river) but is increasingly caused globally, through climate change, trade and global supply chains.
Water Resources, Distribution and Causes of Scarcity

How Much Water Is Usable?
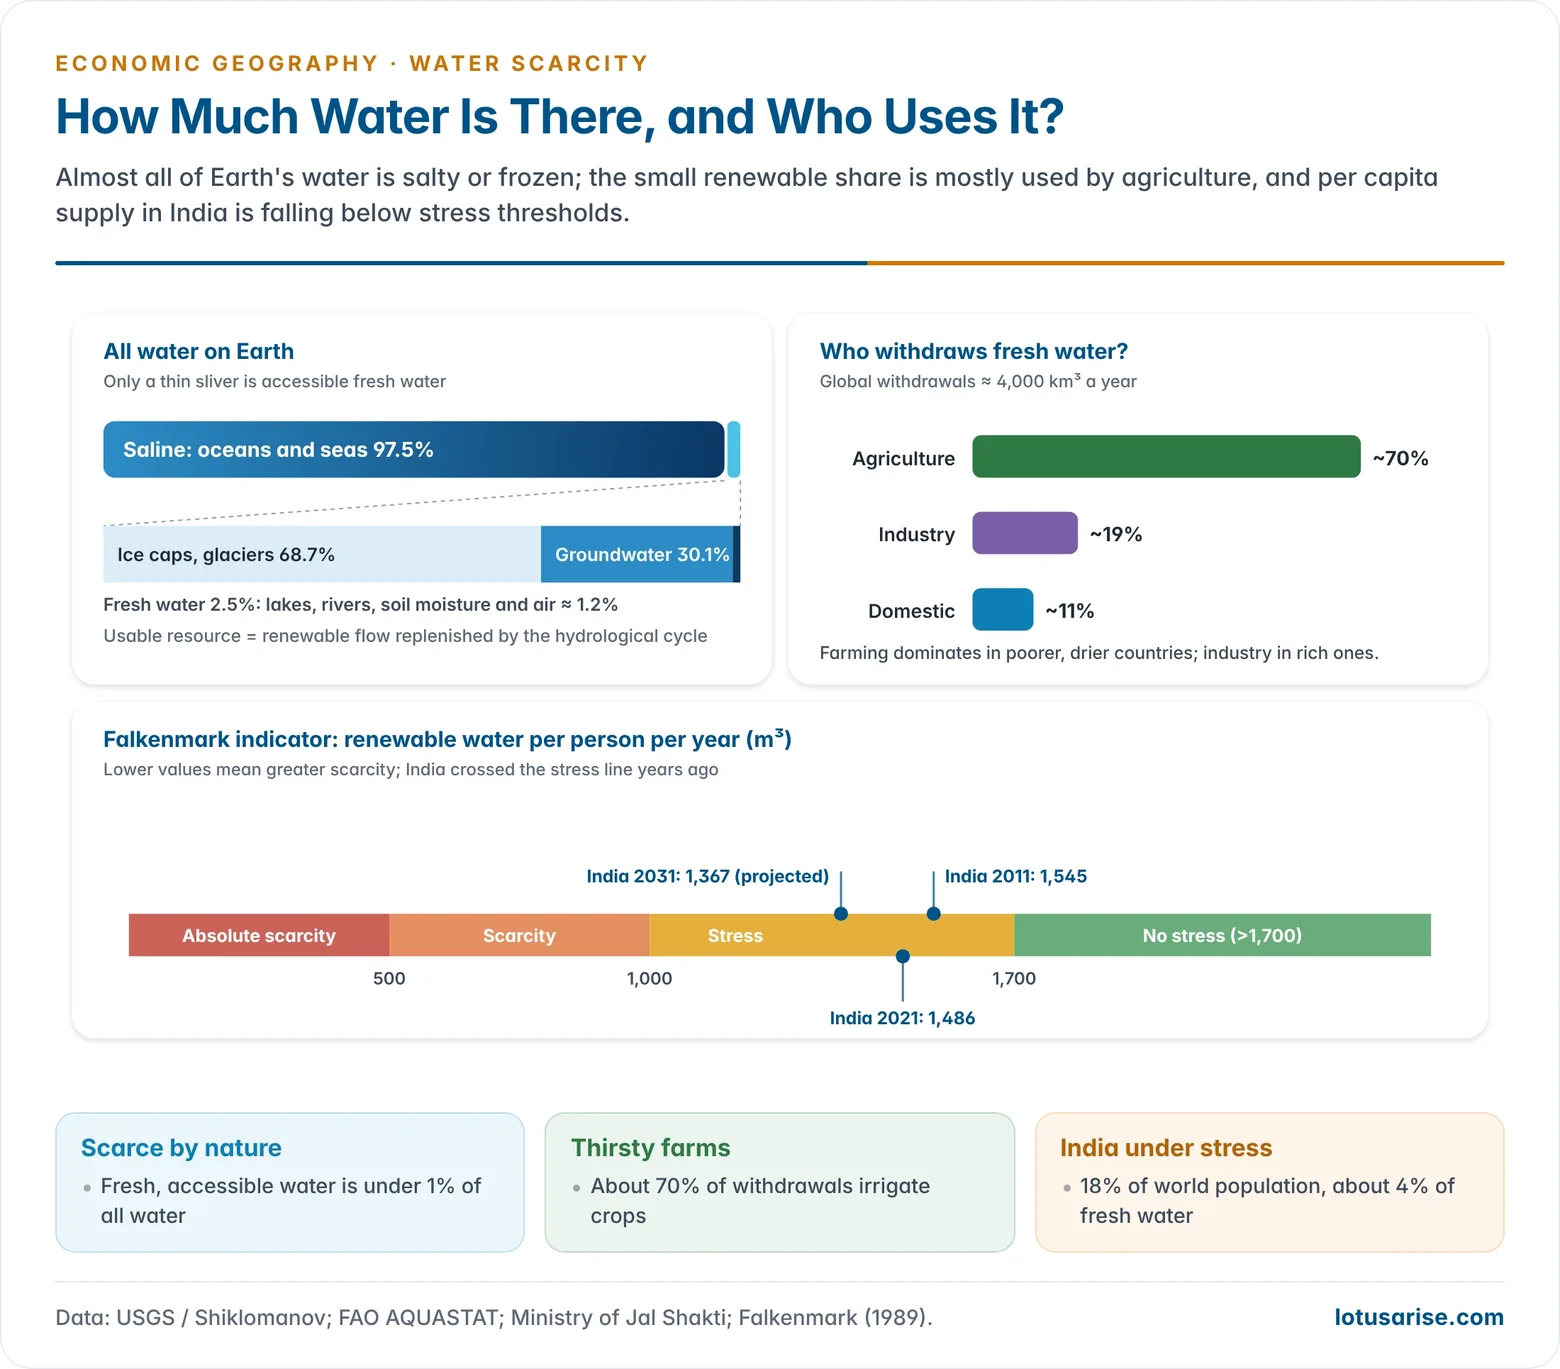
- Of all water on Earth, about 97.5% is saline. Only about 2.5% is fresh, and of this:
- about 69% is locked in ice caps and glaciers;
- about 30% is groundwater, much of it deep or fossil;
- only about 1% is in lakes, rivers, soil moisture and the atmosphere.
- Renewable freshwater, the water replenished each year by the hydrological cycle, is the realistic resource. Its distribution is very uneven.
- Global withdrawals are about 4,000 km³ a year:
- agriculture about 70%;
- industry about 19%;
- domestic use about 11–12%.
Uneven Spatial and Seasonal Distribution
- Mismatch of people and water:
- Asia has about 60% of the world’s people but only about 36% of river runoff;
- South America has about 6% of the people and about 26% of the runoff.
- Water-rich countries: Brazil, Russia, Canada, the USA, China, Indonesia and Colombia hold the largest renewable supplies. Much of it is in thinly peopled basins such as the Amazon, Congo, Yenisei and Mackenzie.
- Water-poor regions: the subtropical deserts and drylands under the descending air of the Hadley cell:
- West Asia and North Africa (MENA);
- Central Asia;
- the south-western USA;
- northern China;
- north-western India and Pakistan;
- south-western Africa;
- inland Australia.
- Seasonality and variability:
- monsoon lands receive most rain in 3–4 months;
- dry seasons, droughts and the year-to-year swings of El Niño make supply unreliable even in humid regions;
- glacier- and snow-fed rivers (Indus, Ganga, Amu Darya) depend on the timing of melt.
Proximate Causes of Water Scarcity
- Population growth and urbanisation: more people and fast-growing cities need more water for homes, industry and food. Cities also pave over recharge zones and lakes.
- Irrigation expansion and inefficiency: flood irrigation of thirsty crops wastes much of the water drawn, and subsidised power and water remove the incentive to save.
- Groundwater over-extraction: tube wells draw water faster than rain recharges it, so water tables fall year after year. Fossil aquifers such as those under Saudi Arabia and Libya are not recharged at all.
- Pollution: over 80% of the world’s wastewater is released untreated. Pollution turns available water into unusable water, a form of quality scarcity, as in the Yamuna and many Chinese rivers.
- Degradation of catchments: deforestation, wetland loss and soil erosion reduce infiltration, so rain runs off quickly instead of recharging aquifers.
- Climate variability and change: longer droughts, erratic monsoons, heatwaves and shrinking glaciers.
- Weak governance and inequity: poor maintenance, leaking pipes, unclear water rights, and the capture of water by the powerful leave the poor, women and marginal groups short, even where water exists.
Groundwater: The Hidden Crisis
- Groundwater supplies about half of the world’s drinking water and over 40% of irrigation water. Because it is invisible, its depletion is noticed late.
- Satellite gravity measurements by the GRACE missions (from 2002) revealed fast depletion under:
- north-western India;
- the North China Plain;
- the Middle East;
- California’s Central Valley;
- the Ogallala aquifer of the US High Plains.
- Effects:
- deeper and costlier pumping;
- drying of springs and river base flow;
- land subsidence, as in Jakarta, Mexico City and parts of Punjab;
- seawater intrusion into coastal aquifers;
- rising arsenic and fluoride contamination in some aquifers.
- Groundwater is a classic open-access resource: each farmer pumps more before a neighbour does. This is why community management and power-supply reform matter.
Measuring Water Scarcity
Physical and Economic Scarcity
| Type | Meaning | Regions |
|---|---|---|
| Physical scarcity | Demand exceeds natural supply; most river flow is already withdrawn; rivers fail to reach the sea | MENA, Central Asia (Aral basin), north-western India, northern China, south-western USA, Murray–Darling basin |
| Approaching physical scarcity | Withdrawals close to sustainable limits | Parts of South Asia, South Africa, Mexico |
| Economic scarcity | Water exists, but money, infrastructure or institutions to use it are lacking | Much of Sub-Saharan Africa, parts of South and South-East Asia |
| Little or no scarcity | Ample supply relative to use | Northern Europe, Canada, Amazonia, Congo basin |
- The International Water Management Institute (2007) popularised this distinction.
- It shows that scarcity is a social and economic condition, not only a matter of rainfall. Rich desert states such as Israel and the UAE overcome physical scarcity with desalination and recycling. Poor but wet countries suffer economic scarcity.
Indicators of Scarcity
- Falkenmark indicator (Malin Falkenmark, 1989): renewable water per person per year.
- Below 1,700 m³: water stress.
- Below 1,000 m³: water scarcity.
- Below 500 m³: absolute scarcity.
- Water stress ratio: withdrawals as a share of renewable supply.
- Above 40% is high stress.
- Above 80% is extremely high stress.
- This underlies the WRI Aqueduct rankings and SDG indicator 6.4.2.
- Water footprint (Arjen Hoekstra, 2002): the total fresh water used to make the goods and services a person or nation consumes. It has three parts:
- blue water: surface and groundwater;
- green water: rain stored in soil;
- grey water: the water needed to dilute pollution.
- Virtual water (John Anthony Allan, 1993): the water embedded in a traded product. A country that imports a tonne of wheat imports the water used to grow it.
Scarcity Felt Locally, Caused Globally
- Local signs: dry taps and tanker supply, falling water tables, failing wells, dried lakes and rivers, quarrels over canals and dams, and “Day Zero” alerts in cities.
- Why the causes are increasingly global:
- Climate change: warming changes rainfall patterns, intensifies droughts and evaporation, and melts the glaciers that feed Asian rivers. The Himalaya–Hindu Kush “water tower” supplies rivers used by nearly two billion people.
- Virtual water trade and global supply chains: water-scarce regions export water-intensive crops to distant consumers. Examples:
- Peru’s Ica valley asparagus;
- Kenya’s Lake Naivasha cut flowers for Europe;
- California’s almonds;
- India’s rice exports from groundwater-depleting Punjab and Haryana.
- The consumer is global; the depletion is local.
- Global diets and demand: rising meat and dairy consumption raises water demand. A kilogram of beef needs about 15,000 litres, against about 1,800 litres for a kilogram of wheat.
- Global capital and land deals: foreign investors lease land, and with it water, in Africa and Asia for export agriculture and biofuels.
- Relocation of industry: water-intensive manufacturing, textiles, semiconductors and data centres move to new regions and draw down local supplies.
- Transboundary rivers, the subject of many international water disputes: about 60% of global river flow crosses borders. Upstream dams change downstream supply, as with the Nile (Ethiopia’s GERD), the Mekong dams in China and Laos, and the Tigris–Euphrates.
- Global pollution and teleconnections: ENSO-driven droughts strike several continents at once, and pollution from distant sources degrades shared waters.
- Conclusion: local scarcity is the end-point of global processes. Solutions therefore need action at every scale, from the village tank to international trade and climate policy.
Global Pattern and Consequences
Where Water Stress Is Highest
- Extremely high water stress (WRI Aqueduct, 2023), 25 countries:
- MENA dominates: Bahrain, Cyprus, Kuwait, Lebanon, Oman, Qatar, the UAE, Saudi Arabia, Israel, Egypt, Libya, Yemen, Iran, Jordan, Tunisia, Iraq and Syria;
- outside MENA: Botswana, Namibia and South Africa; Chile; Belgium, Greece and San Marino; and India.
- MENA is the most stressed region, with 83% of its people exposed to extremely high stress. South Asia is second, at 74%.
- By 2050, global water demand may rise by 20–25%, and about a billion more people could face extremely high stress.
- “Day Zero” cities:
- Cape Town (2018), Chennai (2019), Mexico City and Bengaluru (2024), and Tehran (2025), where reservoirs fell to near-empty;
- Bogotá rationed water in 2024.
Consequences
- Food security: irrigated agriculture produces about 40% of the world’s food from about a fifth of cropland. Groundwater depletion in the North China Plain, Punjab and the US High Plains (Ogallala aquifer) threatens it.
- Health and equity: unsafe water and sanitation spread diarrhoeal disease, cholera and typhoid. Women and girls bear most of the burden of fetching water, which costs them time for school and paid work. The urban poor often pay more per litre to tankers than richer households pay for piped supply.
- Economy: the World Bank warns that water scarcity could cut GDP by up to 6% by 2050 in some regions. Thermal power plants, industry and cities face shutdowns; India lost power output when plants ran short of cooling water.
- Conflict and cooperation: disputes over the Nile, Indus, Tigris–Euphrates and Mekong are long-running.
- Water has more often led to treaties (the Indus Waters Treaty, 1960) than to wars.
- India placed the Indus Waters Treaty in abeyance in April 2025, showing how water is tied to security.
- Migration: drought and water loss push rural people to cities and across borders, as in the Sahel and Syria before 2011.
- Ecosystems: the Aral Sea shrank after Soviet irrigation diverted the Amu Darya and Syr Darya. Wetlands, deltas and river fish decline wherever flows are over-drawn.
Lessons from City Crises
- Cape Town (2018): after three dry years the city announced a “Day Zero” for shutting taps. It avoided it by cutting use to 50 litres per person a day, steep tariffs, pressure management and public campaigns, roughly halving consumption.
- Chennai (2019): its four main reservoirs ran dry after a failed monsoon. Water was brought by train from Jolarpettai. The city then invested in desalination, lake restoration and compulsory rainwater harvesting.
- Israel: a desert country that became water-secure through drip irrigation, the reuse of almost all treated sewage for farming, large seawater desalination plants and strict pricing. Physical scarcity can be managed with technology, money and institutions.
- Aral Sea: the reverse lesson. Over-diversion for cotton destroyed a large lake, its fisheries and the health of the people around it.
Managing Water Scarcity
- Integrated Water Resources Management (IWRM): planning land, water and ecosystems together, at the river basin or watershed scale.
- Demand management:
- “more crop per drop” through drip and sprinkler irrigation;
- crop diversification away from paddy and sugarcane in dry regions;
- water pricing and metering;
- leak reduction in city networks.
- Supply augmentation:
- rainwater harvesting;
- check dams and tanks;
- managed groundwater recharge;
- desalination, as in the Gulf states, Israel and Chennai. Nearly half of world desalination capacity is in West Asia and North Africa, led by Saudi Arabia. It is energy-intensive, and the brine it releases harms coastal ecosystems;
- reuse of treated wastewater, as in Singapore’s NEWater.
- Virtual water strategy: water-scarce countries import water-intensive food, as the Gulf states do with cereals, instead of mining their own aquifers.
- Nature-based solutions: restoring wetlands, forests and floodplains that store and clean water.
- Global governance:
- SDG 6 (clean water and sanitation for all by 2030);
- the UN 2023 Water Conference, the first since 1977;
- transboundary basin agreements and data sharing.
Water Scarcity in India
- India has about 18% of the world’s population but only about 4% of its fresh water resources.
- Per capita availability is falling:
- about 1,545 m³ in 2011;
- 1,486 m³ in 2021;
- a projected 1,367 m³ by 2031.
- This is already below the water-stress threshold of 1,700 m³.
- Groundwater: India is the world’s largest user of groundwater, about a quarter of global extraction.
- The national stage of extraction is about 60%.
- It exceeds 100% in many blocks of Punjab, Haryana, Rajasthan and Delhi.
- Stress and crises: a NITI Aayog index (2018) found about 600 million people facing high to extreme water stress. Chennai’s taps ran dry in 2019, and Bengaluru faced a severe crisis in 2024.
- Causes:
- monsoon variability;
- free or cheap power for pumping;
- paddy and sugarcane grown in dry regions;
- urban growth over lakes;
- pollution of rivers;
- inter-state water disputes.
- Responses:
- the Jal Jeevan Mission (2019, tap water to rural homes);
- Atal Bhujal Yojana (community groundwater management);
- Jal Shakti Abhiyan: Catch the Rain;
- Mission Amrit Sarovar (2022, ponds in every district);
- PMKSY: Per Drop More Crop;
- watershed programmes;
- river interlinking projects such as Ken–Betwa.
Previous Year Questions
2024Water Scarcity is an important cause of disputes and conflicts in India. Suggest innovative methods for location-based solutions.2024“While scarcity of water resources are felt locally, but its causes are increasingly global.” Comment.2017Discuss the freshwater crisis in India and prepare a blueprint for its sustainable management.




