

- Density is the mass of seawater per unit volume. With temperature and salinity it is one of the three physical properties that decide where a parcel of water sits in the ocean and whether it moves up or down: lighter water floats over denser water, and water made denser at the surface sinks.
- Density differences arrange the ocean into layers and water masses: large bodies of water, each with a near-uniform temperature–salinity signature acquired at the surface where it formed.
- These differences drive the slow, deep, density-driven (thermohaline) circulation, which moves about 90% of the ocean’s volume below the wind-stirred surface layer. The T-S diagram is the tool that ties the three together: it reads density off temperature and salinity, and identifies water masses and their mixing.
Density of Seawater

Meaning and units
- Pure water is densest at about 4 °C (3.98 °C), where 1 cm³ weighs 1 g (1,000 kg/m³). Dissolved salts make seawater heavier: open-ocean surface water ranges from about 1,020 to 1,029 kg/m³, averaging about 1,025 kg/m³, which is 2–3% denser than pure water.
- Because only the second and third decimal places change, oceanographers use sigma-t (σt):
- σt = (density in g/cm³ − 1) × 1,000, the density at the water’s own temperature and salinity but at surface (atmospheric) pressure. A density of 1.0257 g/cm³ is written σt = 25.7.
- Potential density (σθ) is the density a parcel would have if brought adiabatically to the surface. It removes the effects of compression and of the slight heating that compression causes, and is the standard measure for deep water. σ2 and σ4 are referenced to 2,000 m and 4,000 m for comparing deep water masses.
- In-situ density at depth is higher still, because pressure squeezes the water. At the floor of the Challenger Deep (about 10,900 m) it reaches about 1,073 kg/m³, only about 4.5% above the surface value.
- The international standard since 2010 is TEOS-10 (Thermodynamic Equation of Seawater 2010), which computes density from absolute salinity, conservative temperature and pressure. It replaced the 1980 equation of state (EOS-80).
Controls on density
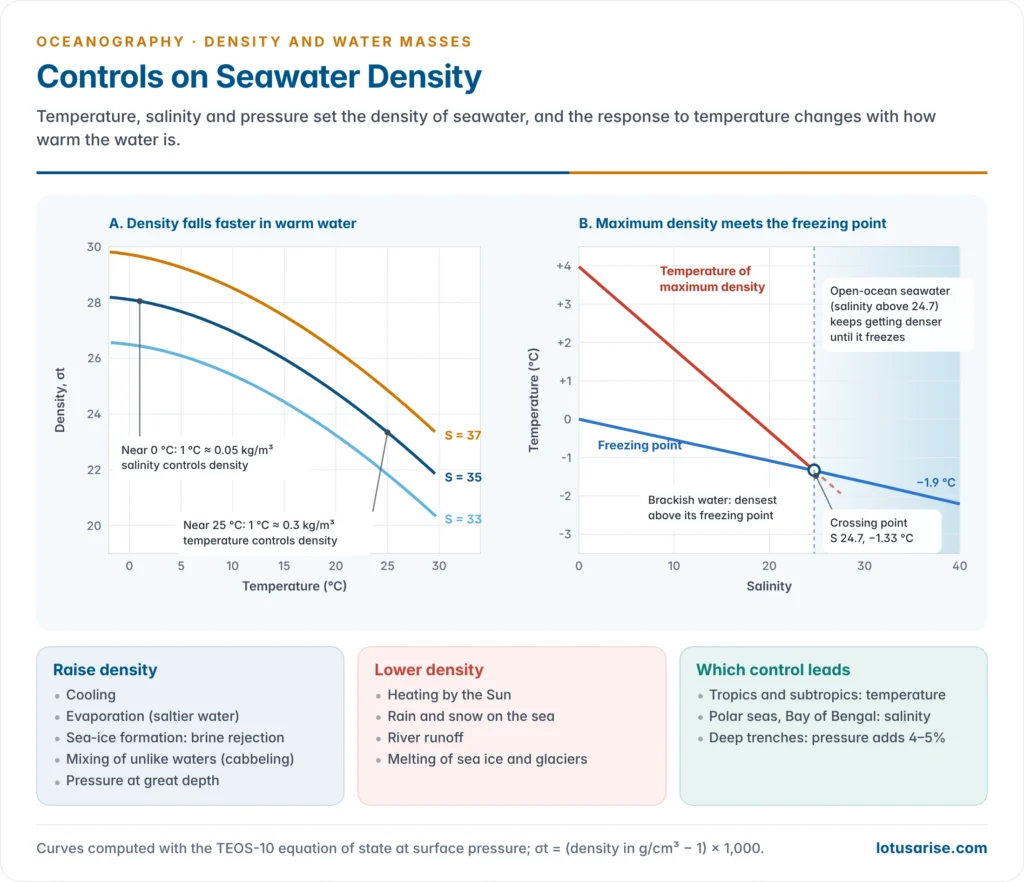
Temperature: the dominant control in the open ocean
- Density varies inversely with temperature. Heating expands water (thermal expansion) and cooling contracts it. This is why surface density rises from the equator towards the poles even though surface salinity peaks in the subtropics.
| Temperature (°C, salinity 35) | 0 | 10 | 20 | 25 | 30 |
|---|---|---|---|---|---|
| Density (kg/m³) | 1,028.1 | 1,027.0 | 1,024.8 | 1,023.3 | 1,021.7 |
| σt | 28.1 | 27.0 | 24.8 | 23.3 | 21.7 |
- The effect is non-linear. A 1 °C change in warm tropical water (25 °C) alters density about five to six times as much as the same change in water near 0 °C.
- In the tropics temperature therefore dominates density. In cold polar water it hardly matters, and salinity takes over.
- Seawater has no density maximum above its freezing point. Dissolved salt lowers both the temperature of maximum density and the freezing point, and the two lines cross at a salinity of 24.7 and −1.33 °C.
- Above 24.7 (all open-ocean water) seawater keeps getting denser as it cools, right down to its freezing point (about −1.9 °C at a salinity of 35).
- So a cooling polar sea overturns continuously: surface water sinks until the whole column is near freezing. A freshwater lake, by contrast, stops convecting at 4 °C and freezes over a warmer bottom layer.
Salinity
- Density rises with salinity: each unit of salinity adds about 0.8 kg/m³. At 4 °C and a salinity of 35 the density is about 1,027.8 kg/m³.
- The relative weight of salinity grows as water cools. One unit of salinity offsets about 2.5 °C of temperature in tropical water but about 15 °C in water near 0 °C.
- This is why salt-stratified regions are cold or heavily diluted: the Arctic Ocean, the Southern Ocean and the Bay of Bengal, where monsoon rain and river water hold surface σt near 19–21 against about 23–24 in the saltier Arabian Sea.
- Warm, salty water can float over cooler, fresher water. In the subtropics evaporation makes the surface saltier than the water below, yet its warmth keeps it lighter.
Pressure
- Water is nearly incompressible, so pressure is a minor control near the surface. It becomes significant only at great depth, adding about 4–5% to density at the bottom of the trenches.
- Cold water is more compressible than warm water (the thermobaric effect). A cold deep water mass therefore gains more density with depth than a warmer one of equal surface density.
- Measured at surface pressure, North Atlantic Deep Water and Antarctic Bottom Water have almost the same σt (about 27.85–27.9). Referenced to 4,000 m (σ4), Antarctic Bottom Water is clearly denser and so lies beneath.
Processes that change density
- Density is set almost entirely at the surface, by exchange with the atmosphere and the cryosphere. Once a parcel sinks out of contact with the air, only mixing changes it.
| Raise density | Lower density |
|---|---|
| Cooling (winter, cold winds, high latitudes) | Heating (insolation) |
| Evaporation: removes fresh water, raises salinity | Precipitation: adds fresh water |
| Sea-ice formation: salt is rejected as brine | Ice melt and glacial meltwater |
| Inflow of saline water (Gulf Stream, Mediterranean outflow) | River runoff (Ganga–Brahmaputra, Amazon, Siberian rivers) |
| Convergence: piles up and pushes surface water down | Divergence and upwelling bring up water, which is denser but cold and nutrient-rich |
| Cabbeling when two water masses mix | — |
The equation of state in plain words
- The equation of state of seawater gives density as a function of salinity, temperature and pressure. It is an empirical formula, fitted to laboratory measurements.
- Its key feature is that it is non-linear: density does not change by equal steps for equal changes of temperature or salinity. Three consequences follow:
- Isopycnals are curved on a T-S diagram.
- Cabbeling: when two water masses of the same density but different temperature and salinity mix, the mixture is denser than either parent and sinks.
- For example, water at 2 °C and salinity 34.2 and water at 12 °C and salinity 36.0 both have σθ of about 27.2. An equal mix (7 °C, 35.1) has σθ of about 27.35.
- Cabbeling helps water sink along polar fronts, where cold, fresh polar water meets warmer, saltier water, as in the Weddell and Greenland Seas.
- Thermobaricity: the extra compressibility of cold water, which affects how deep water masses stack and can trigger deep convection in polar seas.
Distribution of density
Horizontal distribution
- Surface σt increases from about 23–24 in the tropics to about 27 near 50–60° latitude, closely mirroring surface temperature.
- There is a slight dip near 5–10°N, under the rain belt of the Intertropical Convergence Zone, where fresh water lowers salinity.
- Poleward of about 60–70° surface density falls slightly again, because melt water and river water freshen the surface.
- Large horizontal density differences cannot remain in balance. They set up pressure gradients and currents that spread water along the level of matching density.
- Enclosed seas depart from the open-ocean pattern:
- High density where evaporation is intense: the Mediterranean (surface σt about 26 in summer and up to about 29 in winter) and the Red Sea. Their dense water sinks and escapes over the sill as a subsurface outflow.
- Low density where river inflow exceeds evaporation: the Baltic (σt about 4–6) and the Black Sea surface.
- The north Indian Ocean is the exception among the open oceans, with a strong east–west contrast between the light Bay of Bengal and the denser Arabian Sea, and large seasonal swings under the monsoon.
Vertical distribution
- Density generally increases with depth, because a column is stable only when lighter water lies over denser water.
- Low latitudes: a shallow, light surface layer sits on a sharp pycnocline, below which density rises only slowly.
- Middle latitudes: a seasonal pycnocline forms in summer above the permanent one and is destroyed by winter cooling and storms.
- High latitudes: the column is nearly uniform from top to bottom, with no permanent pycnocline. These weakly stratified columns are where the surface communicates with the deep ocean.
- Below about 100 m the meridional gradient reverses. In the subtropical gyres warm, light water is pushed down to great depth by convergence. At the equator divergence lifts the denser water close to the base of a shallow pycnocline. The contrast weakens downward and almost vanishes below about 2,000 m.
Stratification and the Layers of the Ocean
Pycnocline, thermocline and halocline
- The pycnocline (Greek pyknos, dense + klinein, to slope) is the layer of rapid increase in density with depth.
- It usually coincides with the thermocline (rapid fall in temperature) and, where salinity varies, with a halocline (rapid change in salinity).
- In the tropics and subtropics it is temperature-controlled. In high latitudes, the Arctic and the Bay of Bengal it is salinity-controlled.
- The permanent pycnocline lies at roughly 200–1,000 m in low and middle latitudes. It is shallowest along the equator and in eastern boundary upwelling zones, and deepest under the subtropical gyres.
- The pycnocline is a zone of high gravitational stability. Moving water up or down through it takes a great deal of energy, so it acts as a barrier to vertical mixing:
- It traps nutrients below the sunlit layer, which is why the stratified tropical open ocean is a biological desert, while the unstratified polar seas and upwelling coasts are highly productive.
- It also limits the downward transfer of oxygen, heat and carbon.
- Internal waves travel along it, sometimes with amplitudes of tens of metres.
- The Bay of Bengal barrier layer is a striking Indian example. Fresh surface water creates a salinity-controlled mixed layer that is shallower than the warm isothermal layer beneath it.
- This barrier layer stops cooler water from being mixed up, keeps sea-surface temperatures high and helps sustain post-monsoon cyclones. Indian Argo floats run by INCOIS track it.
- It is a feature of salinity as much as of temperature.
The three-layer density structure
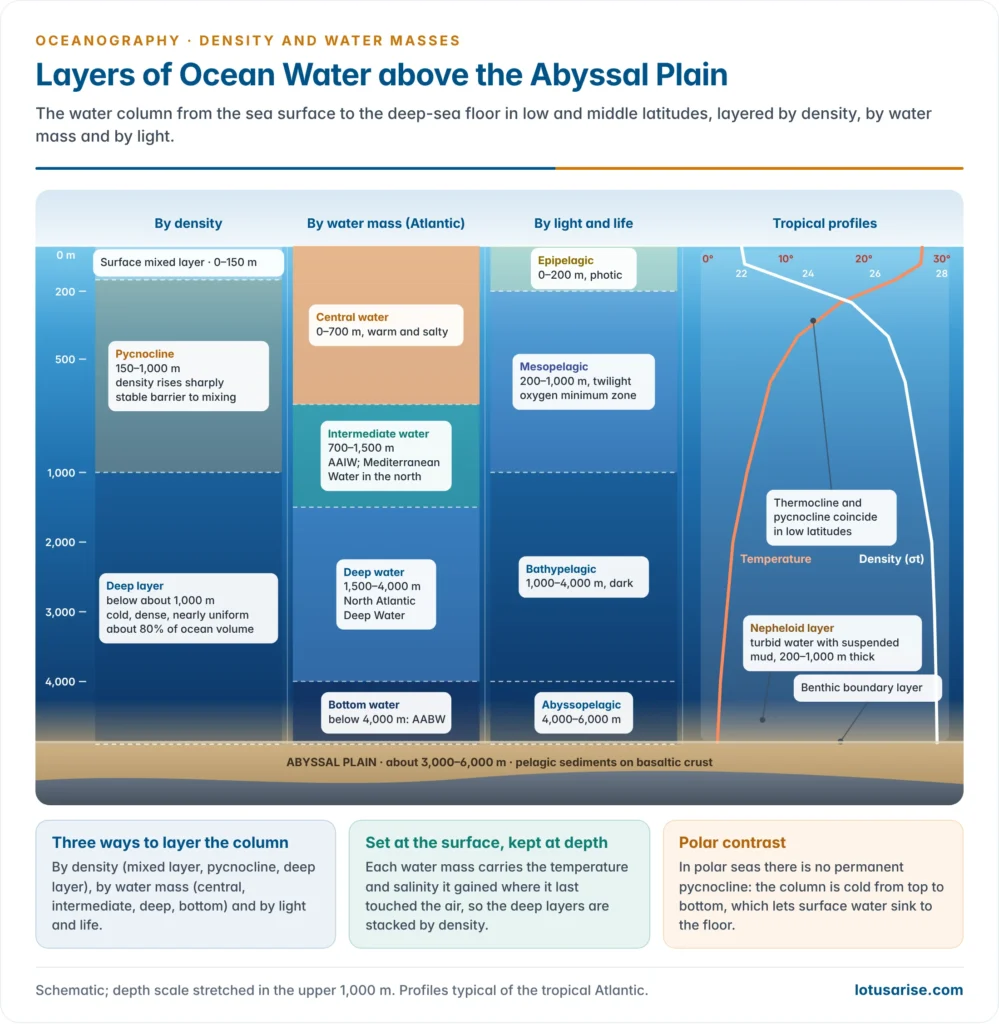
| Layer | Depth (low and mid latitudes) | Share of ocean volume | Character |
|---|---|---|---|
| Surface mixed layer | 0 to about 100–200 m | About 2% | Lowest density; stirred by wind and waves; uniform temperature; varies daily and seasonally |
| Pycnocline (with thermocline) | About 200–1,000 m | About 18% | Density rises sharply; very stable; blocks mixing |
| Deep layer | Below about 1,000 m to the floor | About 80% | Cold (mostly 0–4 °C), dense and nearly uniform; formed in polar regions |
- The thermal structure of the vertical temperature distribution mirrors this. The surface layer is absent in winter in middle latitudes, and the polar oceans have a single cold layer from top to bottom.
Layers of ocean water above the abyssal plain
- Between the sea surface and the 3,000–6,000 m deep abyssal plains, the water column can be layered in three complementary ways: by density, by water mass and by light and life.
- Water-mass layers (Atlantic example, from top to floor):
- Surface and central water (0 to about 500–800 m): warm, saline subtropical water formed at the subtropical convergences, such as North Atlantic Central Water.
- Intermediate water (about 600–1,500 m): Antarctic Intermediate Water, a salinity minimum spreading north; in the North Atlantic the Mediterranean Water salinity maximum at about 1,000–1,200 m.
- Deep water (about 1,500–4,000 m): North Atlantic Deep Water, flowing south.
- Bottom water (below about 4,000 m): Antarctic Bottom Water, the coldest and densest, creeping north along the floor.
- Light and life zones:
| Zone | Depth | Light | Character |
|---|---|---|---|
| Epipelagic (photic) | 0–200 m | Enough for photosynthesis | Phytoplankton, most marine life; mixed layer |
| Mesopelagic (twilight) | 200–1,000 m | Dim, no photosynthesis | Pycnocline; oxygen minimum zone (very strong in the Arabian Sea); deep scattering layer of migrating animals |
| Bathypelagic | 1,000–4,000 m | Dark (aphotic) | Cold deep water; bioluminescent life |
| Abyssopelagic | 4,000–6,000 m | Dark | Bottom water over the abyssal plains |
| Hadal | Below 6,000 m | Dark | Water of the trenches |
- The layer just above the floor:
- The benthic boundary layer, the lowest few metres to tens of metres, is slowed and mixed by friction with the floor, so temperature and salinity are uniform within it.
- The nepheloid layer (Greek nephele, cloud) is a turbid layer of suspended fine sediment, commonly 200–1,000 m thick. It is kept in suspension by strong bottom currents, deep convection and internal tides, and is best developed under the western boundary currents of the North Atlantic.
- Part of its load settles out as the fine muds and clays of the ocean deposits.
Water Masses
Meaning of a water mass
- A water mass is a large body of water with a characteristic, nearly uniform range of temperature and salinity, and so of density, that it acquired at the surface in its source region.
- It is the oceanic counterpart of an air mass: formed in contact with the atmosphere over a source region, then carried away while slowly modified.
- A water type is a single temperature–salinity point. A water mass is a range of such points, a segment of a T-S curve.
- Temperature and salinity are conservative properties. Below the surface they change only by mixing and diffusion, so a water mass keeps its signature for thousands of kilometres.
- Density alone cannot identify a water mass. Two waters can share the same density, one because it is cold and the other because it is salty.
- Non-conservative properties help too. Dissolved oxygen falls and nutrients rise with time since the water left the surface. Tracers such as CFCs, tritium and radiocarbon date it.
- The core method of Georg Wüst (1935) follows a water mass by the core, the level where a property reaches an extreme: the salinity minimum of Antarctic Intermediate Water, the salinity maximum of Mediterranean Water, an oxygen maximum or minimum.
How water masses form
- Subduction at the subtropical convergences (about 30–40°): Ekman convergence pushes surface water down along sloping density surfaces, forming the central waters of the thermocline.
- Sinking at the polar fronts (Antarctic Convergence, about 50–60°S): cool, fresh water slides under the warmer water to the north, forming intermediate waters.
- Open-ocean deep convection in winter, where salty water is cooled until it overturns to great depth: the Labrador, Irminger and Greenland Seas.
- Brine rejection on polar shelves: as sea ice forms in coastal polynyas (areas kept open by offshore winds), the rejected salt makes cold shelf water dense enough to cascade down the slope and form bottom water.
- Evaporation in marginal seas: the Mediterranean, Red Sea and Persian Gulf produce warm but very salty water that escapes over their sills as overflows.
- Mixing of existing water masses, such as Circumpolar Deep Water in the Southern Ocean.
- Two conditions allow deep and bottom water to form despite the fresh, rainy surface of most high latitudes:
- saline water carried poleward and then cooled, as the Gulf Stream and North Atlantic Drift bring salty water into the Nordic and Labrador Seas;
- freezing of saline shelf water, as around Antarctica.
- Why the North Pacific and the Arctic form no deep water: their surface water is too fresh (salinity about 32–33). The North Pacific makes only North Pacific Intermediate Water. In the Arctic, the large discharge of the Siberian rivers caps the surface with a strong halocline.
Naming and classification
- Water masses are named by source region and depth level, for example Antarctic Intermediate Water (AAIW) or North Atlantic Deep Water (NADW).
- Bjørn Helland-Hansen (1916) first defined water masses by their T-S curves. Harald Ulrik Sverdrup, with Martin W. Johnson and Richard H. Fleming in The Oceans (1942), set out the classic scheme:
| Level | Typical depth | Main water masses |
|---|---|---|
| Upper (surface and central) | 0 to about 1,000 m | North and South Atlantic Central Water; Western and Eastern North and South Pacific Central Water; Pacific and Indian Equatorial Water; Indian Central Water; Subantarctic and Subarctic Water; Arctic and Antarctic Surface Water |
| Intermediate | About 500–1,500 m | Antarctic Intermediate Water; North Pacific Intermediate Water; Mediterranean Water; Red Sea Water; Arctic (Subarctic) Intermediate Water |
| Deep and bottom | Below about 1,500 m | North Atlantic Deep Water; Circumpolar Deep Water; Pacific and Indian Deep Water; Arctic Deep Water; Antarctic Bottom Water |
- Modern work adds mode waters: thick, uniform layers formed by deep winter mixing just equatorward of fronts, such as Subantarctic Mode Water and the 18 °C Water of the Sargasso Sea.
Major water masses
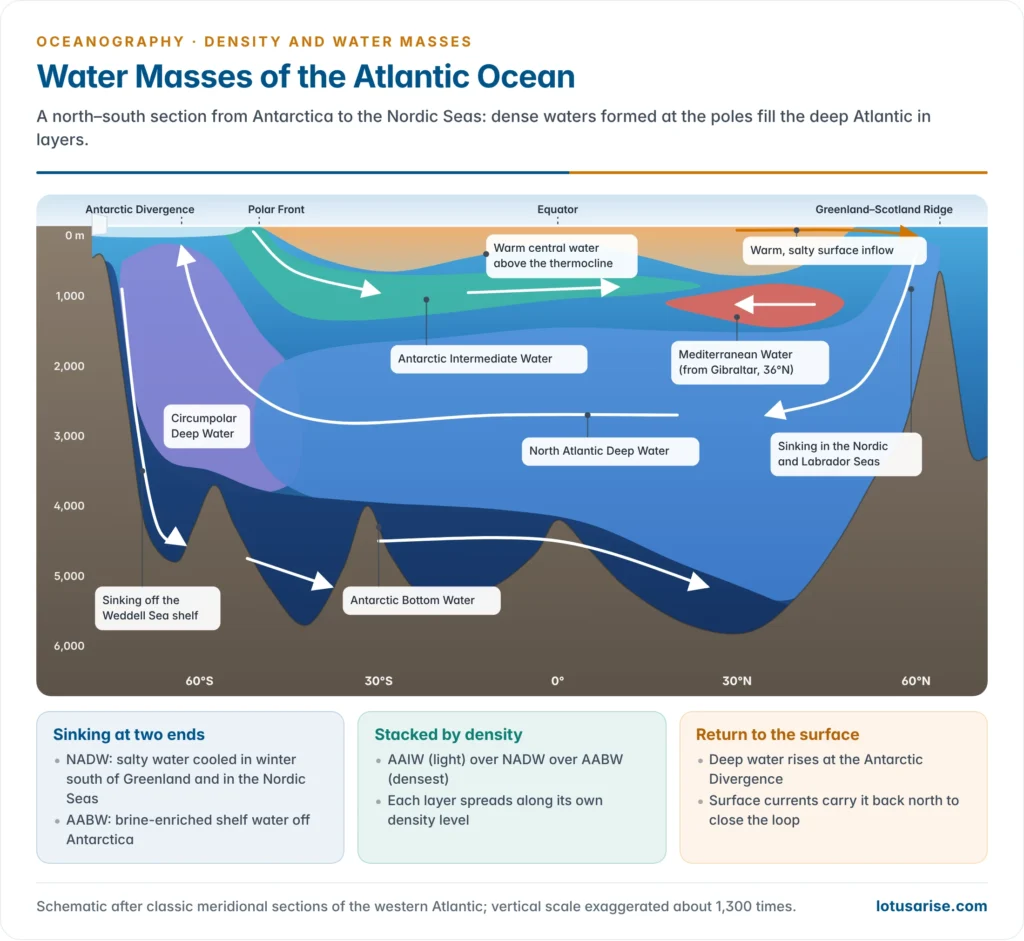
North Atlantic Deep Water (NADW)
- Source: the subpolar North Atlantic and the Nordic Seas, in winter. Warm, salty water brought north by the North Atlantic Drift is cooled until it sinks.
- Upper NADW includes Labrador Sea Water, formed by convection reaching about 2,000 m.
- Lower NADW comes from dense overflows across the Greenland–Iceland–Scotland Ridge: through the Denmark Strait and the Faroe Bank Channel.
- Properties: about 2–4 °C, salinity about 34.9–35.0, found at about 1,500–4,000 m. It is relatively rich in oxygen, having left the surface recently.
- Path: south along the western Atlantic as the Deep Western Boundary Current, across the equator and over the Antarctic Bottom Water. It rises in the Southern Ocean around Antarctica, where it joins the Circumpolar Deep Water.
- It forms the lower limb of the Atlantic Meridional Overturning Circulation.
Antarctic Bottom Water (AABW)
- The densest water mass in the open ocean, filling the floor of most basins below about 4,000 m.
- Source: the Antarctic continental shelves, above all the Weddell Sea, with the Ross Sea, the Adélie Land coast and Cape Darnley (off Prydz Bay, south of the Indian Ocean).
- Very cold shelf water (about −1.9 °C), made saltier by brine rejection in polynyas and by cooling under ice shelves, cascades down the slope and mixes with Circumpolar Deep Water.
- Properties: potential temperature about −0.8 to 0 °C (around −0.4 °C in classical accounts), salinity about 34.6–34.7, σt about 27.85–27.9.
- Path: north along the floor through deep gaps such as the Vema Channel in the South Atlantic and the Crozet–Kerguelen Gap in the Indian Ocean. It reaches the North Atlantic at about 40°N and the North Pacific.
Antarctic Intermediate Water (AAIW)
- Source: the Antarctic Polar Front (Antarctic Convergence), about 50–60°S. Cool, fresh Antarctic Surface Water sinks and spreads north; Subantarctic Mode Water, especially in the south-east Pacific, adds to it.
- Properties: about 3–7 °C and salinity 34.2–34.4 at formation. Its signature is a salinity minimum at about 700–1,200 m.
- Path: in all three oceans. In the Atlantic it can be traced north to about 20°N, lying between the central water above and NADW below.
Mediterranean Water (MW)
- Source: the Mediterranean, where evaporation far exceeds precipitation and runoff. Winter cooling of this salty water, especially in the Levantine basin and the Gulf of Lion, makes it dense enough to sink.
- Exchange at Gibraltar: a two-layer flow over a sill about 300 m deep. Atlantic water enters at the surface; dense Mediterranean water leaves along the bottom with salinity about 38 and temperature about 13 °C.
- In the Atlantic: it descends the slope, mixes heavily, and settles at about 1,000–1,200 m as a warm, salty tongue (salinity about 36.5 at its core) that spreads west and north.
- Part of it travels inside Meddies, slowly rotating lenses of Mediterranean water tens of kilometres across.
- Its salt helps keep the North Atlantic dense enough to form NADW.
Red Sea and Persian Gulf Waters
- The Red Sea, with surface salinity above 40, produces the saltiest outflow. At the Bab-el-Mandeb, over the Hanish Sill (about 150 m deep), water at about 22 °C and salinity 40.5 flows out beneath the inflowing surface water.
- The outflow is strongest in winter and almost stops in summer, when monsoon winds reverse the surface flow.
- It settles at about 400–800 m in the Gulf of Aden and spreads through the western Indian Ocean as a mid-depth salinity maximum, traced south to the Mozambique Channel.
- Persian Gulf Water leaves through the Strait of Hormuz and spreads in the Arabian Sea at a shallower level, about 200–350 m.
Upper and deep waters of the other oceans
- Central waters occupy the upper few hundred metres of each subtropical gyre. The Atlantic ones are saltier than their Pacific counterparts, and the North Atlantic Central Water is the saltiest.
- Equatorial waters separate the northern and southern central waters, most broadly in the Pacific and Indian Oceans.
- Circumpolar Deep Water is a mixture of NADW, Pacific and Indian deep water that flows round Antarctica with the Antarctic Circumpolar Current. It is almost uniform, at about 0.5–2.5 °C and salinity about 34.7.
- Pacific Deep Water forms nowhere in the Pacific itself. It is old, mixed water of Atlantic and Antarctic origin: the oldest and most oxygen-poor water in the deep ocean, last at the surface about a thousand years ago or more.
| Water mass | Source | Temperature (°C) | Salinity | Depth (m) |
|---|---|---|---|---|
| North Atlantic Central Water | Subtropical convergence, North Atlantic | About 8–19 | About 35.1–36.7 | 0–800 |
| Antarctic Intermediate Water | Antarctic Polar Front | 3–7 | 34.2–34.4 (minimum) | 700–1,200 |
| Mediterranean Water | Mediterranean, via Gibraltar | About 11–13 | About 36.5 at its core | 1,000–1,200 |
| Red Sea Water | Red Sea, via Bab-el-Mandeb | About 22 at the sill | About 40.5 at the sill | 400–800 (Gulf of Aden) |
| North Atlantic Deep Water | Labrador and Nordic Seas | 2–4 | 34.9–35.0 | 1,500–4,000 |
| Circumpolar Deep Water | Mixing in the Southern Ocean | 0.5–2.5 | About 34.7 | 500–3,500 |
| Antarctic Bottom Water | Weddell and Ross Seas, Adélie Land | −0.8 to 0 | 34.6–34.7 | Below 4,000 |
Water masses of the Indian Ocean
- The Indian Ocean is closed to the north at about 25°N, so it has no northern polar source and forms no deep water of its own. Its deep and bottom waters all come from the south.
- Upper layer:
- Arabian Sea High Salinity Water, formed by strong evaporation, against the low-salinity Bay of Bengal Water freshened by rain and the Ganga–Brahmaputra.
- Indian Equatorial Water and Indian Central Water in the south.
- Indonesian Throughflow water, relatively fresh Pacific water entering through the Indonesian seas.
- Intermediate layer: Red Sea Water and Persian Gulf Water in the north-west; AAIW from the south.
- The Arabian Sea oxygen minimum zone, one of the most intense in the world, lies at about 150–1,000 m. High productivity and slow renewal of this intermediate water use up the oxygen.
- Deep and bottom layers: Indian Deep Water, derived from Circumpolar Deep Water and carrying a trace of NADW; and AABW from the Weddell Sea and from the shelves between about 30°E and 140°E, entering through the Crozet–Kerguelen Gap and other deep passages.
- Indian research: the Indian Argo programme of INCOIS profiles temperature and salinity across the north Indian Ocean. NCPOR’s Southern Ocean expeditions sample the source waters of AAIW and AABW. The Deep Ocean Mission is building deep-sea observation capacity, including the 6,000 m submersible Matsya-6000.
Water masses and ocean circulation
- Temperature, salinity and density differences are the prime movers of the deep ocean.
- Wind drives the surface currents of roughly the upper 10% of the ocean.
- Density differences, created at the surface by heating, cooling, evaporation, precipitation and ice formation, drive the thermohaline circulation of the remaining 90%.
- Sinking happens in only a few small regions: the subpolar North Atlantic and Nordic Seas, and the Antarctic shelves. Upwelling is spread across the oceans and concentrated around Antarctica, where divergence brings deep water to the surface.
- Deep flows are slow, typically a few kilometres to a few tens of kilometres a year. A full circuit of the thermohaline conveyor takes around a thousand years.
- Horizontal density gradients also drive currents directly. The Mediterranean exchange at Gibraltar and the Red Sea exchange at Bab-el-Mandeb are density-driven circulations.
- The circulation redistributes heat and salt, keeping the heat and salt budgets of each latitude in balance. It also ventilates the deep ocean with oxygen and stores carbon there for centuries.
Changing water masses in a warming ocean
- The ocean is becoming more stratified. A 2020 analysis found that stratification of the upper 2,000 m increased by about 5.3% between 1960 and 2018, with most of the rise in the top 200 m. This weakens the supply of nutrients to the surface and of oxygen to depth.
- Antarctic Bottom Water is warming, freshening and thinning. Repeat surveys showed that the abyssal overturning in the deep basin south of Australia slowed by about 30% between 1992 and 2017 (reported in 2023), as glacial meltwater made shelf water lighter.
- Deep-water formation in the North Atlantic is not where models expected. The OSNAP mooring array (2014–16 data, published in 2019) found about seven times more overturning east of Greenland, in the Irminger and Iceland basins, than in the Labrador Sea.
- The Southern Ocean surface has turned saltier. Satellite salinity data (the SMOS mission) and floats show that decades of freshening have reversed since about 2015, alongside record sea-ice losses (reported in 2025). Weaker stratification is letting warmer deep water reach the surface and melt ice from below.
The T-S Diagram
What the diagram is
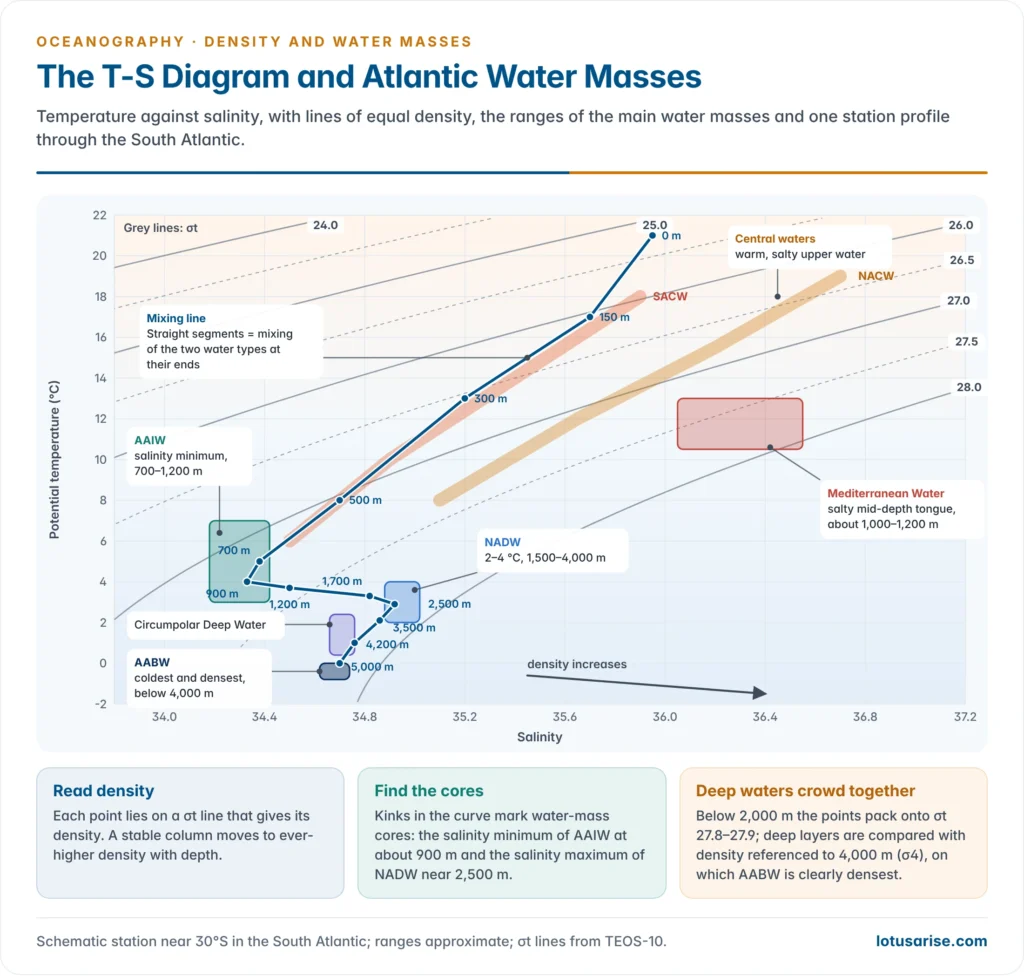
- A temperature–salinity (T-S) diagram plots temperature (usually potential temperature) on the vertical axis against salinity on the horizontal axis for samples from one or many depths.
- It was introduced by Bjørn Helland-Hansen (1916) and is still the basic tool of water-mass analysis.
- Lines of equal density (isopycnals, usually σt or σθ) are drawn across it. They are curved, because the equation of state is non-linear, and run from upper left to lower right.
- Density increases towards the lower right: cold, salty water is densest.
- Each sample is a point. The points from one station, joined in order of depth, form the T-S curve of that water column, with depths marked along it.
How to read it
- Read density for any sample from the isopycnal on which its point lies. For example, 11 °C and a salinity of 34.6 give σt of about 26.5.
- Check stability. In a stable column the curve moves to ever-higher density with depth. A segment that crosses back to lower density marks an unstable layer that will overturn.
- Identify water masses. A point is a water type and a compact cluster or segment is a water mass. Each region has a characteristic curve, a fingerprint that stays almost the same from year to year below the seasonal surface layer.
- Find the cores. Kinks in the curve, where salinity or temperature reaches an extreme, mark the cores of intermediate and deep water masses: the salinity minimum of AAIW and the salinity maximum of Mediterranean Water or NADW.
- Read mixing. When two water types mix, every mixture lies on the straight line joining them, and the position along the line gives the proportions. When three mix, the points fall inside a mixing triangle, and the middle water’s core is eroded as the curve rounds off.
- See cabbeling. A straight mixing line joining two points on the same curved isopycnal passes through denser water, so the mixture must sink.
Uses and limitations
- Uses:
- identifying water masses and tracing their spread far from their sources;
- calculating mixing proportions between water masses;
- checking the stability of a column and the quality of float and ship data (Argo profiles are screened this way);
- comparing stations, seasons and years to detect changes in water masses.
- Limitations:
- It shows no geographical position and no depth scale, unless depths are written along the curve, and no velocity.
- Different combinations can give the same curve, so oxygen, nutrients and tracers are needed to confirm a water mass.
- The surface layer changes with season and weather and does not fit the conservative picture.
- In-situ temperature at great depth is raised slightly by compression, so potential temperature must be used for deep water.
| Point or shape on the diagram | Meaning |
|---|---|
| Single point | Water type (one temperature–salinity value) |
| Compact segment or cluster | Water mass |
| Straight line between two points | Mixing of two water types |
| Kink (salinity minimum or maximum) | Core of an intermediate or deep water mass |
| Triangle of points | Mixing of three water types |
| Position across isopycnals | Density and so the depth order of the layers |
Previous Year Questions
2012Write short notes on different layers of ocean water above abyssal plain.2011“Temperature, salinity and density differences in ocean water are the prime causes of ocean water circulation.” Elaborate.2000Write short note: T-S diagram.




