

- Salinity is the amount of dissolved salts in seawater, traditionally expressed as grams of salt per kilogram of seawater, that is, in parts per thousand (‰).
- The world ocean averages about 35‰; the whole-ocean mean, deep water included, is about 34.7. Open-ocean surface water mostly stays between 33 and 37.
- Salinity, with temperature, fixes the density of seawater. It therefore drives the deep, density-led circulation, governs how readily water freezes and evaporates, and decides which plants and animals can live where.
- Lines joining points of equal surface salinity on a map are isohalines. A layer in which salinity changes sharply with depth is a halocline.
Nature of Salinity
Definition and units
- Classical definition (1902): an international commission led by Martin Knudsen, with Carl Forch and Søren Sørensen, defined salinity as the total mass of solid material in grams in one kilogram of seawater, after carbonate is converted to oxide, bromide and iodide are replaced by chloride, and organic matter is oxidised.
- Because this was almost impossible to measure directly, salinity was worked out from chlorinity (the chloride content), found by titration with silver nitrate.
- Salinity ≈ 1.80655 × chlorinity. A chlorinity of about 19.2‰ gives the ocean’s mean salinity of about 34.7‰.
- Practical Salinity Scale (PSS-78): since 1978 salinity has been measured from the electrical conductivity of seawater relative to a standard.
- Practical salinity is a ratio with no units: one writes “S = 35”. The label psu (practical salinity unit) is widely used, but it is formally discouraged.
- Numerically, 35 on the practical scale is almost the same as 35‰.
- Absolute Salinity (TEOS-10): the International Thermodynamic Equation of Seawater (2010), adopted through UNESCO’s Intergovernmental Oceanographic Commission, replaced the 1980 equation of state.
- It uses Absolute Salinity (S_A), the true mass fraction of dissolved material in g/kg. Seawater of practical salinity 35 has an Absolute Salinity of about 35.165 g/kg.
- Absolute Salinity also allows for small regional differences in composition, such as extra dissolved silica in the deep North Pacific.
- Classes of saline water (the Venice system, 1958) separate fresh, brackish and sea water:
| Class | Salinity (‰) | Typical setting |
|---|---|---|
| Fresh (limnetic) | below 0.5 | Rivers, most lakes |
| Oligohaline | 0.5–5 | Upper estuaries, Gulf of Bothnia |
| Mesohaline | 5–18 | Central Baltic, Black Sea surface |
| Polyhaline | 18–30 | Lower estuaries, northern Bay of Bengal in the monsoon |
| Euhaline | 30–40 | Open ocean |
| Hyperhaline | above 40 | Northern Red Sea, inner Persian Gulf, coastal lagoons |
- 24.7‰ is a physical threshold, not a legal one. Below it, water reaches its greatest density above its freezing point, as fresh water does at 4 °C. Above it, density keeps rising as the water cools, right down to freezing.
- Ordinary seawater therefore keeps overturning as it cools until ice forms. This is why polar seas can form dense bottom water.
Composition of seawater
- About 96.5% of seawater by mass is water and about 3.5% is dissolved matter. Almost every natural element is present, but six major ions make up over 99% of the dissolved load:
| Ion | Share of dissolved salts (%) |
|---|---|
| Chloride (Cl⁻) | 55.0 |
| Sodium (Na⁺) | 30.6 |
| Sulphate (SO₄²⁻) | 7.7 |
| Magnesium (Mg²⁺) | 3.7 |
| Calcium (Ca²⁺) | 1.2 |
| Potassium (K⁺) | 1.1 |
- Minor constituents (1–100 parts per million) include bromide, carbon as bicarbonate, strontium, boron, silica and fluoride. Trace elements (below 1 ppm) include nitrogen, phosphorus, iodine, iron, zinc and even gold.
- The nutrients nitrogen, phosphorus and silicon are scarce but vital, because plankton use them up in the sunlit layer.
- Expressed as salts, the classical analysis gives sodium chloride about 77.8%, magnesium chloride 10.9%, magnesium sulphate 4.7%, calcium sulphate 3.6%, potassium sulphate 2.5%, calcium carbonate 0.3% and magnesium bromide 0.2%.
- William Dittmar (1884) analysed 77 water samples from the Challenger Expedition and confirmed that these proportions hardly change from ocean to ocean.
- Principle of constant proportions: the ratios of the major ions stay nearly constant everywhere, even though total salinity varies.
- Salinity differences therefore come from adding or removing water, not salt. This is why measuring one ion (chloride) or one property (conductivity) is enough to give total salinity.
- The rule fails only near large river mouths and in enclosed basins, and it does not apply to the minor and biologically active elements.
- Why the ratios hold: the major ions stay in the ocean for tens of millions of years (chloride about 100 million, sodium about 68 million), while the ocean mixes completely in about 1,000 years. The water is stirred thousands of times over before an average ion is removed.
Sources of salts
- Weathering of rocks on land supplies most of the cations (sodium, calcium, magnesium, potassium). Rivers carry them to the sea in solution.
- Volcanic outgassing over Earth’s history supplied most of the anions, chloride and sulphate, as hydrogen chloride and sulphur gases. This explains why chloride dominates seawater although it is scarce in crustal rocks.
- Hydrothermal vents at mid-ocean ridges exchange elements with the crust, adding some and removing others, such as magnesium.
- Minor inputs come from wind-blown dust, glacial meltwater and submarine volcanic ash.
- River water is chemically unlike seawater. It is dominated by calcium and bicarbonate, and sodium chloride is a small part of it.
- The difference arises because organisms remove calcium carbonate and silica to build shells and skeletons (corals, molluscs, foraminifera, diatoms), while sodium and chloride, which life barely uses, accumulate.
- Evaporation then returns pure water to the air and leaves the salts behind.
- The ocean is in steady state, not growing saltier. In the salt budget of the oceans, inputs are balanced by outputs: sediments and evaporites, uptake by new basaltic crust at ridges, adsorption on clays and sea spray. Salinity has probably stayed close to today’s level for hundreds of millions of years.
- Scale of the store: the ocean holds roughly 5 × 10¹⁶ tonnes of dissolved salt. Spread over the land, it would form a layer more than 160 m thick.
Significance of salinity
- Density: dissolved salts make seawater denser than fresh water. At equal temperature, saltier water is denser, so salinity differences help drive the thermohaline circulation. Very salty water is also more buoyant to swimmers, as in the Dead Sea.
- Freezing point: salt lowers the freezing point. Seawater of salinity 35 freezes at about −1.9 °C.
- When sea ice forms, most of the salt is rejected as brine, which makes the water below saltier and denser.
- Boiling point and evaporation: salt raises the boiling point slightly and reduces evaporation, because saltier water holds its molecules more firmly. Evaporation and salinity thus control each other.
- Other physical properties: salinity raises electrical conductivity, which is the basis of modern measurement, and changes the speed of sound, refractive index, viscosity and osmotic pressure.
- Marine life: most open-ocean organisms are stenohaline, tolerating only a narrow salinity range. Estuarine species such as oysters, mangroves and mullet are euryhaline, tolerating wide swings.
- Marine fish lose water to the salty sea by osmosis. They drink seawater and excrete the excess salt through special gill cells.
- Climate and monsoon: a fresh, buoyant surface layer traps heat near the surface. Over the Bay of Bengal this keeps the sea surface warm and feeds monsoon depressions and cyclones.
Measurement of salinity
- Titration of chlorinity was the standard from 1902. Laboratories calibrated against standard seawater, first issued from Copenhagen and later from Wormley in England.
- Conductivity salinometers from the 1950s–60s measured salinity to about 0.003. They led to PSS-78 and to the CTD (conductivity–temperature–depth) probe now lowered from every research ship.
- Argo floats have built a global network since 1999. About 4,000 floats drift at 1,000 m, dive to 2,000 m every ten days and profile temperature and salinity on the way up. They have sent more than 3 million profiles; Deep Argo floats now reach the abyss.
- Argo is the newest stage in the long history of ocean exploration. India’s INCOIS (Hyderabad) runs the national Argo programme and an Indian Ocean regional data centre.
- Satellites measure sea surface salinity from space with L-band microwave radiometers, whose signal changes slightly with salinity:
- SMOS (European Space Agency), launched in November 2009;
- Aquarius (NASA with Argentina), from June 2011 to June 2015;
- SMAP (NASA), launched in January 2015, with a footprint of about 40 km.
- Satellites map plumes, eddies and seasonal swings that ships and floats miss, such as the Ganga–Brahmaputra plume spreading across the Bay of Bengal.
- Moored buoys add continuous records. The RAMA array in the tropical Indian Ocean and the NIOT buoys in the Bay of Bengal and Arabian Sea record salinity for monsoon and cyclone forecasting.
Factors Controlling Salinity
- Salinity is changed by adding or removing fresh water. The balance between them sets the surface pattern:
| Raise salinity | Lower salinity |
|---|---|
| Evaporation | Precipitation |
| Formation of sea ice (brine rejection) | Melting of sea ice, icebergs and glaciers |
| Inflow of saltier water by currents | Inflow of fresher water by currents |
| Mixing with saltier water from below | Upwelling or mixing with fresher deep water |
| Dissolution of salt beds (locally, as in the Gulf of Suez) | River discharge and runoff from land |
Evaporation and precipitation
- Evaporation is the strongest single control. It is greatest where temperature is high, air is dry, skies are clear and winds are steady.
- The subtropical high-pressure belts (about 20–30° N and S) have sinking dry air, clear skies and trade winds. They have the highest open-ocean salinity.
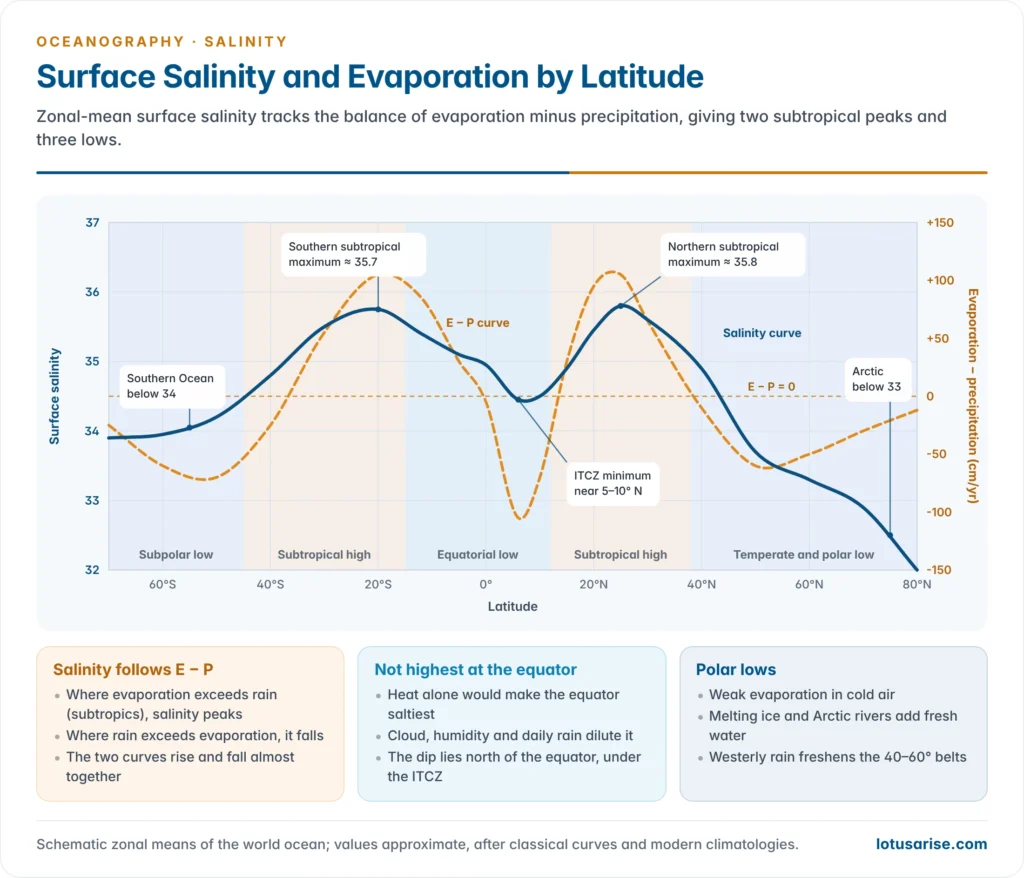
- Precipitation dilutes the surface. The equatorial belt is hot, but cloud, high humidity, calm air and daily convectional rain hold salinity down, so the maximum is not at the equator.
- Evaporation minus precipitation (E − P) is the real control. Georg Wüst showed (1930s) that zonal-mean surface salinity rises and falls almost in step with E − P.
- Where E exceeds P (the subtropics, the Arabian Sea, the Mediterranean), salinity is high. Where P exceeds E (the ITCZ belt, the subpolar oceans, the Bay of Bengal), it is low.
Rivers, ice and land
- Large rivers lower salinity near their mouths and along the coast: the Amazon (whose plume freshens the sea hundreds of kilometres offshore), Congo, Niger, St Lawrence, Ob, Yenisei, Yangtze and the Ganga–Brahmaputra.
- The effect is strongest in enclosed seas with many rivers and little evaporation, such as the Baltic and the Black Sea.
- Sea ice: freezing raises the salinity of the water below. Melting in summer, and icebergs drifting from Greenland and Antarctica, lower it.
- Polar surface waters are fresh because evaporation is weak, melt-water is added and Arctic rivers pour in.
Winds, currents and mixing
- Prevailing winds move salty water and cause upwelling.
- The trade winds push warm, salty surface water from the eastern to the western sides of the oceans. Along the eastern margins, upwelling brings up cooler, less saline water, as off Peru, California, Benguela and the Canaries.
- The westerlies bring rain to the western coasts of the continents in middle latitudes.
- Warm currents carry salty water poleward and cold currents carry fresher water equatorward:
- the Gulf Stream and North Atlantic Drift raise salinity off north-west Europe, in the North Sea and as far as Spitsbergen;
- the Labrador Current, with its icebergs, lowers salinity off Newfoundland;
- the Oyashio freshens the north-western Pacific.
- Mixing by waves, tides, currents and turbulence evens out differences. The surface layer and the deep ocean are far more uniform than a map of rain and evaporation alone would suggest.
- The pattern of ocean currents is therefore stamped on the isohalines. Poleward of about 40° N in the Atlantic they bend north–south, following the currents rather than the latitudes.
Distribution of Salinity
Horizontal distribution
Latitudinal pattern
- Surface salinity is arranged in latitudinal belts because E − P is. There are two subtropical maxima and three minima: equatorial, and polar in each hemisphere.
| Belt | Typical surface salinity | Why |
|---|---|---|
| Equatorial (0–10°) | About 34.5–35, with a dip under the ITCZ near 5–10° N | Heavy rain, cloud, humidity, river outflow |
| Subtropical (20–30°) | 36–37, the highest | Sinking dry air, clear skies, trade winds, little rain, few rivers |
| Temperate (40–50°) | About 33–35 | Rain of the westerlies exceeds evaporation |
| Subpolar and polar (above 50–60°) | Below 34, under 32 in parts of the Arctic | Weak evaporation, ice melt, Arctic rivers |
- The equatorial dip lies north of the equator, under the ITCZ at about 5–10° N, because the thermal equator lies in the northern hemisphere.
- Margins differ from centres. Coastal water is fresher than the open ocean in the same latitude wherever rivers enter, and saltier wherever deserts border the sea.
- Latitude barely controls enclosed seas. The Baltic and the North Sea lie in the same latitudes, yet the Baltic is several times fresher.
Ocean-wise pattern
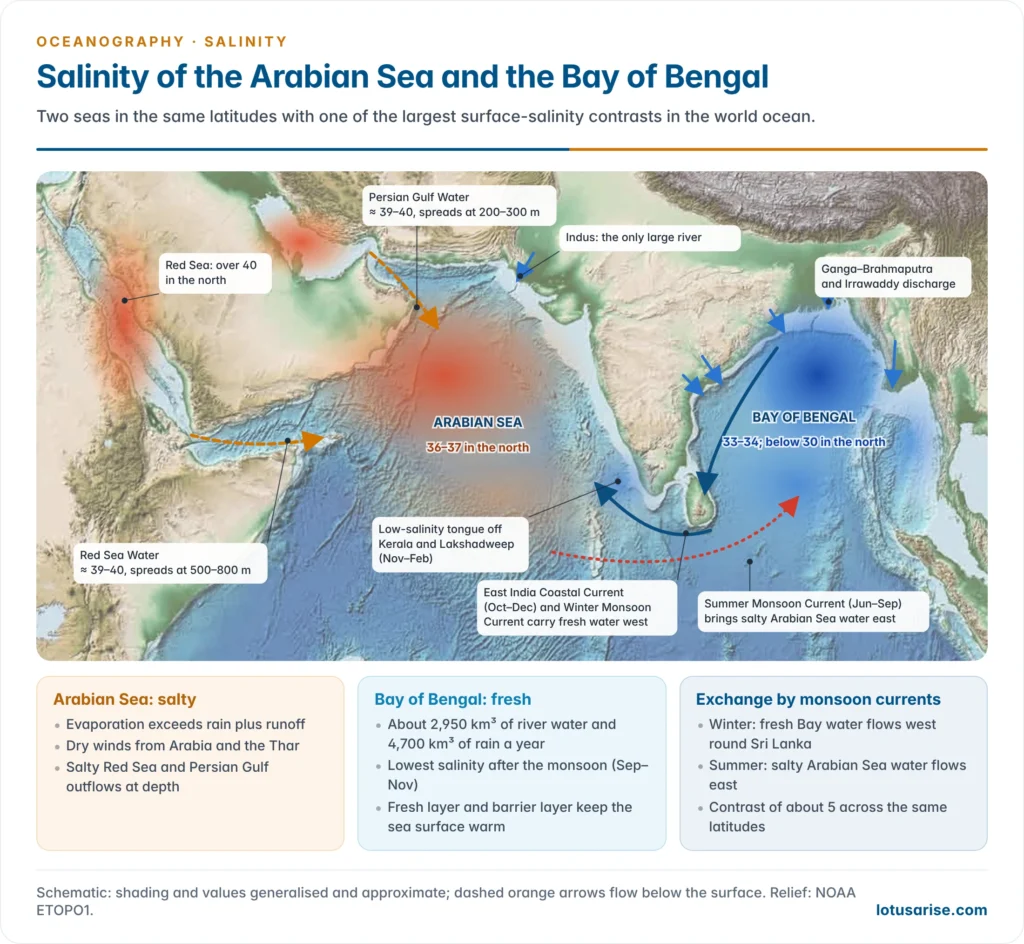
- The Atlantic is the saltiest ocean and the Pacific the freshest.
- The Atlantic is narrow and loses water vapour, carried by the trade winds across Central America to the Pacific. It also receives warm, salty water from the Mediterranean.
- The Pacific is vast and receives heavy rain under the ITCZ and over the western Pacific warm pool.
- Atlantic:
- The North Atlantic subtropical maximum, above 37, lies between about 20° and 30° N and 20° and 60° W. It is the saltiest open-ocean surface water in the world.
- The South Atlantic maximum (about 37) lies at about 10–25° S, 15–40° W, west of the cooler, upwelled water off Africa.
- The equatorial belt has about 35. Low values occur off the Amazon, Congo, Niger and St Lawrence and around Newfoundland, where the Labrador Current and its icebergs dilute the sea.
- The North Atlantic Drift keeps salinity near 35 far north, off Norway and into the Barents Sea.
- Pacific:
- The equatorial belt has about 34–35. The western Pacific warm pool and the Gulf of Panama are among the freshest open-ocean areas in the tropics.
- The South Pacific maximum (about 36.5) lies in the east-central basin, around 15–20° S, south-east of Tahiti. The North Pacific maximum is weaker, about 35.5 at 20–30° N.
- Salinity is low off Peru and Chile (upwelling and the cold Humboldt Current), in the Gulf of Alaska (rain and glacier melt), and in the Okhotsk and Bering Seas (melt-water and the Oyashio). It is also low off the Yangtze and Huang He.
- Indian:
- The north-west is salty: the Arabian Sea exceeds 36, fed by the highly saline outflows of the Red Sea and the Persian Gulf.
- The north-east is fresh: the Bay of Bengal falls below 33, and below 30 in the north.
- The southern subtropical maximum (about 36) lies at 25–35° S, extending towards arid western Australia.
- Fresher Pacific water enters the east through the Indonesian Throughflow. Salinity falls towards Antarctica, to about 34 near the ice edge.
Salinity patterns in the Indian Ocean: Arabian Sea and Bay of Bengal
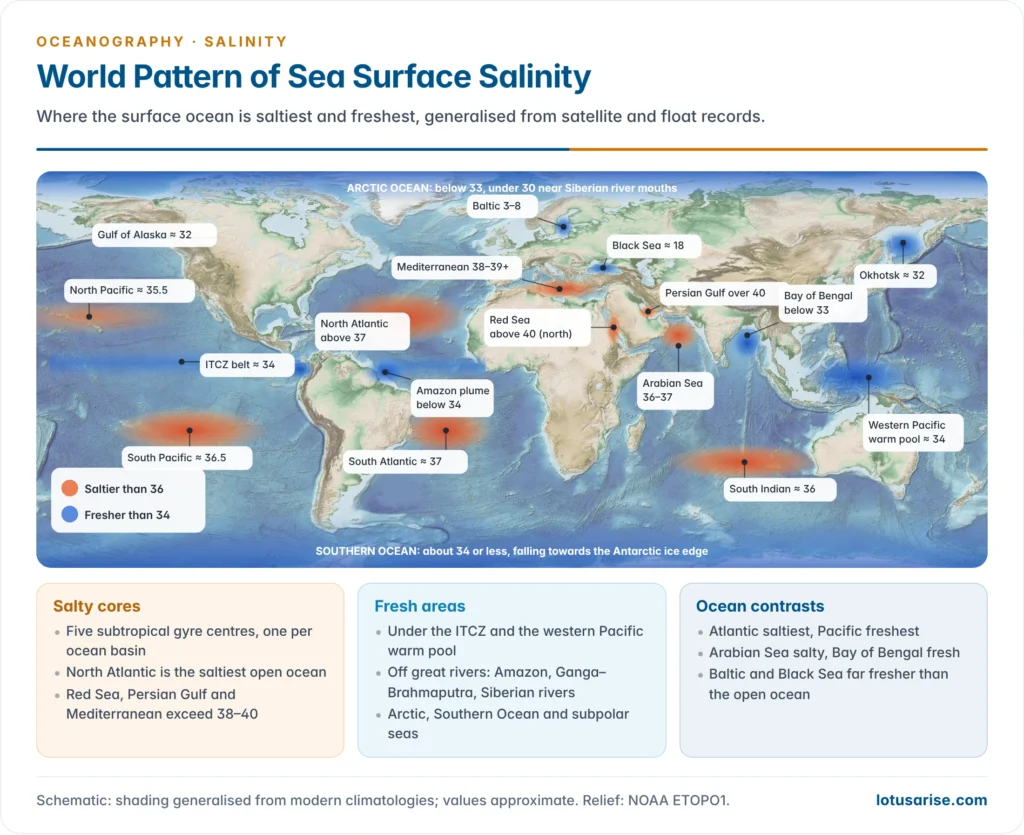
- The two arms of the northern Indian Ocean lie in the same latitudes, yet their surface salinity differs by about 5. This is one of the largest salinity contrasts anywhere in the world ocean.
| Feature | Arabian Sea | Bay of Bengal |
|---|---|---|
| Surface salinity | About 36–37 in the north, 35–36 further south | About 33–34 in the south, below 30 in the north, under 25 near the deltas after the monsoon |
| Fresh-water balance | Evaporation exceeds precipitation plus runoff | Rain and runoff far exceed evaporation |
| Rivers | Few large ones; the Indus, Narmada and Tapi | Ganga–Brahmaputra–Meghna, Irrawaddy, Mahanadi, Godavari, Krishna, Kaveri |
| Surrounding land | Arid Arabia, Horn of Africa and Thar; dry continental winds in winter | Humid monsoon lands; heavy rain over the bay itself |
| Saline inflows | Red Sea Water and Persian Gulf Water spread at depth | Salty Arabian Sea water enters at about 100 m with the Summer Monsoon Current |
| Upper-ocean structure | Deep winter mixing; dense, salty water forms in the north | Thin, fresh surface layer over a strong halocline and a barrier layer |
- The Bay of Bengal is the freshest large tropical sea.
- It receives about 2,950 km³ of river water a year, more than half of all river inflow to the tropical Indian Ocean, and about 4,700 km³ of rain against 3,600 km³ of evaporation.
- Peak discharge follows the monsoon, so surface salinity is lowest in September–November. The fresh plume first hugs the head of the bay, then flows south along the Indian coast.
- The salt exchange between the two seas is seasonal and runs on the monsoon currents:
- The East India Coastal Current flows south in October–December and carries Bay of Bengal water round Sri Lanka. The Winter Monsoon Current then carries it west. This forms a low-salinity tongue in the south-eastern Arabian Sea, off Kerala and the Lakshadweep.
- In summer the Summer Monsoon Current brings salty Arabian Sea water east into the southern Bay of Bengal, mostly below the fresh surface layer.
- The barrier layer matters for India’s weather. In the Bay of Bengal, the halocline lies above the thermocline. The layer in between is warm, but salinity stratification isolates it from the cool water below.
- Winds cannot easily mix cold water up, so sea surface temperature stays high. This helps sustain monsoon depressions and severe cyclones, such as those that strike Odisha and Andhra Pradesh.
- The barrier layer, the salt exchange and the Indian monsoon are studied through India’s Ocean Mixing and Monsoon programme, the joint Indian–US ASIRI cruises (from 2013) and the Indian–UK BoBBLE experiment (2016).
- The Arabian Sea is salty from both ends.
- Strong evaporation under dry north-easterly winds in winter makes the northern Arabian Sea’s surface water dense enough to sink. It spreads south at about 100 m as the Arabian Sea High Salinity Water.
- Persian Gulf Water (salinity about 39–40 at the Strait of Hormuz) spreads at about 200–300 m. Red Sea Water (about 39–40 at Bab-el-Mandeb) spreads through the Gulf of Aden at about 500–800 m and can be traced far south.
Enclosed and partially enclosed seas
- Where a sea’s exchange with the open ocean is restricted by a narrow strait or a shallow sill, local climate decides its salinity.
- In arid latitudes, evaporation exceeds inflow, so the sea becomes saltier than the ocean. It is then a concentration basin, with fresher ocean water flowing in at the surface and dense, salty water flowing out at depth.
- In humid or cold latitudes, rain and rivers exceed evaporation, so the sea becomes fresher. It is then a dilution basin, with fresher water flowing out at the surface and ocean water flowing in at depth.
| Sea | Surface salinity | Main reason |
|---|---|---|
| Red Sea | About 36.5 in the south to over 40 in the north | Desert climate, almost no rain or rivers, a narrow strait at Bab-el-Mandeb; the saltiest sea linked to the ocean |
| Persian Gulf | About 37 at the mouth, over 40 in the shallow inner gulf | Intense evaporation, shallow water, little river inflow beyond the Shatt al-Arab |
| Mediterranean Sea | About 36–37 in the west to 39 and above in the east | Dry summers, few large rivers since the Aswan Dam cut the Nile’s flow; Gibraltar limits exchange |
| Gulf of Mexico, Caribbean | About 36 | Salty water brought by the North Equatorial Current; trade-wind evaporation |
| North Sea | 34–35, lower near the coasts | Atlantic water entering by the north and the English Channel; diluted by the Rhine and Elbe near land |
| Black Sea | About 17–18 | Danube, Dnieper and Don exceed evaporation; outflow through the Bosporus |
| Baltic Sea | About 6–8 in the centre, below 3 in the Gulf of Bothnia | Cool climate, low evaporation, many rivers, narrow Danish straits |
- The Mediterranean is the classic concentration basin. Atlantic water flows in at the surface through the Strait of Gibraltar to replace water lost to evaporation in the dry eastern basin.
- Dense water formed in winter in the east, in the Levantine Sea near Cyprus, flows out beneath it over the Gibraltar sill at a salinity of about 38.
- This Mediterranean Outflow Water sinks to about 1,000 m in the Atlantic and spreads as a salt tongue across the basin.
- The Black Sea is the classic dilution basin. Its fresh surface layer sits over saltier water from the Mediterranean.
- A permanent halocline at about 100–150 m blocks mixing, so the deep water is without oxygen and rich in hydrogen sulphide. It is the world’s largest body of anoxic water.
- The Baltic depends on occasional major inflows of North Sea water through the Danish straits, during winter storms, to renew its salty, oxygen-starved deep basins.
Inland seas and salt lakes
- Lakes with no outlet gain salt from inflowing rivers and lose water only by evaporation, so they grow saltier with time. A lake with an outlet stays fresh because the river carries the salt away.
- Caspian Sea: a brackish average of about 12–13. It is nearly fresh in the north, near the Volga and Ural mouths, and hypersaline in the Kara-Bogaz-Gol lagoon on its eastern shore.
- Dead Sea: about 340 g/kg (34%), roughly ten times the ocean. Its level is falling by about a metre a year since the Jordan’s water was diverted.
- Great Salt Lake (Utah): salinity swings widely between its arms and with its water level, from about 5% to over 25%.
- Lake Van (Turkey): about 22 g/kg, alkaline. It is the world’s largest soda lake, not the saltiest lake as older texts claim.
- The saltiest water bodies are small ponds such as Gaet’ale Pond in Ethiopia’s Danakil Depression (about 43%) and Don Juan Pond in Antarctica.
Seasonal variation
- Open oceans change little: the annual range is mostly below 0.5 in temperate seas.
- Large ranges occur where fresh-water supply is seasonal:
- river mouths and monsoon seas. The Bay of Bengal swings from its post-monsoon minimum to a dry-season maximum in March–May;
- polar seas, where ice forms in winter and melts in summer;
- the band under the migrating ITCZ.
- Enclosed seas in humid climates have larger annual ranges than those in arid climates, because their river supply varies more.
Vertical distribution
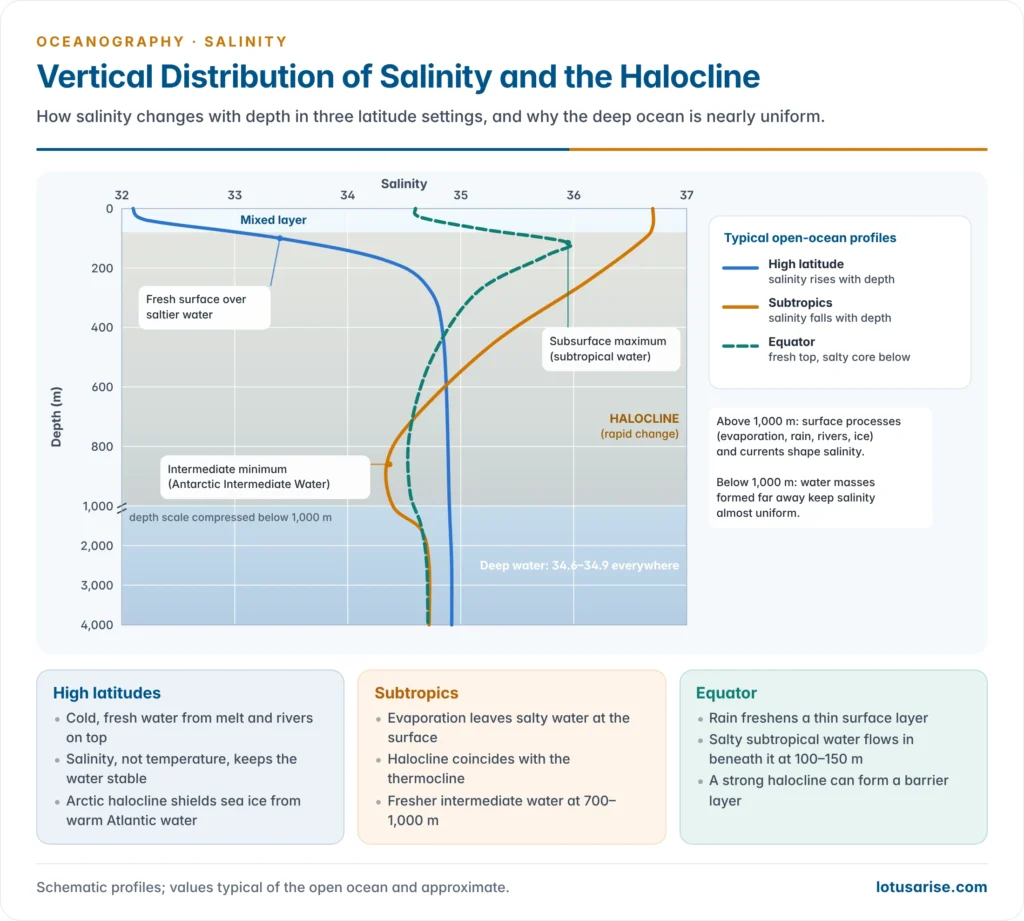
- Most salinity change happens near the surface, where evaporation, rain, rivers and ice act. Below about 1,000 m, salinity is nearly uniform at about 34.6–34.9 in all oceans.
- The upper ocean has three layers:
- a mixed layer, stirred by wind and waves, with nearly uniform salinity, tens to about 200 m thick;
- the halocline, where salinity changes rapidly with depth;
- the deep layer, almost uniform.
- The halocline behaves differently with latitude:
- High latitudes: cold, fresh water lies on top and salinity increases with depth. Stability comes mostly from salinity, so the halocline, not the thermocline, sets the stratification.
- In the Arctic Ocean, a cold halocline at about 50–200 m separates the fresh surface from warmer Atlantic water below. It shields the sea ice from that heat.
- Subtropics: salty water lies on top and salinity decreases with depth, down to an intermediate minimum at about 700–1,000 m. Below that it rises slightly to the deep value. Here the halocline coincides with the thermocline, and temperature keeps the column stable.
- Equator: a fresher surface layer from rain overlies a subsurface salinity maximum at about 100–150 m. This is salty subtropical water that has sunk and flowed equatorward beneath the surface. Salinity then falls to the intermediate minimum.
- High latitudes: cold, fresh water lies on top and salinity increases with depth. Stability comes mostly from salinity, so the halocline, not the thermocline, sets the stratification.
- Water masses explain the layers below the surface:
- The intermediate salinity minimum at about 700–1,000 m is Antarctic Intermediate Water, which sinks near 50–60° S and spreads north into all three oceans.
- Salty tongues at mid-depth come from enclosed seas: Mediterranean water at about 1,000 m in the North Atlantic, and Red Sea water at about 500–800 m in the north-western Indian Ocean.
- The Pacific has no such salty marginal seas, so its deep water is the most uniform, with salinity near 34.7.
- Salinity stratification: fresher, lighter water rests on saltier, denser water. A strong halocline suppresses vertical mixing, cutting off the supply of nutrients to the surface and of oxygen to the depths, as in the Black Sea and the Baltic.
Salinity Trends
- Salty regions are getting saltier and fresh regions fresher. Ship, Argo and satellite records since the mid-20th century show the surface salinity pattern amplifying.
- The subtropical cores and the Atlantic have become saltier. The western Pacific warm pool, the high latitudes and the Bay of Bengal have become fresher.
- A measure of the contrast between salty and fresh regions in the upper 2,000 m rose by about 5% between 1960 and 2017, and faster after 1990.
- This is a fingerprint of an intensifying water cycle. A warmer atmosphere holds more water vapour, so dry regions lose more water to evaporation and wet regions receive more rain (“wet gets wetter, dry gets drier” over the oceans).
- Salinity is used as an ocean rain gauge, because rain over the sea, which covers 71% of the globe, is hard to measure directly.
- Regional changes:
- The Bay of Bengal has been freshening while the Arabian Sea has grown saltier, which sharpens the contrast between them.
- The Arctic upper layer has freshened with sea-ice melt and river runoff.
- In the Southern Ocean, the long freshening reversed after about 2015. A satellite study led by Alessandro Silvano (July 2025) found surface salinity rising south of 50° S, with weaker stratification letting warm deep water reach the surface and melt sea ice from below.
- Melt-water from Greenland freshens the subpolar North Atlantic, where it may weaken deep-water formation and the overturning circulation.
- Why it matters:
- Stronger upper-ocean stratification reduces the mixing of heat, oxygen and nutrients, which affects fisheries and the ocean’s uptake of carbon.
- Changes in the salt balance of the high latitudes affect the formation of deep water, and so global heat transport.
- For India, the salinity and barrier layer of the Bay of Bengal feed into monsoon and cyclone forecasts. INCOIS assimilates Argo and satellite salinity into its ocean forecasts, and the Deep Ocean Mission includes ocean climate-change advisory services.
Previous Year Questions
2011Write short note on Salinity patterns in Indian Ocean.1993Give a reasoned account of the distribution of salinity in the oceans and partially enclosed seas.





Its useful for writing msc environmental science notes
You are provided the good contentS….Thanking you so much for your selfless service .
where’s the temp note?
your content is the most valuable for me. Thanks for sharing with us.
Most Welcome Pankaj
Thanks a lot for sharing content.
Isko whatsapp pr send kase Krna h
Copy the URL, and paste on Whatsapp.
use mains or not only for PRILMS 🤔
Correct the Salinty of Caspian Sea