

- Population density is the number of people per unit of area, usually persons per km². It expresses the man–land ratio and turns the distribution of world population into numbers that can be compared and mapped.
- The world average was about 62 persons per km² of land in 2023 (World Bank), up from 48 in 2000. The average hides an enormous range: from over 18,000 in Monaco and over 8,000 in Singapore to 2 in Mongolia.
- Density varies at every scale: between continents, between countries and, most sharply, within countries. Different measures of density are needed for different questions.
Measures of Population Density

- The idea of density was first mapped by Henry Drury Harness, whose 1837 maps of Ireland for the Irish railway commissioners shaded areas by the number of people.
- Density is used to compare areas of different size, to judge over- and under-population and to plan services.
- The choice of denominator decides what the figure means.
Arithmetic Density
- Arithmetic (crude) density = total population ÷ total land area.
- It is the simplest and most widely used measure, and the one census and World Bank figures report.
- Limitation: it treats all land as equal, whether farmland, desert, forest or mountain.
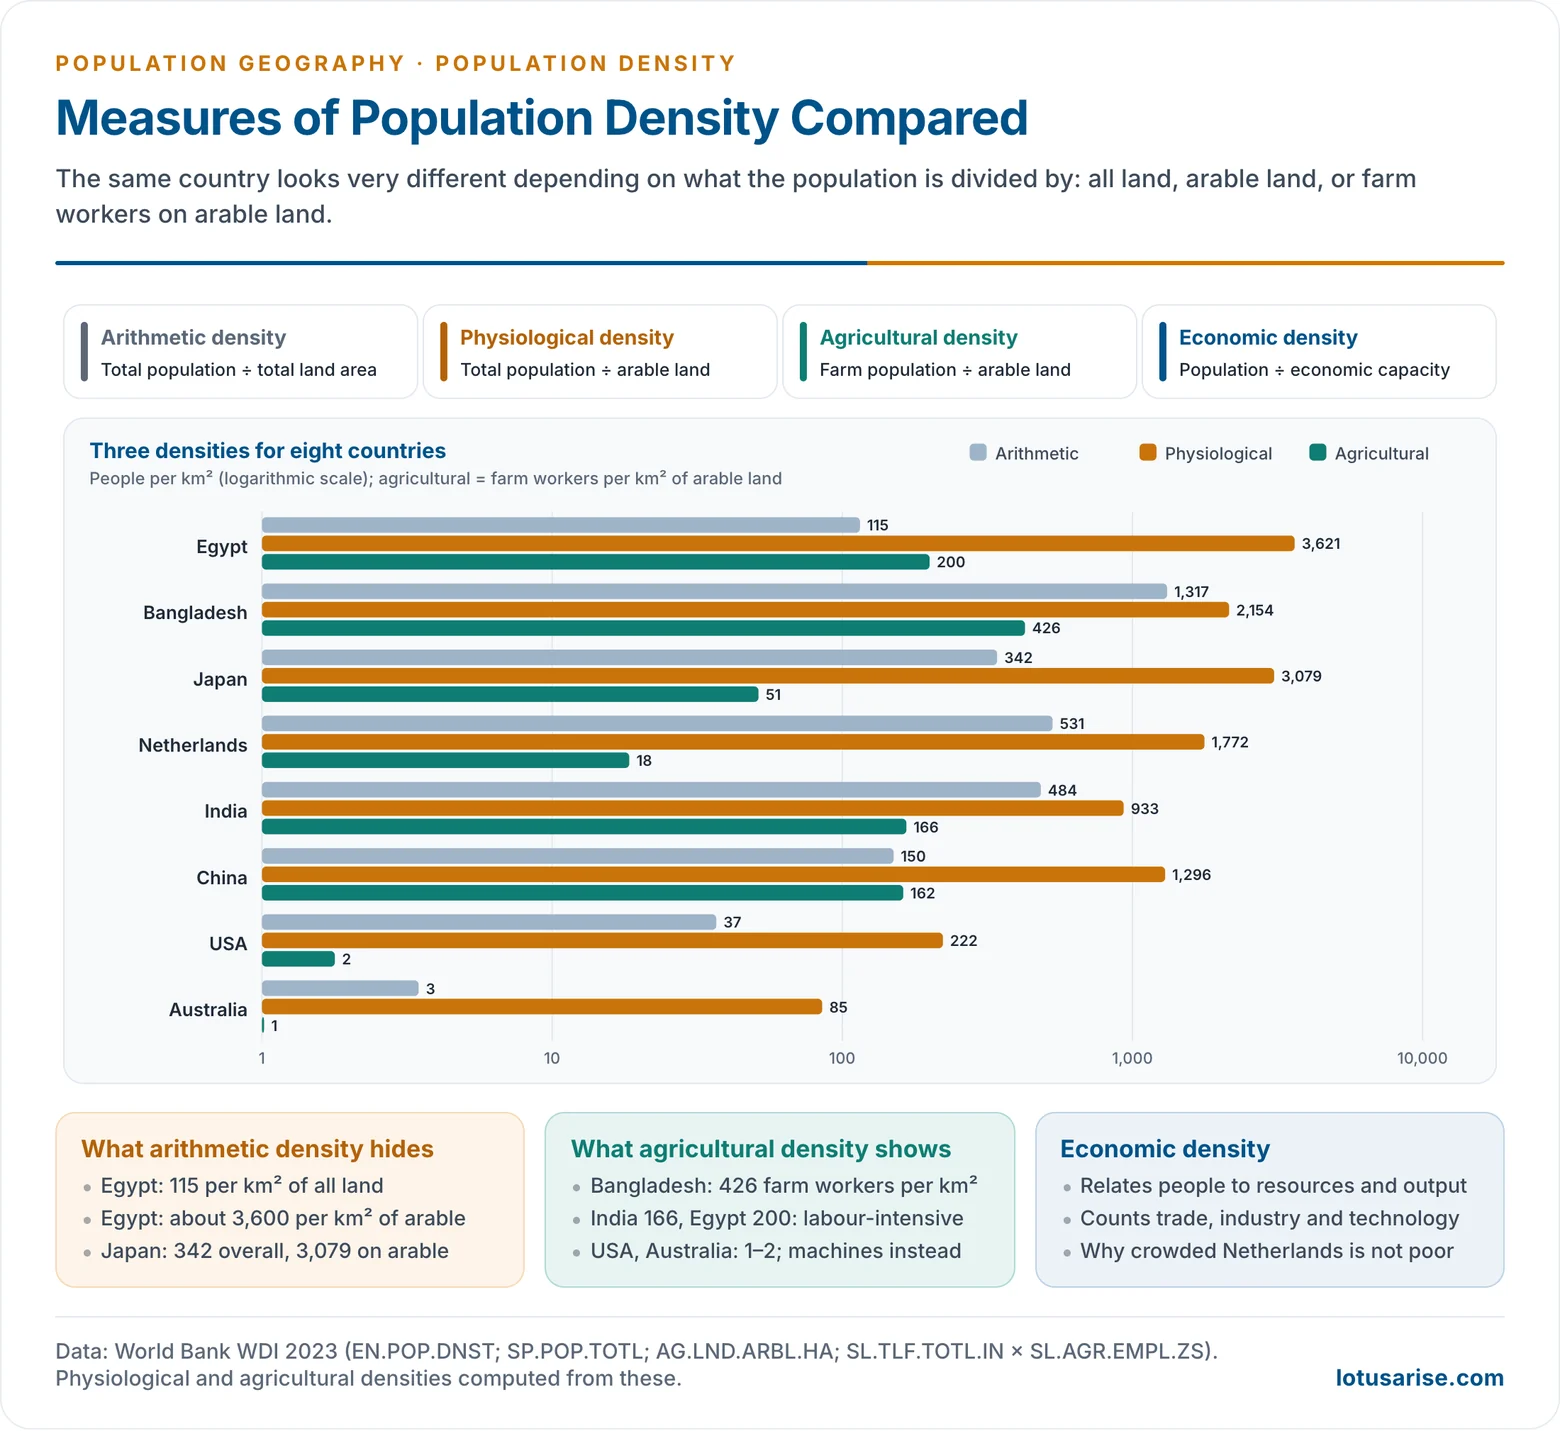
- Egypt’s arithmetic density is about 115 per km², yet nearly all Egyptians live on the narrow Nile valley and delta, where densities are many times higher.
- Australia’s 3 per km² hides crowded coastal cities and an empty interior.
- Densest units (2023): Monaco (about 18,700), Singapore (about 8,200), Hong Kong (about 7,200), Bahrain (about 2,000), the Maldives and Malta (over 1,700) and Bangladesh (about 1,300), the densest large country.
- Cities run far higher: Delhi recorded 11,320 per km² in Census 2011.
Physiological Density
- Physiological density = total population ÷ arable (cultivable) land.
- It measures the pressure of population on farmland and so on food production. It is most meaningful in agricultural economies.
- Examples (World Bank 2023):
- Egypt: about 3,600 per km² of arable land, against an arithmetic density of 115, because only about 3% of its land is arable.
- Japan (about 3,100) and South Korea (about 3,600): mountainous countries with little flat farmland.
- Bangladesh: about 2,150. Because most of the country is cultivated, its physiological and arithmetic densities are close.
- India: about 930; USA: about 220; Australia: about 85.
- A high physiological density means farmland may reach its output limit sooner. It also shows why food-importing, crowded countries invest in irrigation, high-yield farming or trade.
Agricultural Density
- Agricultural density = agricultural population (or farm workers) ÷ cultivated land.
- It shows how many farmers share the land, and so reflects the technology and efficiency of farming.
- High agricultural density means small holdings, labour-intensive methods and little machinery: Bangladesh has about 430 farm workers per km² of arable land, India about 170 and Egypt about 200.
- Low agricultural density means large, mechanised, capital-intensive farms: USA, Canada, Australia have only 1–2 per km².
- Comparing physiological and agricultural density is revealing.
- Japan and the Netherlands have high physiological but low agricultural density: many people per field, but few farmers. Their people work in industry and services and feed themselves partly by trade.
Nutritional and Economic Density
- Nutritional density relates population to the area actually producing food crops. It identifies food-stress regions and is useful in countries with large areas under cash crops or fodder.
- Economic density relates population to the economic capacity of an area, its resources, production and income, rather than to land alone.
- It is the most comprehensive measure, and the hardest to compute.
- It explains why the crowded Netherlands is rich while thinly peopled parts of the Sahel are poor: what matters is people against productive capacity, the idea behind over-, under- and optimum population.
Concentration Index
- Density alone does not show whether an area is more or less crowded than its surroundings. The concentration index does.
- Concentration index = density of the unit ÷ average density of the whole country, equivalent to the unit’s share of population ÷ its share of area.
- A value of 1 means an average share; above 1.5 marks high concentration and below 0.5 low concentration.
- It is used in regional planning to identify over-concentrated and under-populated areas.
| Measure | Formula | Shows | Example (2023) |
|---|---|---|---|
| Arithmetic | Population ÷ land area | General crowding | Bangladesh 1,317; India 484; World 62 |
| Physiological | Population ÷ arable land | Pressure on farmland | Egypt about 3,600 vs arithmetic 115 |
| Agricultural | Farm population ÷ arable land | Farming efficiency | Bangladesh about 430; USA about 2 |
| Nutritional | Population ÷ food-crop area | Food stress | Areas under cash crops |
| Economic | Population ÷ economic capacity | Living standards | Netherlands vs Sahel |
Mapping Density
- Choropleth maps shade administrative units by their density.
- They are easy to read, but large units average out internal contrasts, and results change with the size and shape of the units chosen. This is the modifiable areal unit problem.
- Dasymetric maps redistribute population within units, using land use: people are removed from water, forest and desert and placed on settled land.
- Isopleth maps join points of equal density, useful for smooth patterns such as city density gradients.
- Gridded datasets now combine census counts with satellite imagery of built-up land to estimate people in uniform cells of 1 km or less (Gridded Population of the World, the Global Human Settlement Layer, WorldPop). They make world density maps comparable across borders.
Uses and Limits of Density
- Density is a first indicator of population pressure, used in planning schools, health centres, transport and housing.
- In India, a density of at least 400 per km² is one of the three tests for a census town, with a population of at least 5,000 and at least 75% of male workers outside agriculture.
- But high density is not the same as over-population.
- The Netherlands (531 per km²) and Singapore (over 8,000) are rich; Niger and Mali, with far lower densities, are poor and short of food.
- What matters is the balance of people with resources, technology and organisation, which only physiological and economic density begin to capture.
- Density also says nothing about age, skills or incomes. It is a starting point for analysis, not a conclusion.
Global Pattern of Population Density
Variation at Three Scales
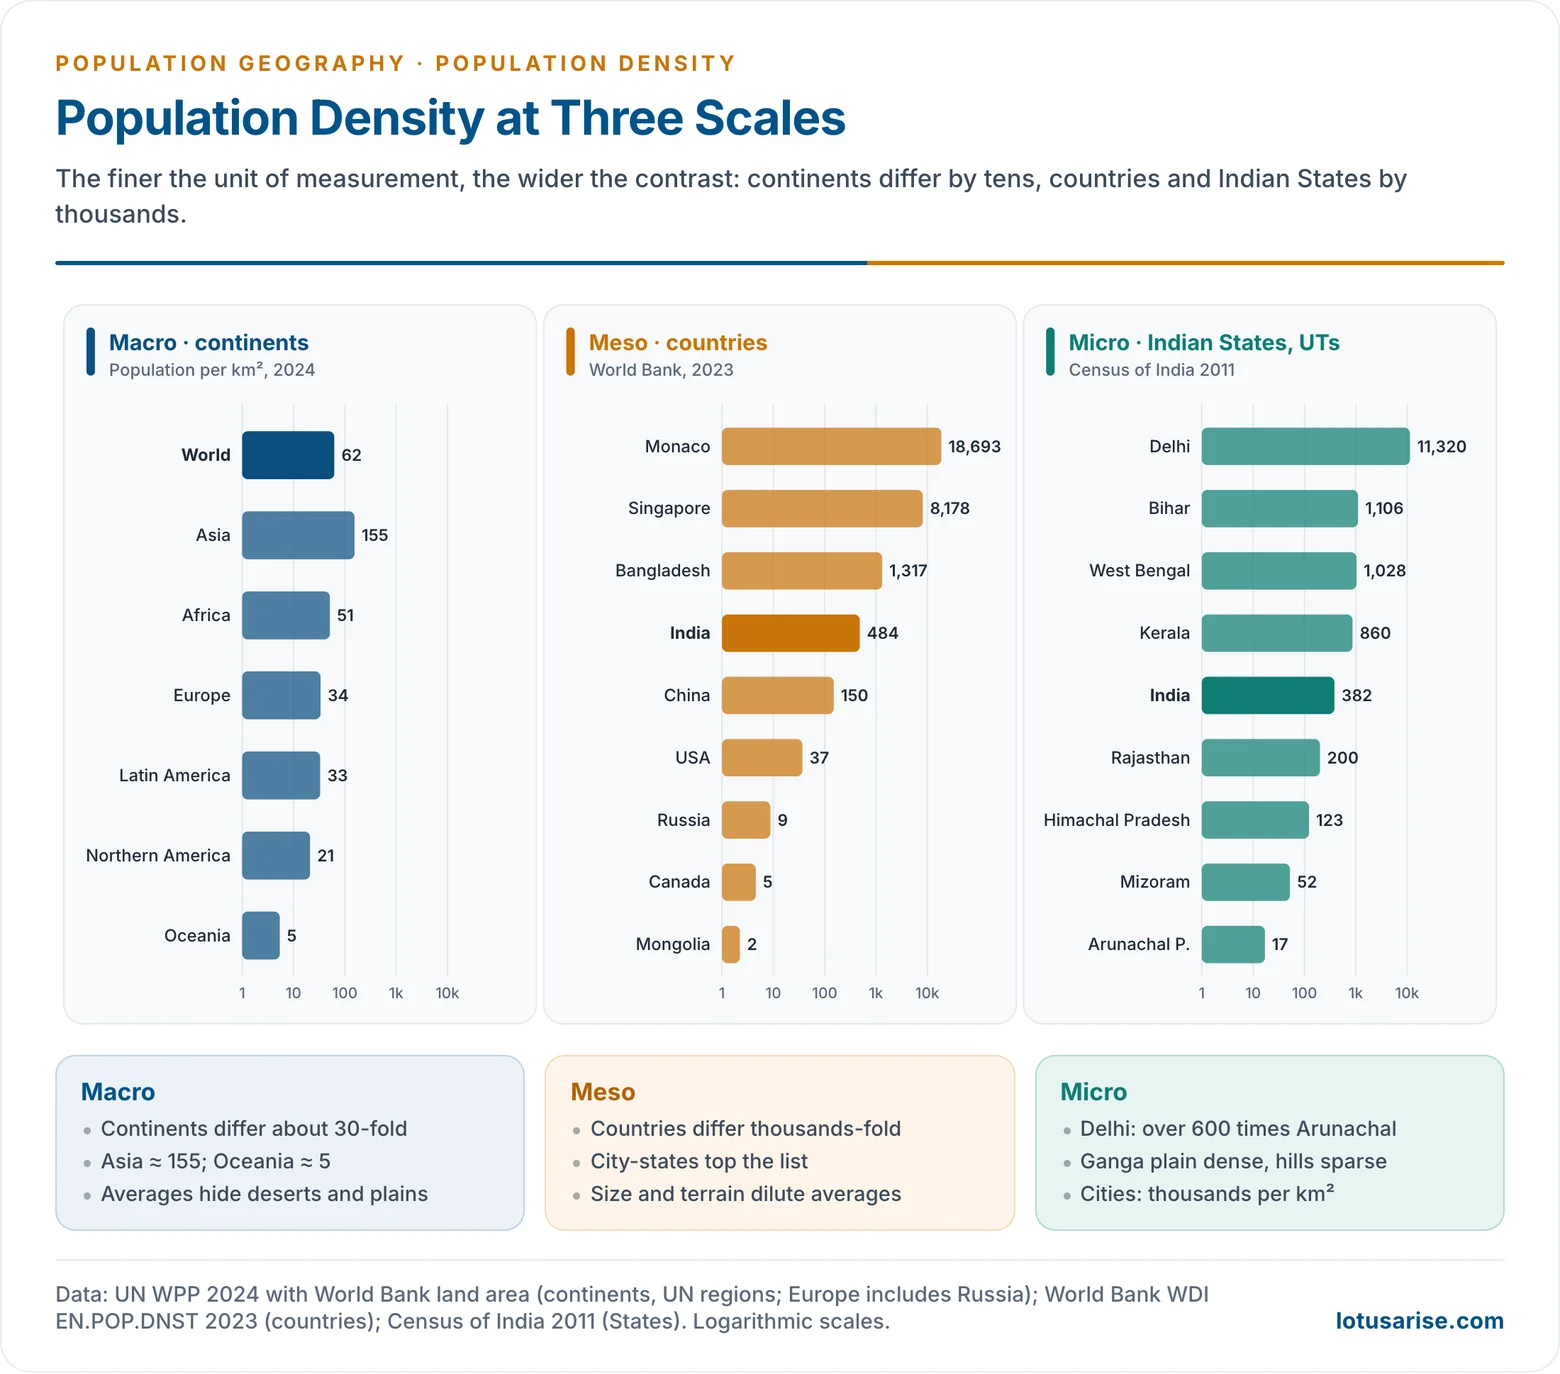
- Macro level (continents): variation is moderate.
- Asia about 155 per km² (2024): fertile river plains, monsoon rice farming, a long agricultural history.
- Africa about 51, rising fast: dense clusters (Nile, Nigeria, East African highlands) amid sparse deserts and forests.
- Europe about 34 including all of Russia, but over 100 without it: early industrialisation, cities and dense transport networks.
- Latin America about 33: people along the coasts and in highland basins; the Amazon is nearly empty.
- Northern America about 21: dense in the north-east and on the coasts, sparse in the west and north.
- Oceania about 5: arid interiors and scattered islands.
- Meso level (countries): variation is extreme, from Bangladesh’s 1,317 to Mongolia’s 2.
- India 484, China 150, USA 37, Russia 9, Canada 5, Australia 3.
- Density depends on habitability and economic viability, not on area: large countries with deserts or tundra have low averages.
- Micro level (within countries): variation is sharpest.
- Urban vs rural: city cores reach over 10,000 per km²; rural areas a few hundred or less.
- Plains vs mountains: the Ganga plain against the Himalaya.
- Coasts vs interiors: coastal belts with ports and trade against remote interiors.
- The general rule: the smaller the unit, the wider the contrast.
Urban Densities
- Cities are the densest human environments.
- Manila’s city proper has over 40,000 people per km²; the cores of Dhaka and Mumbai’s island city have around 20,000 or more (Mumbai City district: about 19,700 in Census 2011).
- City-states such as Singapore, Hong Kong, Macao and Monaco top the national tables because they are wholly urban.
- Colin Clark (1951) showed that urban density falls with distance from the city centre in a regular, negative exponential curve.
- Over time the curve flattens: centres lose people as suburbs grow, the process of urban sprawl.
- Asian cities are generally denser than European cities, and North American cities the least dense, reflecting land costs, transport and planning traditions.
World Density Zones
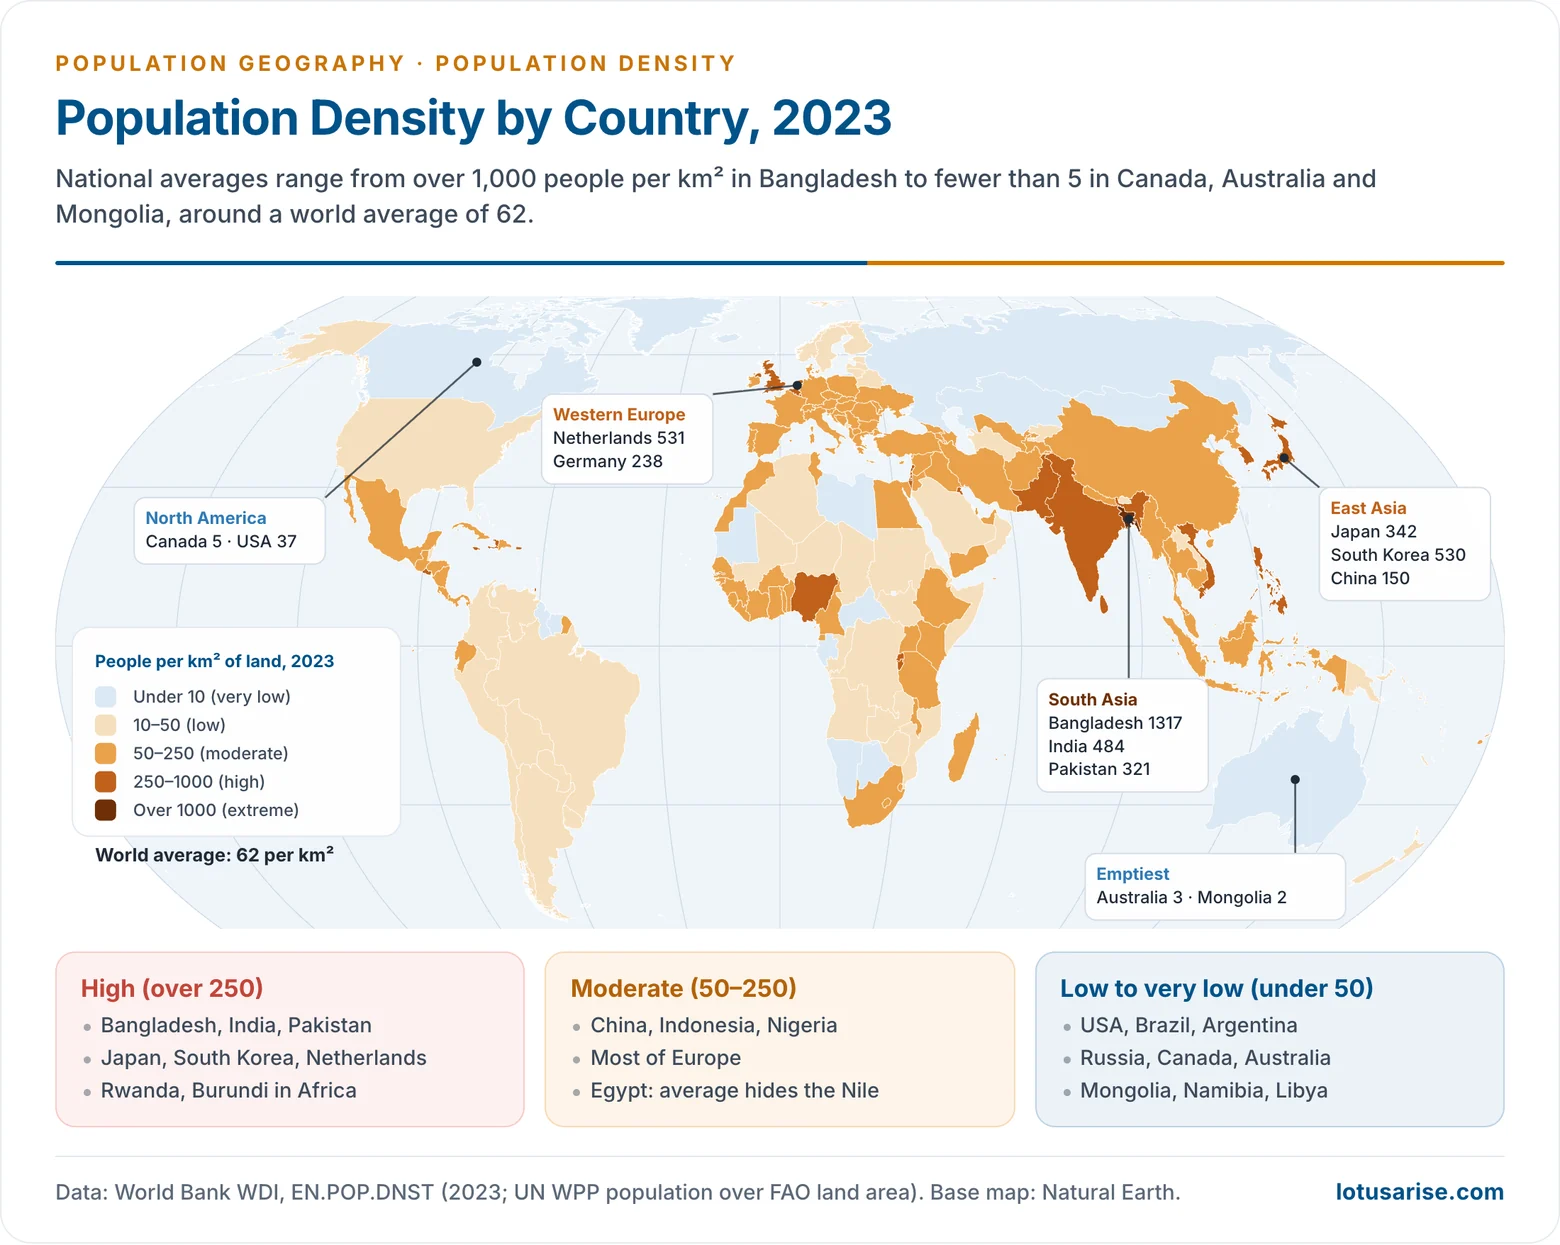
- High density (over 250 per km²): the cores of human settlement.
- South Asia: the Ganga–Brahmaputra plain, coastal India, Bangladesh, Pakistan’s Punjab.
- East Asia: eastern China, Japan, South Korea.
- South-East Asia: Java, the Red River and Mekong deltas, Luzon.
- Western Europe: England, the Low Countries, the Rhine–Ruhr, northern Italy.
- Smaller pockets: the Nile valley, southern Nigeria, Rwanda and Burundi, the Great Lakes region of East Africa.
- Causes: fertile alluvial or volcanic soils, adequate water, long agricultural history, and in Europe and Japan, industrial and urban economies.
- Two different types share this zone: agrarian high densities in monsoon Asia and the Nile, where many farmers live on small holdings, and urban–industrial high densities in Western Europe and Japan, where most people live in cities.
- Moderate density (50–250): mixed farming and urban–industrial regions.
- Eastern USA, most of Europe, northern and interior China, Indonesia outside Java, coastal Brazil, Nigeria, Ethiopia’s highlands, Mexico’s plateau.
- Farming is productive but less intensive, or cities alternate with rural areas of moderate density. Many of these regions are filling up fast, especially in Africa.
- Low density (10–50): areas with environmental limits or extensive land use.
- The interior USA and Prairies, Central Asia, the Pampas, much of Africa’s savanna and Brazil’s interior.
- Typical land uses are extensive grain farming, ranching and pastoralism, which need few people per km².
- Very low density (under 10): the non-ecumene and its margins.
- Hot deserts: Sahara, Arabia, central Australia.
- Cold lands: Siberia, northern Canada, Greenland, Alaska.
- High mountains and plateaus: Tibet, the Andes, the Himalaya.
- Equatorial forests: the Amazon and Congo basins.
- Countries: Mongolia, Namibia, Libya, Australia, Canada, Iceland.
What Shapes the Pattern
- The density pattern is the joint outcome of:
- Physical factors: relief, climate, water and soil set the limits.
- Historical factors: the age of farming civilisations.
- Economic factors: industry, cities, transport and trade.
- Technology: irrigation, drainage, air-conditioning and desalination stretch the limits.
- Density is best read as a dynamic outcome of human–environment interaction, in the possibilist sense: the combined working of the factors influencing population distribution and density.
Trends
- World density is rising, from 48 per km² in 2000 to 62 in 2023, but unevenly:
- Nigeria rose from about 140 to 250 per km² and India from about 360 to 484.
- Japan fell slightly, from 348 to 342, and many East European densities are falling.
- About 87% of people live in the Northern Hemisphere, and about half live between 20°N and 40°N. River valleys and coasts keep their lead because of accessibility, fertility and economic opportunity.
- Urbanisation is concentrating people further into very dense city regions, while some rural areas of Europe, Japan and China are thinning out.
Population Density in India
- India’s density was 382 per km² in Census 2011. The World Bank estimate for 2023 is about 484.
- It has risen with every census except 1921: 77 (1901), 81 (1921, after the influenza pandemic and famines), 117 (1951), 216 (1981), 325 (2001) and 382 (2011).
- India has about 18% of the world’s people on 2.4% of its land.
- The next census has a reference date of 1 March 2027, so 2011 remains the latest count by State.
- State contrasts (Census 2011):
- Highest: Bihar (1,106), West Bengal (1,028), Kerala (860), Uttar Pradesh (829).
- Lowest: Arunachal Pradesh (17), Mizoram (52), Sikkim (86).
- Among Union Territories, Delhi (11,320) and Chandigarh (9,258) are the densest.
- Density regions:
- High: the Ganga plain and the deltas, coastal Kerala and Tamil Nadu. Alluvium, water, an agrarian history and cities.
- Moderate: the Peninsular plateau. It varies with soils, irrigation and industry (Maharashtra, Gujarat, Karnataka).
- Low: the western Thar, the forested central and eastern hills, the Himalaya and the North-East hills. Aridity, slopes, forest and isolation.
- Within States the contrasts are sharper still: coastal Andhra against the interior plateau, the Assam valley against the hills, cities against villages.
- Together these contrasts make up the population distribution and density of India, shaped by the same physical and economic factors as the world pattern.
Previous Year Questions
- No direct PYQ has been asked on this sub-topic yet.




