

Official syllabusPaper II · Unit 1 · Psychological Measurement of Individual Differences
Characteristics and construction of standardized psychological tests – norms.
Definition
“Scores on psychological tests are most commonly interpreted by reference to norms that represent the test performance of the standardization sample. The norms are thus empirically established by determining what persons in a representative group actually do on the test.”
Anastasi and Urbina (1997)
A raw score of 38 out of 60 says nothing until it is placed against what comparable people score, and norms supply that comparison. The topic turns on three questions: who the comparison group is, on what scale standing is reported, and whether relative standing is the right question at all — which is where criterion-referenced measurement enters.
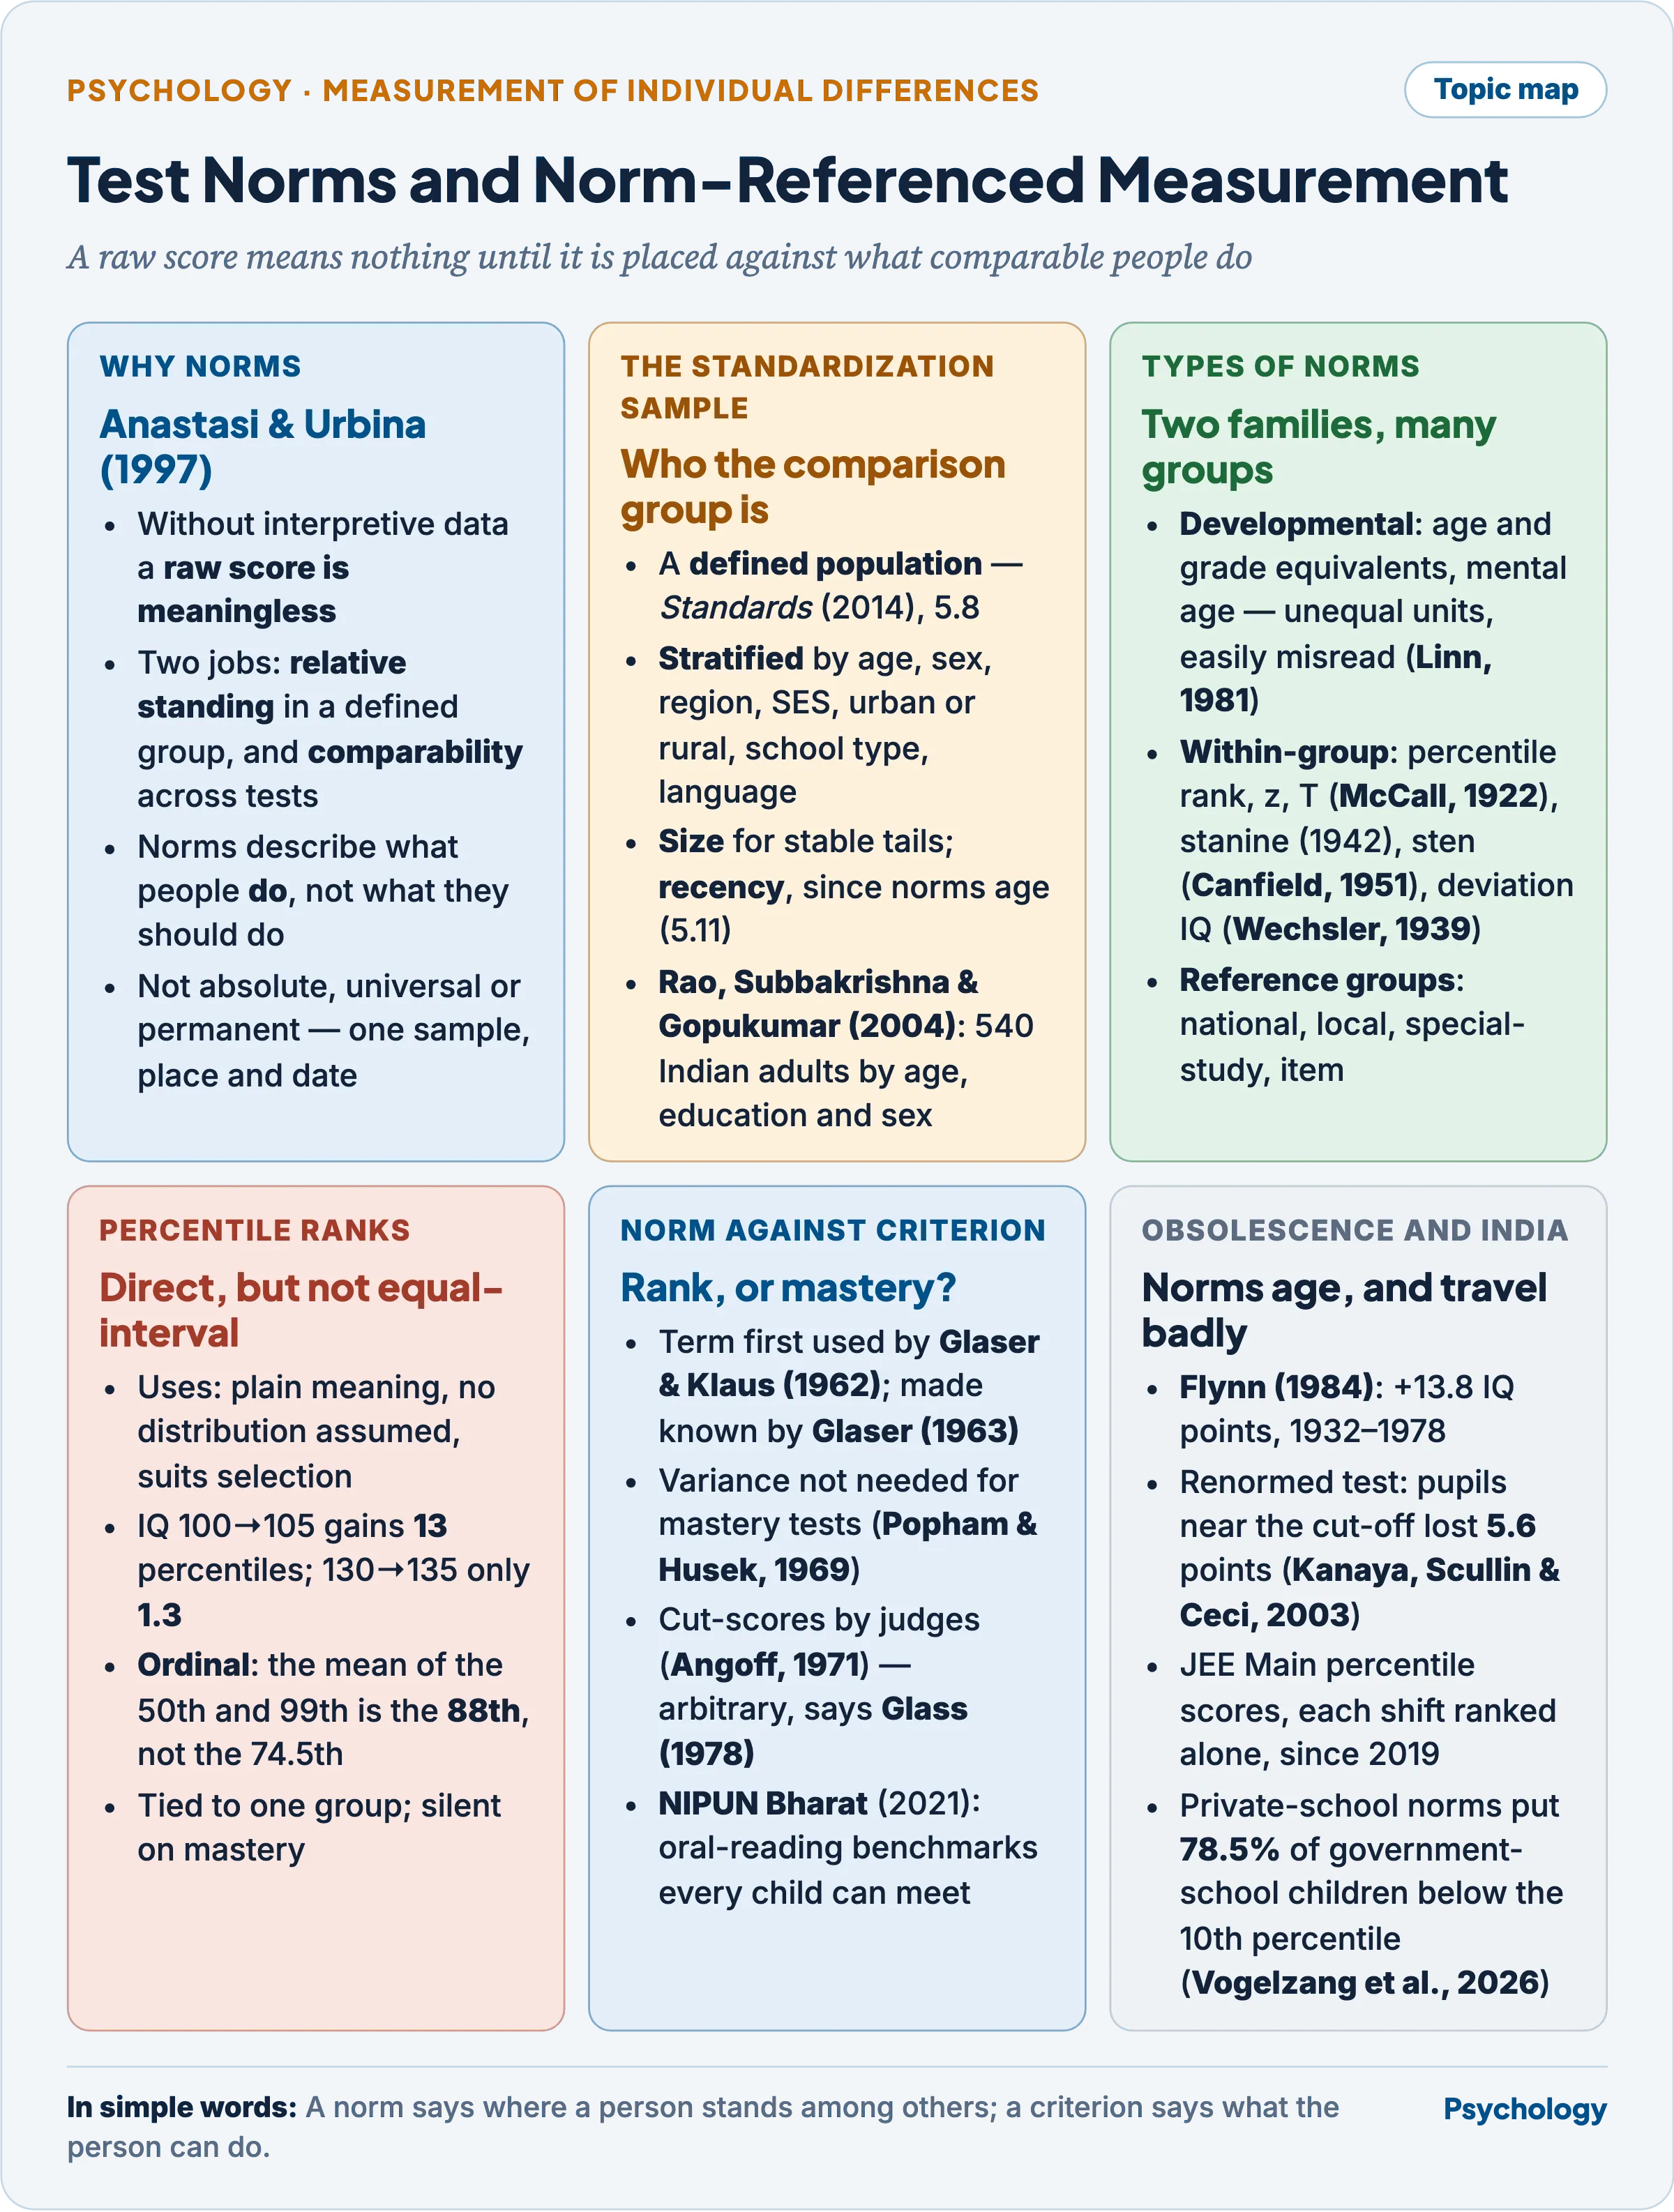
Every later choice — the sample, the scale, the reference group — decides what a person’s standing actually means.
Norms among the characteristics of standardized psychological tests
- Anastasi and Urbina (1997) state the premise: “In the absence of additional interpretive data, a raw score on any psychological test is meaningless.”
- Norms do two jobs: they give a person’s relative standing in a defined group, and they make different tests comparable by converting each raw score to the same derived scale.
- In the older, narrow sense a norm is the mean or median score of a specified group; a modern table of norms carries the whole distribution, so any score can be located.
- Norms describe what people do, not what they should do. They are not standards, and they are neither absolute, universal nor permanent: each table belongs to one sample, place and date (Anastasi and Urbina, 1997).
- Norms stand beside standard administration and scoring, reliability and validity among a standardized test’s characteristics, and are built last, since any later change to items voids them — the sequence is in Construction and Standardization of Psychological Tests.
Construction of norms: the standardization sample
- The population is defined first: Standard 5.8 of the AERA, APA and NCME Standards (2014) requires norms to refer to clearly described populations, including those with whom users will ordinarily compare their examinees.
- Representativeness comes from stratified sampling: the population’s proportions by age, sex, region, socio-economic status, urban or rural residence, school type and language are reproduced. Achievement norms also depend on the schools sampled, aptitude norms on work experience.
- Size buys precision, above all at the tails, where a percentile rests on few cases. A convenience sample — one school, one hospital, volunteers — builds in a bias that no increase in size removes.
- Populations change over time — the Flynn effect, below — so Standard 5.11 (2014) makes periodic renorming the test publisher’s continuing duty.
- Standard 5.9 (2014) asks norming reports for the population, sampling procedure, participation rates, weighting, dates of testing and descriptive statistics — what a user needs to judge whether the norms fit the person tested.
- Sampling error is a principal source of error in norms. Angoff (1971) noted that, unlike random error in individual scores, it does not shrink as data are aggregated: it acts as a bias on every comparison made against the table.
- An Indian model is the NIMHANS Neuropsychology Battery of Rao, Subbakrishna and Gopukumar (2004): 19 tests normed on 540 healthy adults in three age bands (16–30, 31–50, 51–65), two education levels and both sexes, plus an illiterate sample, reported as percentiles.
Types of norms
Derived scores express either the developmental level reached or the relative position within a specified group (Anastasi and Urbina, 1997).
Developmental norms
- Age norms give the average score at each age. A ten-year-old scoring at the nine-year-old average has an age equivalent of nine — on an intelligence test, a mental age, whose ratio IQ is traced in IQ, Deviation IQ and the Constancy of IQ (Paper I).
- Grade norms do the same by school grade: a grade equivalent of 4.5 is the median of children tested in the fifth month of Grade 4.
- Their units are unequal — a year’s growth at six is not a year’s growth at fourteen, and neither means anything in adulthood — and many values are extrapolated beyond the grades tested.
- Linn (1981) warned that grade equivalents invite “seemingly simple but misleading interpretations”: a year’s growth equals one grade only for the average pupil, and a fifth-grader scoring 8.0 has not mastered eighth-grade work.
- Berk (1981) showed why they mislead in identifying learning disability: unequal units, smoothed-over growth and values that differ between test batteries.
Within-group norms: percentile ranks and standard scores
- A percentile rank is the percentage of the norm group scoring below a given score; a percentile is the score below which a stated percentage falls. If seven in ten score below 55, the 70th percentile is 55 and the rank of 55 is 70.
- A standard score is distance from the mean in standard-deviation units: z = (X − Mean) ÷ SD. Every other scale relabels z.
| Scale | Mean | SD | Usual range | Origin |
|---|---|---|---|---|
| z score | 0 | 1 | −3 to +3 | the parent scale |
| T score | 50 | 10 | 20 to 80 | McCall (1922); MMPI |
| Stanine | 5 | 2 | 1 to 9 | US Army Air Forces (1942) |
| Sten | 5.5 | 2 | 1 to 10 | Canfield (1951); 16PF |
| Deviation IQ | 100 | 15 | 55 to 145 | Wechsler (1939) |
| Scaled score | 10 | 3 | 1 to 19 | Wechsler subtests |
- The stanine cuts the curve into nine bands, the inner seven half an SD wide, holding 4, 7, 12, 17, 20, 17, 12, 7 and 4 per cent of cases (US Army Air Forces, 1942) — coarse by design, so small differences are not over-read.
- Linear standard scores keep the raw distribution’s shape. Normalized standard scores convert ranks into the z values they would have under a normal curve, forcing normality; stanines and most deviation IQs are normalized, defensible only if the trait is plausibly normal.
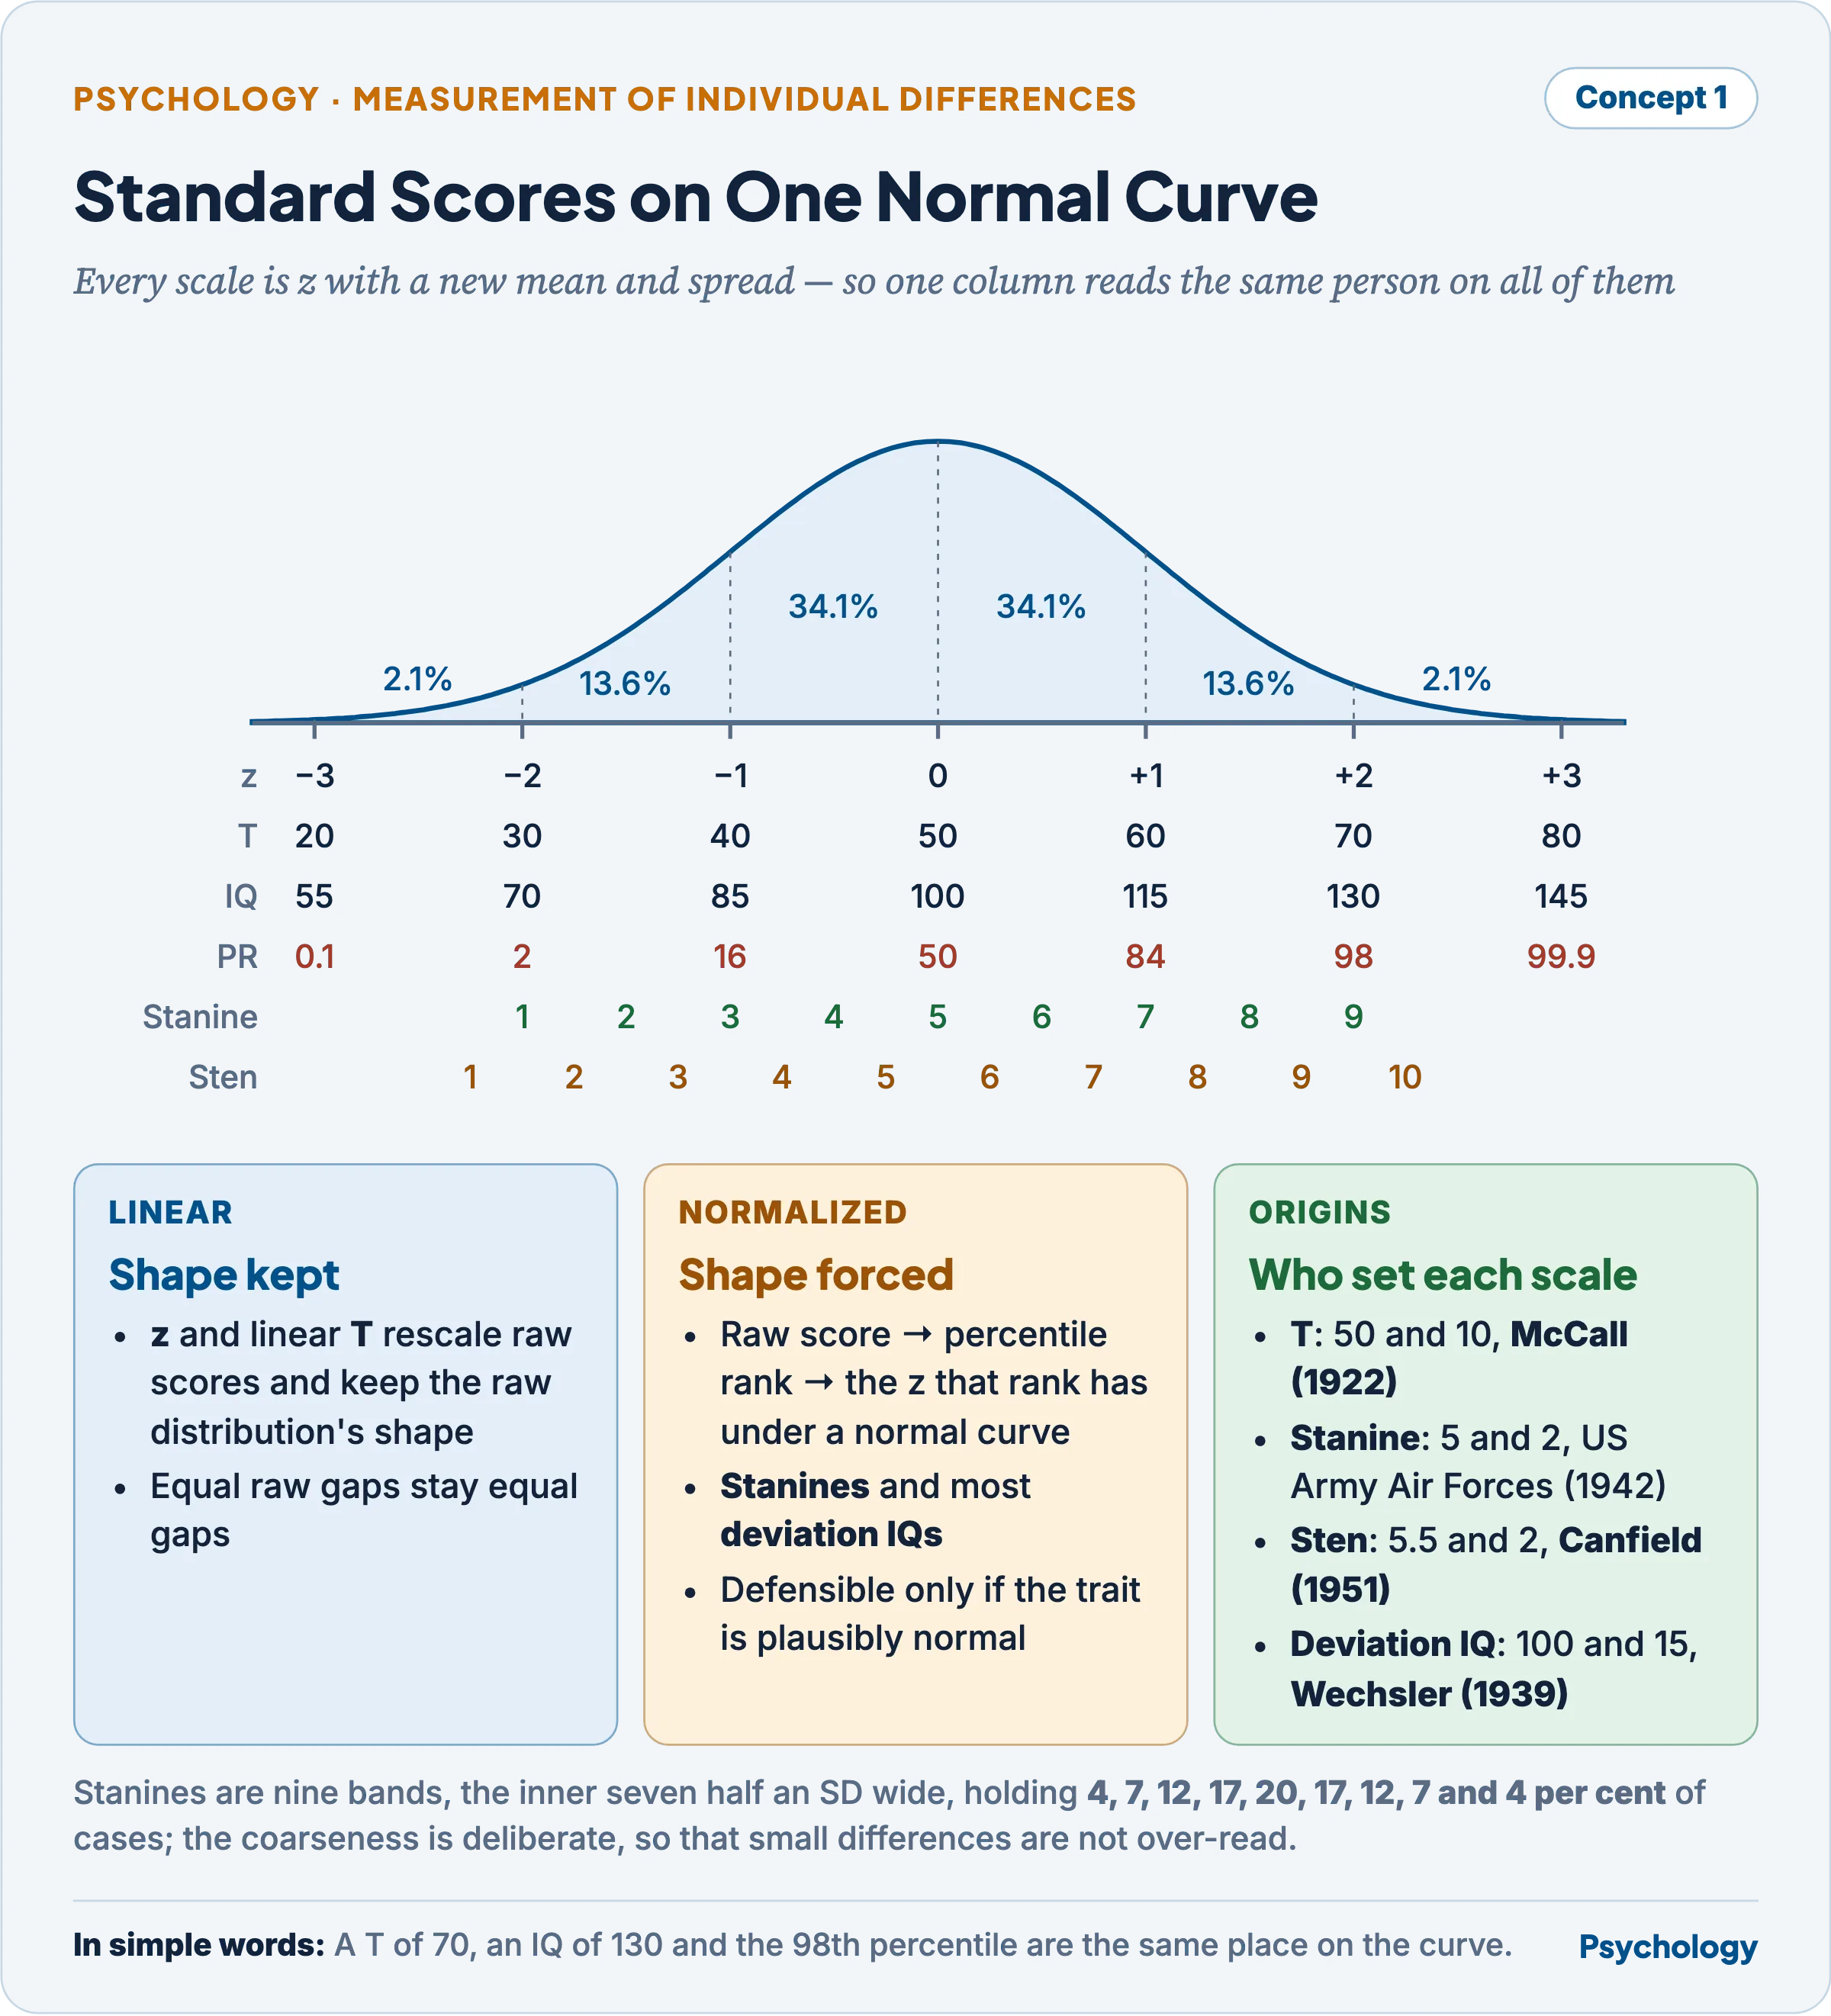
Six scales, one curve: each is z relabelled, which is why a T of 70, a stanine of 9 and an IQ of 130 sit almost together.
National, local and subgroup norms
- National norms give one common yardstick, at the greatest cost. Local norms — one school, district or employer’s applicant pool — suit local decisions and do not generalize.
- Special-study norms describe a defined group, such as children with autism aged six to ten; item norms give the percentage passing each item, showing a teacher where a class falls short.
- The Raven Standard Progressive Matrices norms for Pune and Mumbai, collected in 1997 under C. G. Deshpande from 10,288 pupils in 78 schools teaching in four languages, are careful regional norms, not national ones — a distinction users easily lose.
Percentile ranks: uses and limitations
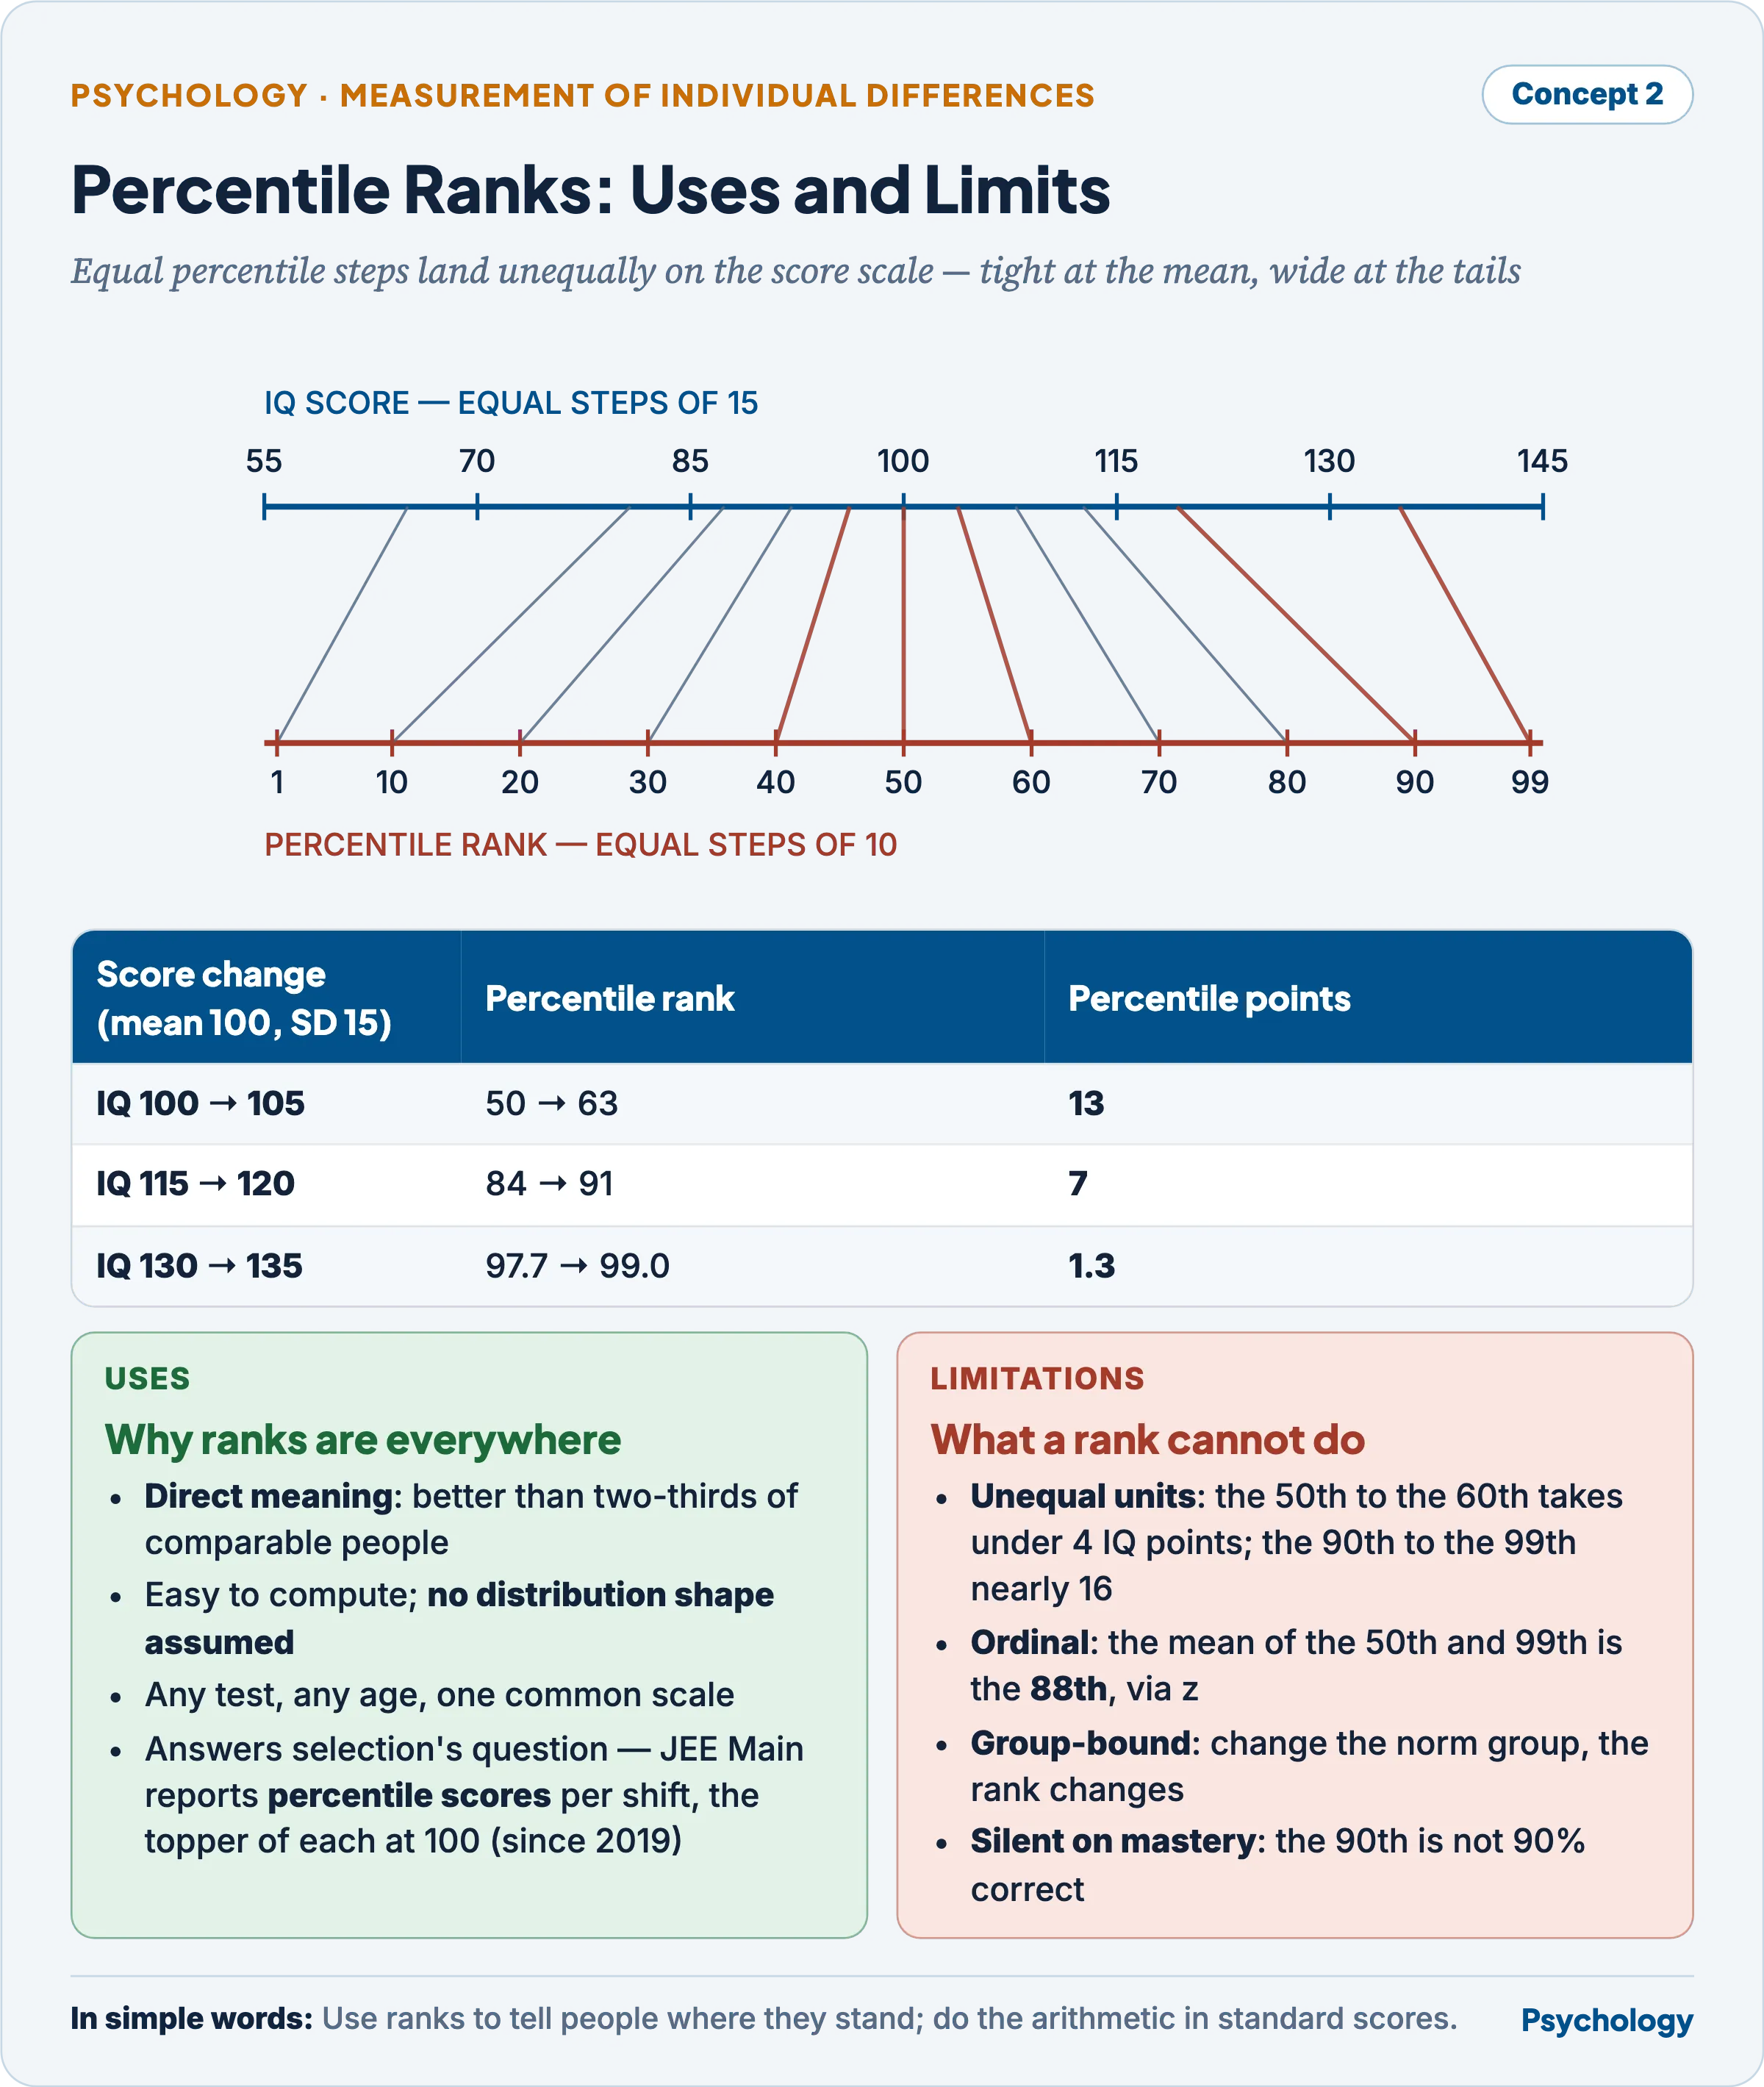
Equal steps of percentile crowd into the middle of the score scale: five IQ points are worth thirteen percentiles at the mean and barely one at the top.
- A percentile rank’s chief use is its directness of meaning — “better than two-thirds of comparable students” needs no statistics. It is easy to compute, assumes no distribution shape, suits any test and age, and answers selection’s question: where does this candidate stand?
- Computed from the normal curve, on a deviation-IQ scale (mean 100, SD 15) the same five points buy very different amounts of percentile.
| Score change | Percentile rank change | Percentile points |
|---|---|---|
| 100 → 105 | 50 → 63 | 13 |
| 115 → 120 | 84 → 91 | 7 |
| 130 → 135 | 97.7 → 99.0 | 1.3 |
- Read in reverse, the 50th to the 60th percentile takes under four IQ points; the 90th to the 99th takes nearly sixteen. This inequality of units, worst at the extremes, is the chief drawback of percentiles (Anastasi and Urbina, 1997).
- Percentile ranks are ordinal, so cannot be averaged: the mean of a 50th and a 99th percentile is not the 74.5th: as z (0 and 2.33), averaged (1.16) and converted back, it is the 88th. Profiles and gains belong in standard scores.
- A rank is tied to one group: the 80th percentile among scholarship candidates and in the general population are different performances; change the norm group and the rank changes with no change in the person.
- A rank is silent on mastery: a 90th percentile is not nine-tenths correct, and a whole group may be competent while half of it still falls below the median.
- Error looks largest in the middle: three IQ points either side of a score spans the 42nd to 58th percentile at the mean but the 96th to 99th near 130, so a rank is a band (error is treated in Reliability of Psychological Tests).
Norms for a test of general mental ability for use in India
- The uses come first, because school guidance, clinical diagnosis and selection each need a different comparison group.
- The sampling frame is Census 2011 proportions by state, sex, age and urban or rural residence, until Census 2027 data arrive (notified 16 June 2025, reference date 1 March 2027); children sampled through government, aided and private schools.
- The norms required:
- Age norms in three- to six-month bands for children, wider for adults, on a deviation-IQ metric with percentile ranks.
- National norms as the common yardstick.
- Language-version norms: Census 2011 rationalized 19,569 raw mother-tongue returns into 121 languages, 22 of them scheduled, and each translation needs its own norms or demonstrated equivalence — the DIF checks in Item Analysis and Item Validation.
- State, urban–rural, socio-economic and school-type norms, indexed by parental education and occupation.
- Gender analysed separately, pooled only where no difference appears.
- Special-group norms for tribal communities, children with disabilities and adults with little schooling, plus local norms for a school’s or employer’s own pool.
- Renorming follows a ten- to fifteen-year cycle, tighter in India because of its large secular gains (below).
- A mismatched norm sample has been measured directly.
- Vogelzang, Wigdorowitz and Tsimpli (2026) scored 1,752 government-school children aged 8–11 in Delhi, Hyderabad and Patna on the Indian Coloured Progressive Matrices norms, built only on private-school children.
- Vogelzang and colleagues (2026) found 78.5 per cent below the 10th percentile — an implausible result — and built new age norms. Limitation: three cities, and a one-year retest correlation of .52.
- Lower norms need not mean a broken test.
- Deshpande and Patwardhan (2008) tested 6,199 pupils aged 8–21 in nine tribal clusters, Thane to Raipur, in 2005–06.
- Their norms fell well below urban ones, but item difficulties ran in the usual order, so the test worked alike; the striking result was the spread within the sample. Limitation: only school attenders were reached.
The case for and against separate subgroup norms
- For: diagnosis and guidance ask how a person compares with people of similar opportunity. Education-stratified norms (Rao and colleagues, 2004) stop an unschooled adult’s low score being read as brain damage, and reveal talent national norms would hide.
- Against: selection predicts a common criterion — one course, one job — which a subgroup rank no longer predicts, and relabelling a gap can conceal disadvantage needing remedy. Each added stratum also thins the cases per cell.
- The legal contrast: Section 106 of the US Civil Rights Act 1991 forbade employers to “adjust the scores of, use different cutoff scores for, or otherwise alter the results of” tests by race, colour, religion, sex or national origin.
- It ended within-group percentile scoring of the General Aptitude Test Battery, which Hartigan and Wigdor (1989) had reviewed and endorsed for job referral.
- The working resolution: national norms decide selection; subgroup norms are reported alongside, never substituted silently, for diagnosis, guidance and the search for unrecognized ability — close to the dual reporting, norm group named, that Hartigan and Wigdor (1989) recommended.
Norm-referenced and criterion-referenced measurement
- Glaser and Klaus (1962) first used the term criterion-referenced; Glaser (1963) made it known: such measures “provide information as to the degree of competence attained by a particular student which is independent of reference to the performance of others.”
- Norm-referenced measurement interprets a score by its standing in a norm group; criterion-referenced measures are “used to ascertain an individual’s status with respect to some criterion, i.e., performance standard” (Popham and Husek, 1969).
- It needs a precisely specified domain of tasks, which is why mastery learning (Bloom, 1968) depends on it.
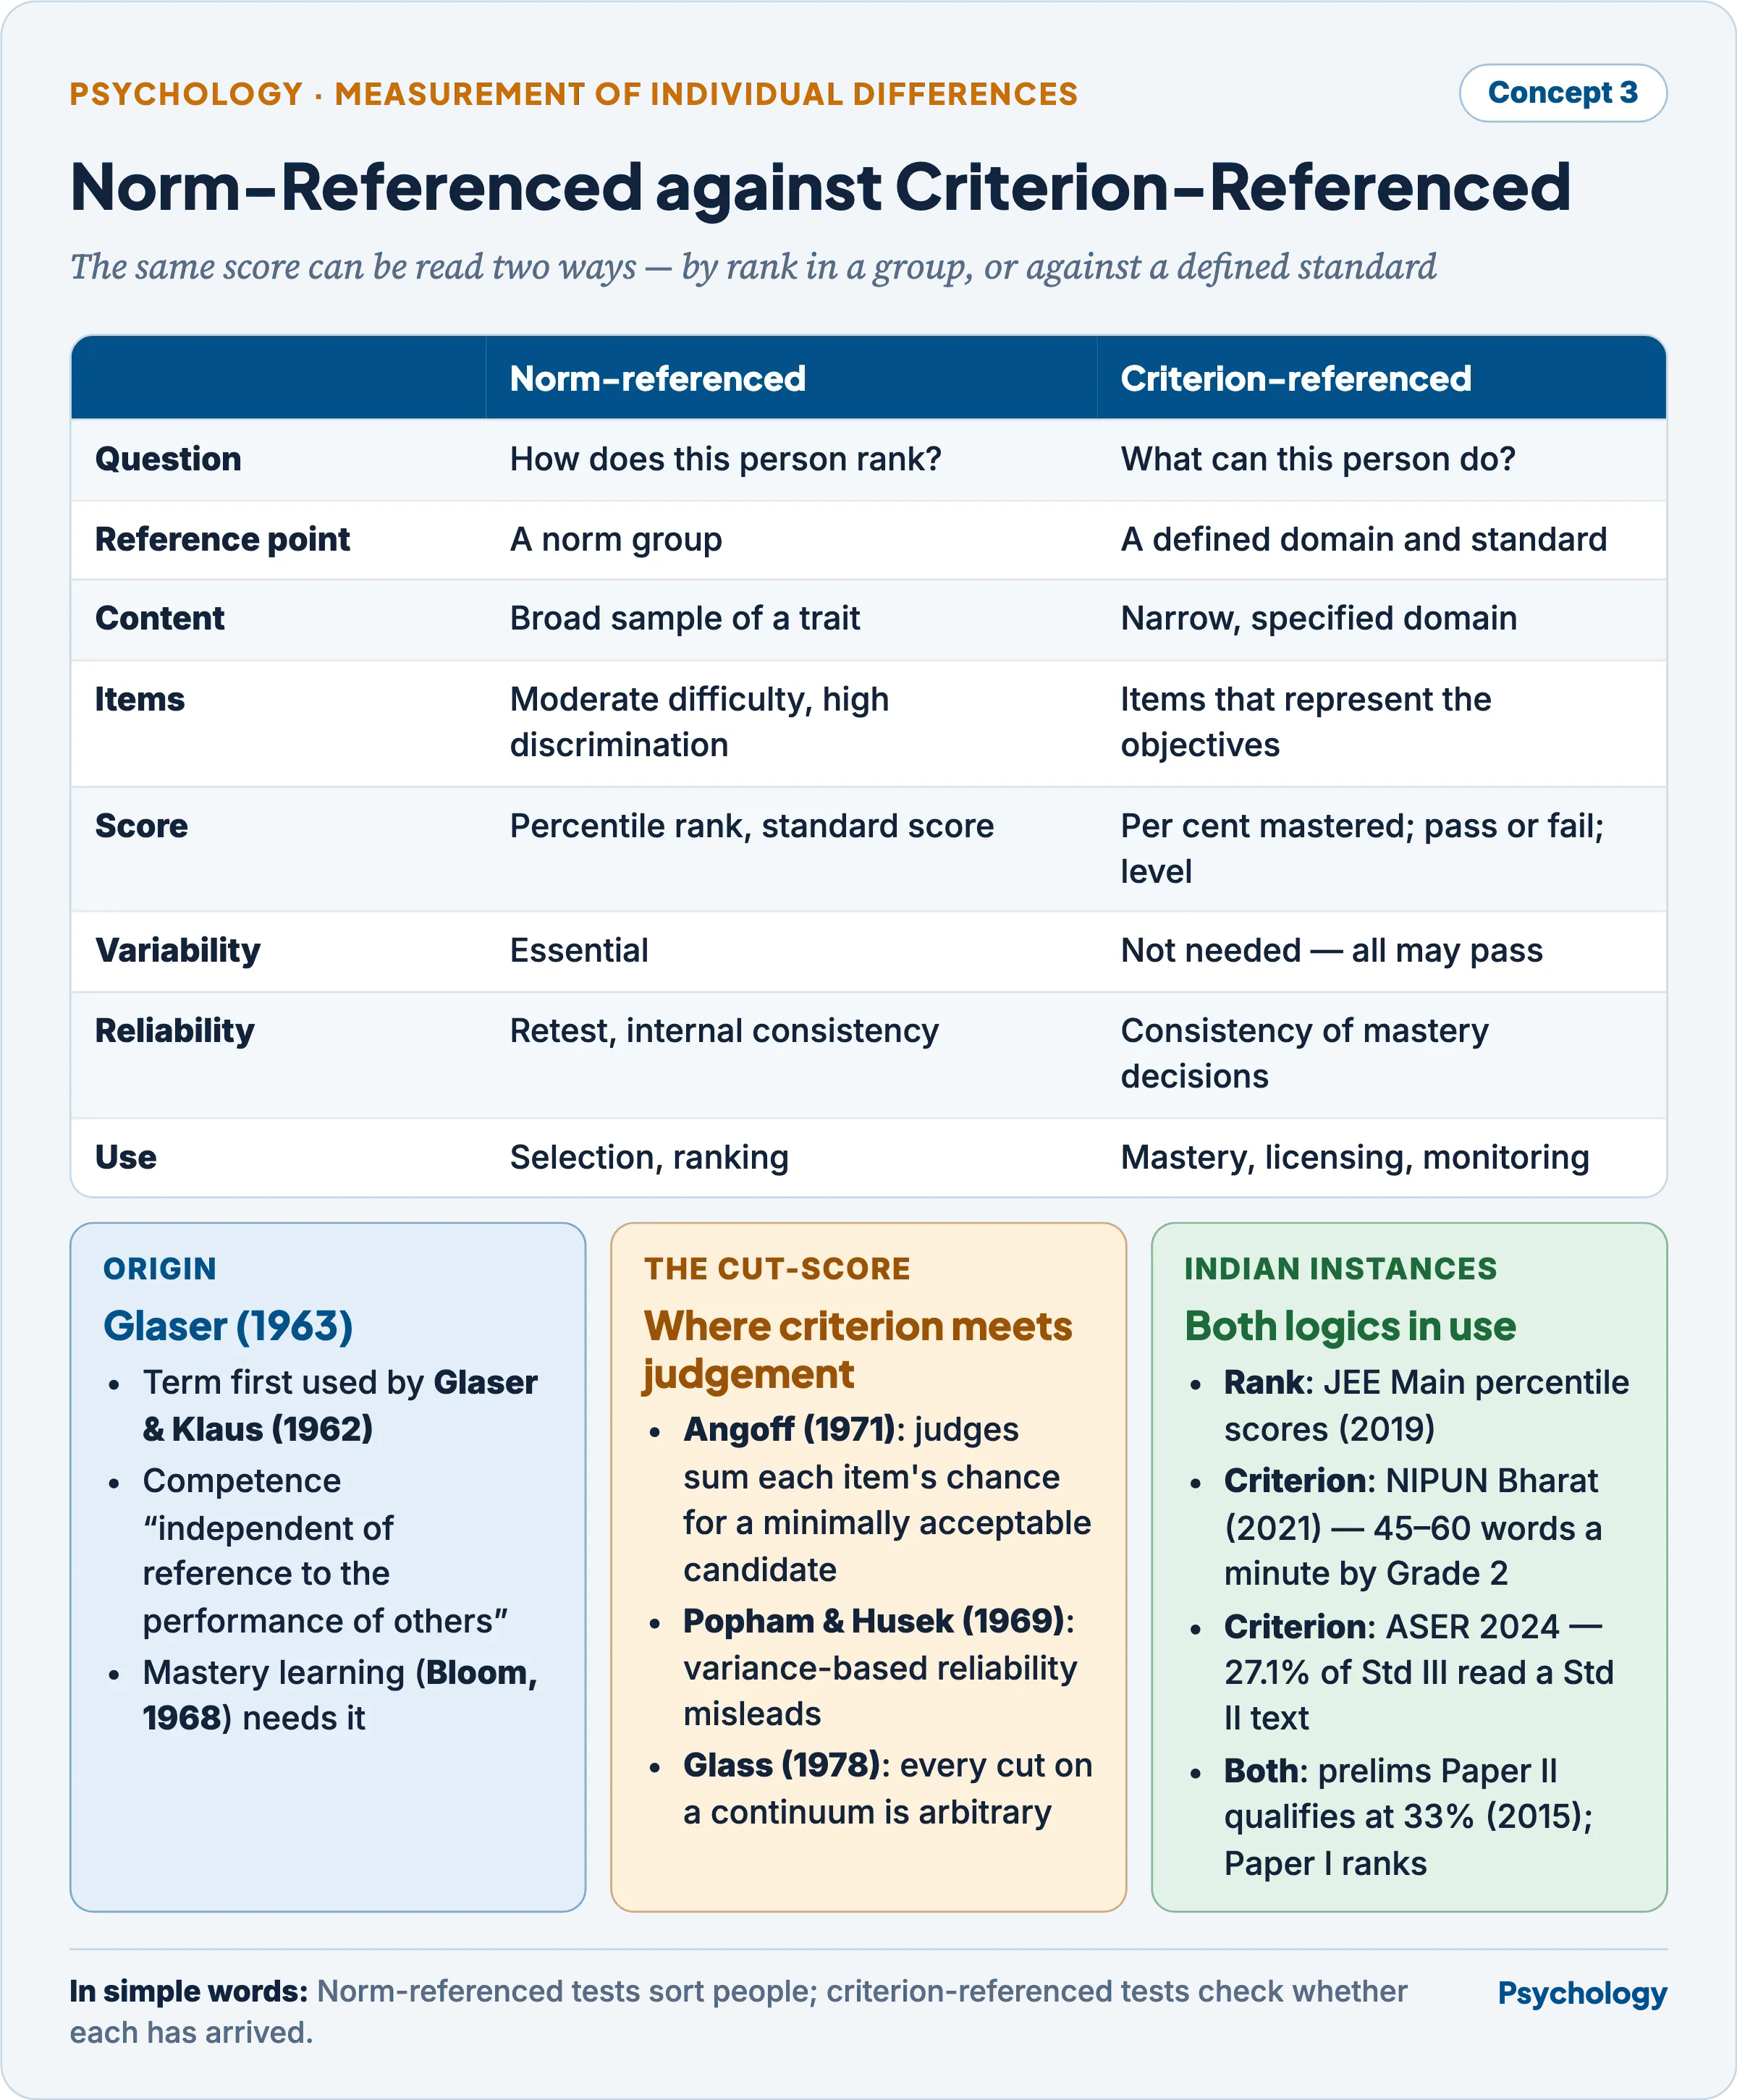
The two differ less in the test than in the question put to the score — rank, or mastery.
| Dimension | Norm-referenced | Criterion-referenced |
|---|---|---|
| Question | How does this person rank? | What can this person do? |
| Reference point | A norm group | A defined domain and standard |
| Content | Broad sample of a trait | Narrow, specified domain |
| Item selection | Moderate difficulty, high discrimination | Items representing the objectives |
| Score reported | Percentile rank, standard score | Per cent mastered; pass or fail; level |
| Variability | Essential | Not needed — all may pass |
| Reliability | Retest, internal consistency | Consistency of mastery decisions |
| Typical use | Selection, ranking | Mastery, licensing, monitoring |
- On reliability, Popham and Husek (1969) argued that a criterion-referenced test can be excellent with no variance if everyone has mastered the domain, so variance-based indices mislead; Livingston (1972) recentred reliability on the cut-score, and Hambleton and Novick (1973) on consistent mastery classification.
- In the method of Angoff (1971), judges estimate the probability that a minimally acceptable candidate answers each item correctly, and the sum is the cut-score; examinee-centred methods cut where known masters and non-masters separate. Standard 5.21 (2014) requires a documented rationale.
- Both need standardized administration, reliable scoring and valid content. Simon (1969) noted that the distinction describes the interpretation of scores, not the test: 70 per cent correct on an arithmetic domain is a mastery statement and, against a table, a percentile rank.
- One examination uses both logics. Since the Civil Services Examination Rules (2015), Preliminary Paper II qualifies at a fixed 33 per cent, a criterion, while merit turns on relative standing in Paper I; that history belongs to Validity of Psychological Tests.
- Against criterion-referencing, Glass (1978) argued that cut-scores are arbitrary because competence is a continuum, and different methods give different cuts; panels are often shown real candidates’ results, so norms re-enter the standard.
- Against norm-referencing, ranking is zero-sum — half the group is always below the median — and says nothing about what has been learnt.
Norm obsolescence and the Flynn effect
- Flynn (1984) showed each American standardization sample from 1932 to 1978 outscoring the last, a 13.8-point rise, so obsolete norms had confounded hundreds of studies; Flynn (1987) found gains of 5 to 25 points a generation across 14 nations.
- Pietschnig and Voracek (2015), pooling 271 samples of almost 4 million people from 31 countries, put the gain at 2.8 points a decade — 4.1 fluid, 2.1 crystallized — slowing recently.
- Bratsberg and Rogeberg (2018) found a Norwegian reversal after the 1975 birth cohort, present within families and so environmental.
- India’s norms age fast: of eight countries with enough Raven data, Brouwers, Van de Vijver and Van Hemert (2009) found the largest gains in India, Iran and Poland.
- Old norms change diagnoses.
- Kanaya, Scullin and Ceci (2003) traced nearly 9,000 special-education assessments in nine US school districts across the renorming of the Wechsler children’s scale.
- Kanaya and colleagues (2003) found pupils in the borderline and mild range lost 5.6 points on the new norms, and placement recommendations at IQ 66–70 tripled in its first five years against the equivalent band on the old norms. Limitation: archival, non-random retesting.
- Old norms also flatter: Cannell (1987) found all 32 statewide-testing US states above the “national norm” — the Lake Wobegon effect — from aged norms and teaching to unchanged items.
Criticisms and limitations of norm-referenced measurement
- Rank is not competence: it tells a teacher where a child stands, not what to teach next.
- Representativeness is approximated: refusals and school-only sampling bias norm groups towards the advantaged.
- Normalization imposes a shape the trait may not have.
- Norms do not travel and do decay: foreign or private-school norms misclassify (Vogelzang and colleagues, 2026), and the Flynn effect dates every table — the misuse side is in Use, Misuse and Limitations of Psychological Tests.
- Sample dependence: item response theory offers sample-free item parameters, though interpretation still needs a reference population — see Item Response Theory (Paper I).
Indian context
- National Testing Agency (Ministry of Education; Cabinet approval 10 November 2017) — since January 2019 converts each JEE Main shift’s raw scores to percentile scores, to seven decimals, with every shift’s topper at 100.
- Percentile score = 100 × candidates in the session scoring equal to or less than the candidate ÷ all candidates in the session.
- Principle: equipercentile linking under randomly equivalent groups — with random allotment to shifts, equal percentiles are treated as equal standing whatever a paper’s difficulty.
- Limitation: the procedure assumes random allotment to shifts (NTA, 2019), so a shift that was in fact abler would be penalized; and the score reports rank, not mastery.
- PARAKH — the national assessment centre set up in NCERT in February 2023 on NEP 2020’s recommendation; its Rashtriya Sarvekshan of 4 December 2024 tested about 21 lakh pupils of Grades 3, 6 and 9 in 781 districts in 23 media.
- It reports competencies: Grade 3 pupils answered 55 per cent of items on ordering numbers to 99 correctly; Grade 9 pupils, 28 per cent of items on applying percentages (PARAKH, 2025).
- Principle: criterion-referenced system monitoring, sample-based and ranking no child, though its reports place districts on a percentile scale (PARAKH, 2025).
- NIPUN Bharat (Ministry of Education, 5 July 2021, under Samagra Shiksha) — foundational literacy and numeracy by Grade 3 by 2026–27, set as a Lakshya Soochi: oral reading of 45–60 words a minute by Grade 2 and 60 by Grade 3.
- Principle: mastery benchmarks every child can meet, as no percentile can.
- ASER 2024, a rural household survey of 649,491 children, found 27.1 per cent of Std III pupils able to read a Std II text (ASER, 2024) — a fixed task, not a rank.
- Language binds national norms: 96.71 per cent of Indians have a scheduled language as mother tongue (Census, 2011), so a national test needs twenty-two equivalent versions, each normed or linked.
Previous Year Questions
- 2026Compare and contrast Norm referenced vs criterion referenced measurement.
- 2024Why are norms needed for psychological tests? Explain the uses and limitations of percentile ranks in this context.
- 2014What different types of norms will a psychologist need to develop a test of general mental ability for use in India?