

- Literacy is the ability to read and write with understanding. Educational attainment is the level of schooling a person has completed. Literacy is the threshold; attainment measures how far beyond it a population has gone.
- Both are core qualitative demographic attributes. They shape fertility, mortality, migration, work and the status of women, and they are one of the three dimensions of the Human Development Index.
- Their geography is one of the clearest maps of inequality: between rich and poor countries, men and women, towns and villages, and social groups.
Concept

Definitions
- UNESCO (1958): a person is literate who can, with understanding, both read and write a short, simple statement about everyday life.
- Functional literacy (UNESCO, 1978) goes further: the reading, writing and numeracy a person needs to function in the community, at work and in civic life.
- Current usage adds digital and financial literacy.
- The UN’s SDG target 4.6 aims at youth and adult literacy and numeracy for all by 2030.
- Census of India: a person aged 7 and above who can both read and write with understanding in any language is literate.
- A person who can only read is not literate.
- No formal schooling or minimum standard is required.
- Before 1991, all children under 5 were treated as illiterate. Since 1991, the age 0–6 group is excluded from the base.
- Educational attainment: the highest level of education completed (primary, middle, secondary, higher secondary, diploma, graduate, postgraduate). It is a measure of the stock of human capital.
Measures
| Measure | Definition | India |
|---|---|---|
| Crude literacy rate | Literates ÷ total population × 100 | 63.1% (2011) |
| Effective literacy rate | Literates aged 7+ ÷ population aged 7+ × 100 | 73.0% (2011); 81.1% (PLFS 2025) |
| Adult literacy rate | Literates aged 15+ ÷ population 15+ × 100 | 81% (UNESCO, 2024) |
| Youth literacy rate | Literates aged 15–24 ÷ population 15–24 × 100 | Used for SDG 4.6 |
| Gender gap | Male rate − female rate (percentage points) | 16.3 (2011); 12.6 (2025) |
| Mean years of schooling | Average years completed by adults 25+ | 6.9 (2023) |
| Gross enrolment ratio | Enrolment ÷ population of the official age group × 100 | Higher education 28.4% (2021–22) |
- Sopher’s disparity index (David E. Sopher, 1974) measures the gap between two groups, such as men and women or urban and rural:
- DI = log (X2 ÷ X1) + log [(100 − X1) ÷ (100 − X2)], where X2 is the higher rate (for example, male literacy) and X1 the lower.
- It is 0 when there is no disparity, and it weighs a gap more heavily at high levels of literacy than a simple difference does.
- A widely used modified form replaces 100 by 200 in the second term, so that the index stays finite as X2 approaches 100.
Sources of Literacy Data
- Census: literacy by age, sex, residence and social group down to the village (last held in 2011).
- The next census has its population reference date on 1 March 2027.
- National Sample Survey and PLFS: the NSS 75th round (2017–18) recorded 77.7% literacy. The PLFS now gives annual literacy and education levels by State.
- NFHS: the schooling of women and men aged 15–49, and the share of girls who ever attended school.
- UDISE+ (school enrolment), AISHE (higher education) and ASER (an independent survey of children’s actual reading and arithmetic).
- International: the UNESCO Institute for Statistics compiles national literacy data. The UNDP Human Development Report gives mean and expected years of schooling.
Significance
- Literacy is both a cause and a consequence of development:
- Fertility falls as women’s schooling rises: educated women marry later, use contraception and want fewer children.
- Mortality falls through better hygiene, nutrition and use of health services, especially infant mortality.
- Migration and occupation: educated people move further and shift to secondary and tertiary work.
- Participation in democracy, markets and digital life depends on it.
- Kerala is the classic case. Near-universal female literacy came before high income, and brought India’s lowest infant mortality and early fertility decline.
Determinants of Literacy
Historical and Political
- Early mass schooling (Prussia, Scandinavia, Scotland, New England, Japan after 1872) produced near-universal literacy by about 1900. Protestant emphasis on reading scripture helped.
- Colonial rule limited education to a small elite. In 1951 India’s literacy was only 18.3%.
- Princely and missionary legacies explain old contrasts in India. The rulers of Travancore and Cochin promoted schooling in the 19th century, and missionaries spread literacy in Kerala and the north-east.
- State commitment: free and compulsory schooling, school meals and adult literacy campaigns produce rapid gains. Examples are Cuba, China, Sri Lanka, Kerala and Himachal Pradesh.
Economic
- Income and poverty: poor households need children’s labour and cannot pay for schooling. Literacy rises with income per head.
- Type of economy: subsistence agriculture demands little literacy. Industrial and service economies demand it, and pay a return on it.
Urbanisation and Accessibility
- Towns concentrate schools, colleges, transport and jobs that reward education. Urban literacy in India was 84.1% in 2011, against 67.8% in rural areas.
- Physical factors: rugged terrain, dispersed settlement, forests and floods make schools hard to reach. Examples are the tribal belts of central India, desert Rajasthan and parts of the north-east.
Social and Cultural
- Gender norms: early marriage, seclusion, son preference and housework keep girls out of school.
- Women are two-thirds of the world’s illiterates. In India the gap is widest in Rajasthan, Jharkhand and Uttar Pradesh.
- Caste and tribe: historical exclusion of Scheduled Castes, and the isolation and language barriers of Scheduled Tribes. In 2011, SC literacy was 66.1% and ST literacy 59.0%, against the national 73.0%.
- Religion and community: differences between communities follow their occupational structure, urbanisation and institutions. Christian missions and reform movements raised literacy; groups concentrated in poor rural areas lag.
- Language: teaching in a language other than the mother tongue raises drop-out, especially among tribal children.
Demographic
- High fertility spreads household resources thinly. Child labour and early marriage cut schooling short.
- Migration: seasonal migrant families (brick kilns, sugarcane cutting) pull children out of school.
World Pattern
Literacy
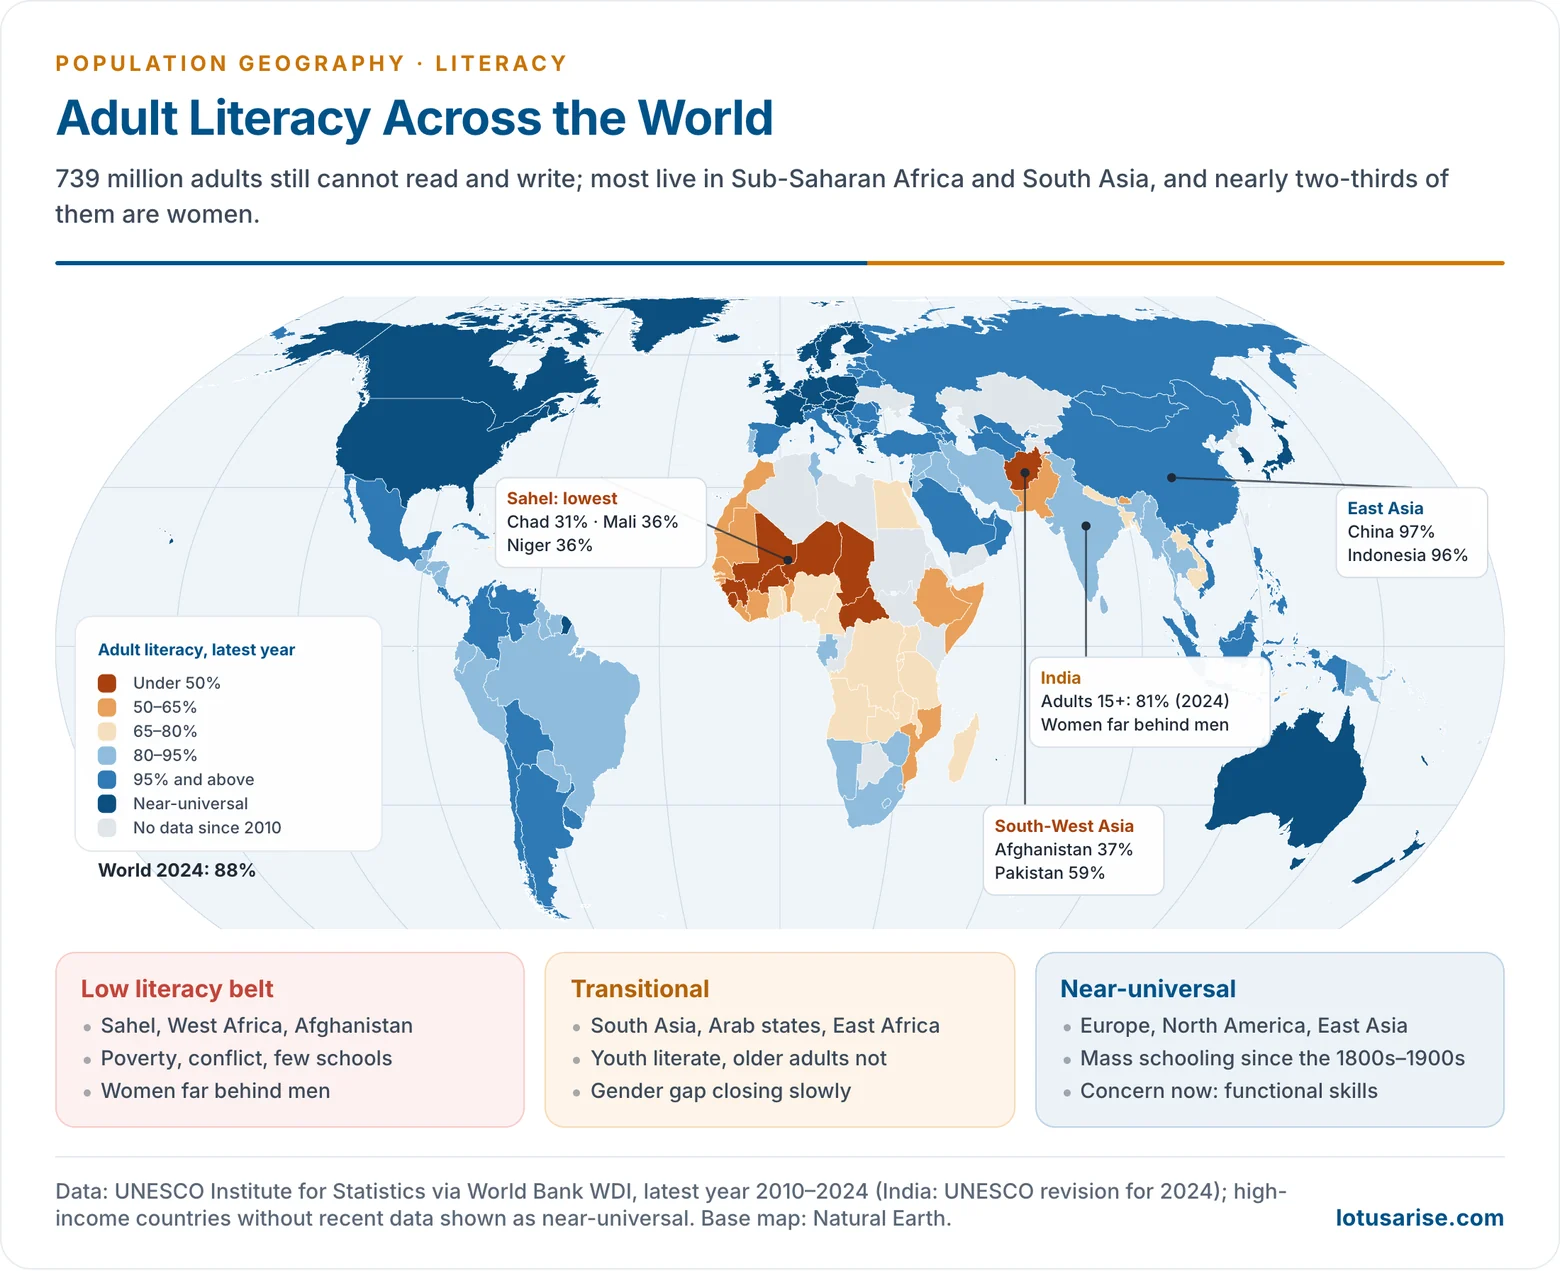
- In 2024, 88% of the world’s adults were literate, up from about 45% at the end of the Second World War. Youth literacy reached 93%.
- Yet 739 million adults still lack basic literacy (UNESCO Institute for Statistics, 2025):
- Nearly two-thirds (466 million) are women.
- About 77% live in Central and Southern Asia (347 million) and Sub-Saharan Africa (225 million).
- In Sub-Saharan Africa the literacy rate rose from 65% to 69% after 2015, but the number of illiterates grew from 196 to 225 million, because of population growth.
- 272 million children and youth were out of school in 2023. One in three school-age children in low-income countries is out of school.
- Regional pattern (adult literacy, latest data):
- Near-universal: Europe, North America, Japan, Australia, Russia and Central Asia. East Asia (China 97%, Indonesia 96%) and most of Latin America are above 90%.
- Middle: South Asia (India 81%, Bangladesh 79%, Nepal 69%), the Arab states (Egypt 80%) and East and Southern Africa.
- Lowest: the Sahel and West Africa (Chad 31%, Mali and Niger 36%, Guinea 40%), Afghanistan (37%), South Sudan and Pakistan (59%).
- Literacy transition: literacy spreads, like the demographic transition, through stages:
- Completed (near-universal; developed countries).
- Transitional (rapid gains, a closing gender gap; India, much of Asia and North Africa).
- Initial (mass illiteracy; the Sahel and Afghanistan).
Educational Attainment
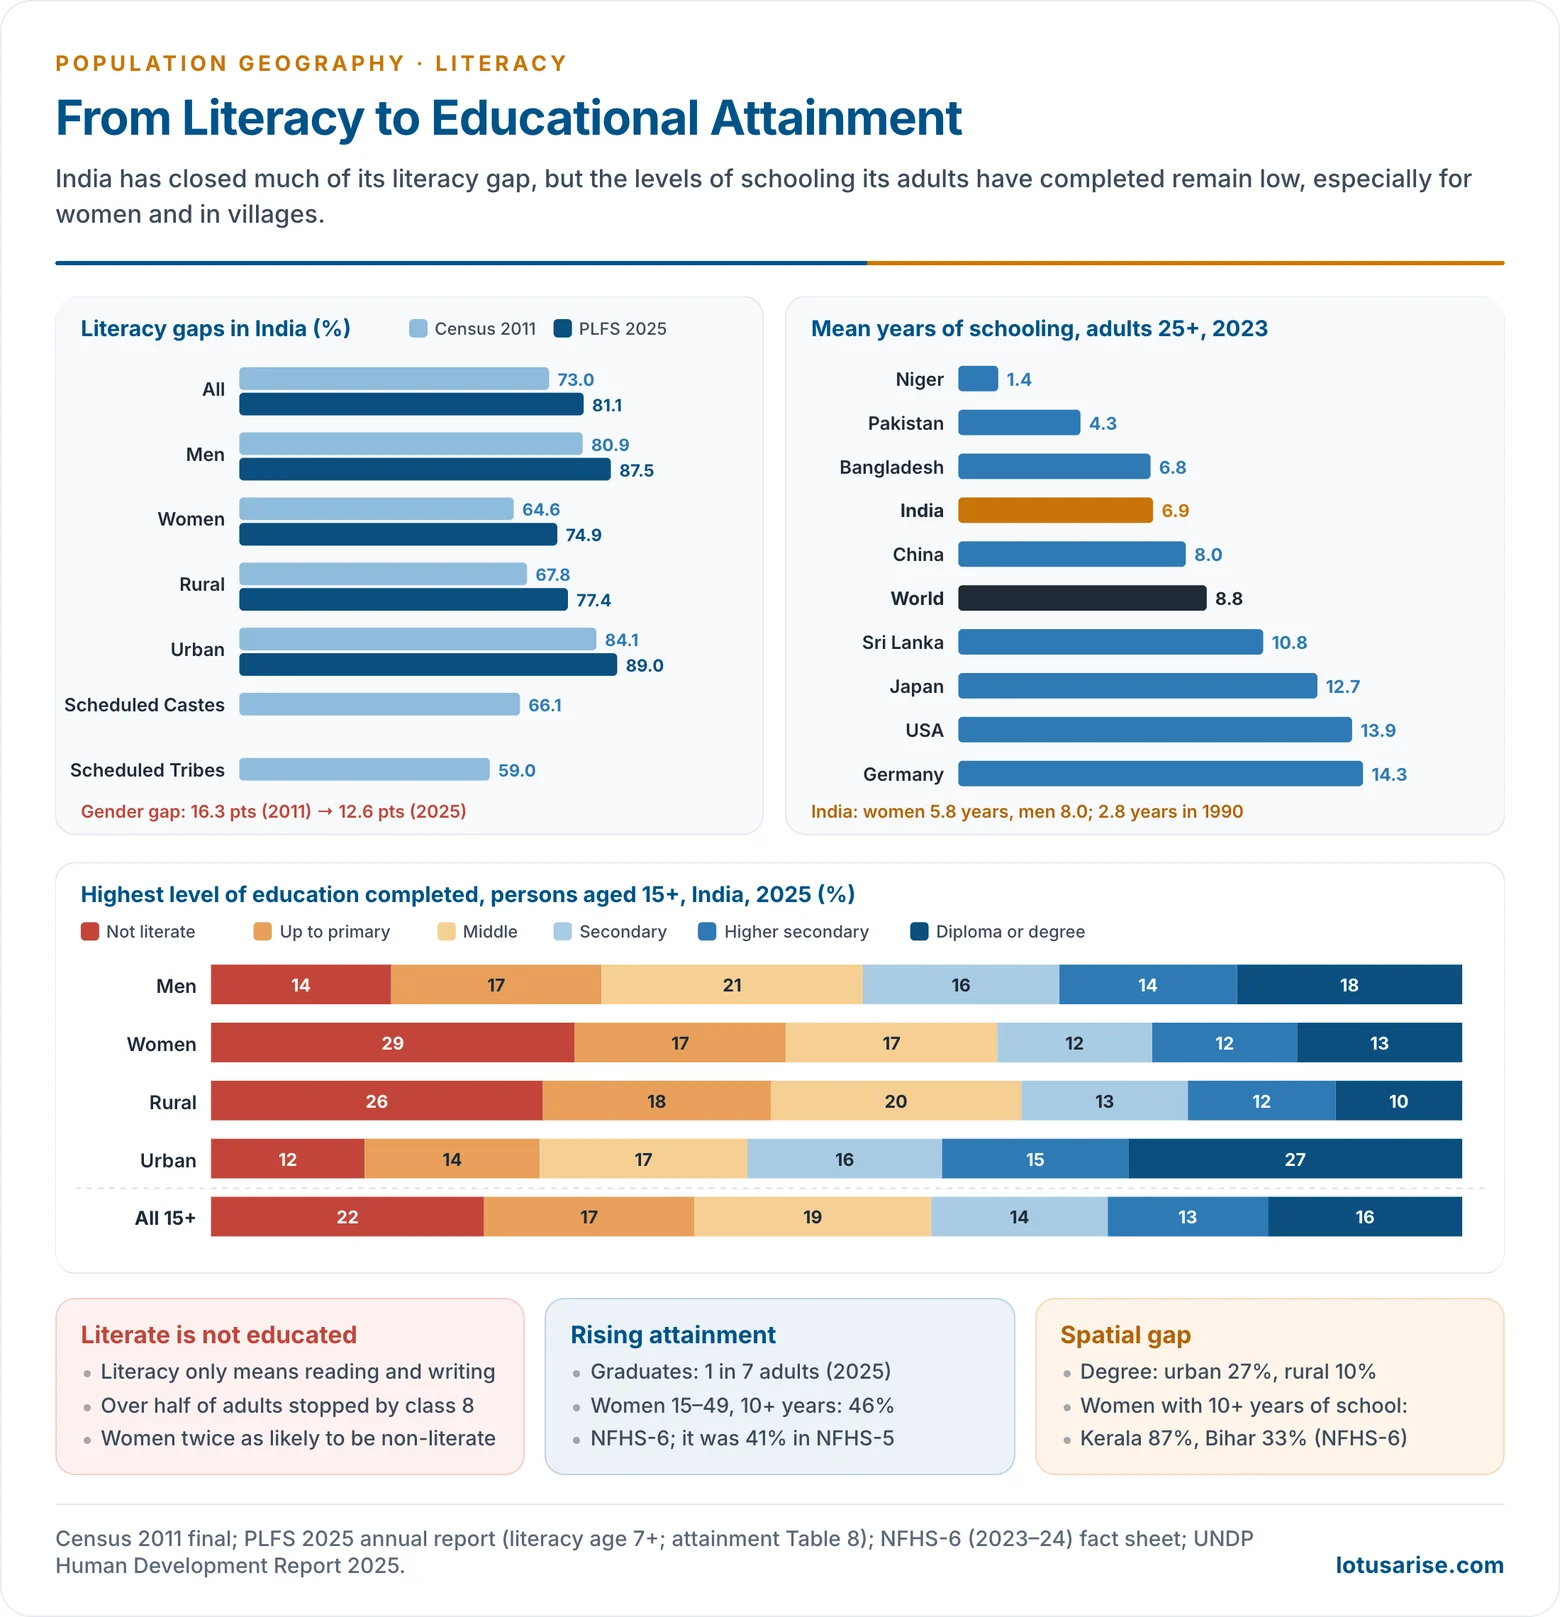
- Mean years of schooling of adults (UNDP Human Development Report 2025, for 2023):
- World 8.8.
- Germany 14.3, the USA 13.9, Japan 12.7, Sri Lanka 10.8 and China 8.0.
- India 6.9, Bangladesh 6.8 and Pakistan 4.3.
- Niger 1.4 and Chad 2.3.
- The gap in attainment is wider than the gap in literacy. A country can approach universal literacy while most adults still leave school before secondary level.
- Quality is the new frontier. Many children in school fail to reach basic reading levels: the World Bank calls this “learning poverty“.
Literacy in India
Trend
| Census | Persons | Males | Females | Gender gap |
|---|---|---|---|---|
| 1951 | 18.3 | 27.2 | 8.9 | 18.3 |
| 1961 | 28.3 | 40.4 | 15.4 | 25.1 |
| 1971 | 34.5 | 46.0 | 22.0 | 24.0 |
| 1981 | 43.6 | 56.4 | 29.8 | 26.6 |
| 1991 | 52.2 | 64.1 | 39.3 | 24.8 |
| 2001 | 64.8 | 75.3 | 53.7 | 21.6 |
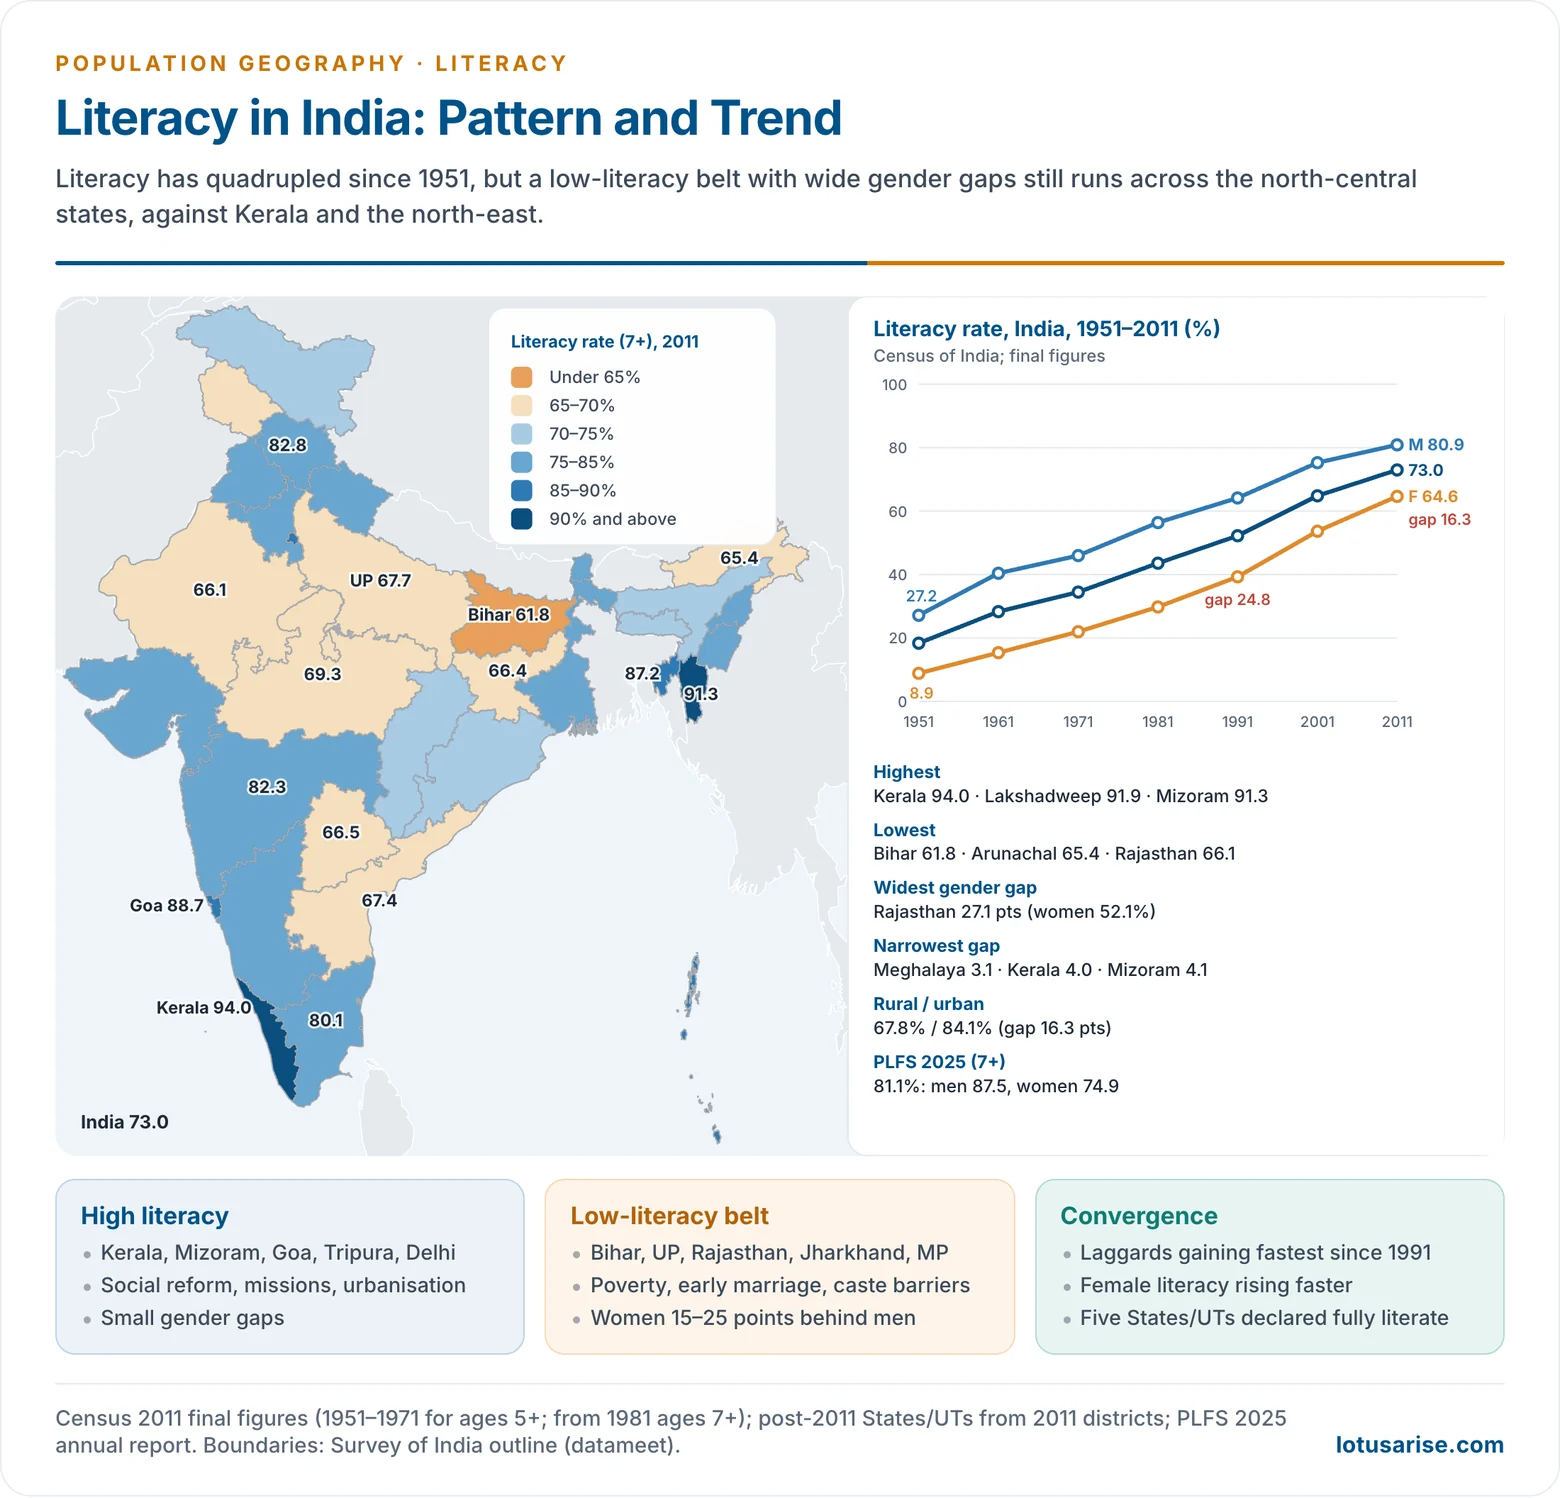
| 2011 | 73.0 | 80.9 | 64.6 | 16.3 |
- Literacy has quadrupled since independence. Rates for 1951–1971 are for ages 5+; from 1981 they are for ages 7+.
- The gender gap widened until 1981. It has narrowed steadily since, as female literacy rose faster (by 10.9 points in 2001–2011, against 5.6 for males).
- In 2001–2011 more women than men became literate, and the absolute number of illiterates fell by about 31 million.
- The provisional 2011 rate was 74.04%. The final rate, from the Primary Census Abstract, is 72.98% (males 80.88%, females 64.63%).
- Recent surveys:
- PLFS 2025: literacy (age 7+) 81.1%. Men 87.5%, women 74.9%; rural 77.4%, urban 89.0%. The gender gap has narrowed to 12.6 points.
- NFHS-6 (2023–24): 73.7% of females aged 6+ had ever attended school (71.8% in NFHS-5).
Spatial Pattern (Census 2011)
- High literacy (above 85%): Kerala (94.0%), Lakshadweep (91.9%), Mizoram (91.3%), Goa (88.7%), Tripura (87.2%), Andaman and Nicobar, Delhi and Chandigarh.
- These areas have social reform traditions (the Kerala model), Christian missions (Mizoram, Kerala, Goa), urbanisation and small gender gaps.
- Above average (75–85%): Himachal Pradesh (82.8%), Maharashtra, Tamil Nadu, Uttarakhand, Gujarat, West Bengal, Punjab, Haryana, Karnataka, Nagaland and Manipur.
- Himachal Pradesh is the success story of the hills. State investment in schools in every village took it from among the lowest to among the highest.
- Below average (65–73%): Uttar Pradesh, undivided Andhra Pradesh (including Telangana), Jammu and Kashmir, Jharkhand, Rajasthan, Madhya Pradesh, Chhattisgarh, Assam, Odisha, Meghalaya and Arunachal Pradesh (65.4%).
- Lowest: Bihar (61.8%).
- Regional pattern:
- The north-central “low-literacy belt” (Bihar, Uttar Pradesh, Jharkhand, Madhya Pradesh, Rajasthan) is contiguous. It combines poverty, high fertility, rigid caste and gender norms and weak schooling.
- The south and west are higher, through early reform, better governance and urbanisation.
- The north-east is mixed. Mizoram, Tripura, Nagaland and Manipur are high through mission schools and community effort; Arunachal Pradesh and Meghalaya are lower because of terrain and dispersed settlement.
- Interior tribal districts (southern Odisha, Bastar, Jhabua, the Narmada valley) are the darkest pockets: Alirajpur in Madhya Pradesh had 36% literacy in 2011.
Gender, Rural–Urban and Social Gaps
- Gender: the male–female gap was 16.3 points in 2011.
- Widest: Rajasthan (27.1 points; female literacy only 52.1%), Jharkhand, Jammu and Kashmir, Uttar Pradesh, Chhattisgarh, Bihar.
- Narrowest: Meghalaya (3.1), Kerala (4.0) and Mizoram (4.1), where women have high status in matrilineal or reformed societies.
- Low literacy and a wide gender gap go together. Raising female literacy is the key to raising overall literacy.
- Rural–urban: 67.8% against 84.1% in 2011, a gap of 16.3 points. It has narrowed with every census.
- Social groups: SC 66.1% and ST 59.0% (2011). Among STs, female literacy was below 50%.
- Convergence: the laggard states (Bihar, Rajasthan, Uttar Pradesh, Jharkhand) have gained fastest since 1991.
- Bihar rose by 14.8 points in 2001–2011, and Dadra and Nagar Haveli by 18.6.
Recent Spatial Pattern (PLFS 2025)
- Highest: Mizoram (99.8%), Kerala (95.6%), Puducherry, Lakshadweep, Goa and Manipur (all above 92%).
- Lowest: Andhra Pradesh (71.4%), Bihar (73.1%), Rajasthan (74.0%) and Telangana (74.6%).
- The south-eastern pocket of Andhra Pradesh and Telangana now joins the northern belt at the bottom, largely because of low female and rural literacy (rural Andhra women 58.9%).
- Full literacy: under ULLAS – Nav Bharat Saaksharta Karyakram (2022–27), a State/UT counts as fully literate at 95% literacy among those aged 15+.
- Ladakh (2024) was the first, followed by Mizoram (May 2025, the first state), Goa, Tripura and Himachal Pradesh (September 2025).
- Kerala had already declared “total literacy” in 1991, under the National Literacy Mission’s norms.
Educational Attainment in India
- Highest level completed, persons aged 15+ (PLFS 2025):
- Not literate 21.8%; literate up to primary 16.8%; middle 18.9%.
- Secondary 14.1%; higher secondary 12.8%.
- Diploma or degree 15.5% (graduates 10.8%, postgraduates 3.3%).
- Over half of Indian adults have not studied beyond class 8.
- Gender: 29.1% of women aged 15+ are not literate, against 14.4% of men. 13.2% of women have a diploma or degree, against 18.0% of men.
- Rural–urban: 10% of rural adults have a diploma or degree, against 27% of urban adults.
- NFHS-6 (2023–24): 46.4% of women and 54.6% of men aged 15–49 had 10 or more years of schooling, up from 41.0% and 50.2% in NFHS-5.
- The range runs from Kerala (86.6% of women) to Bihar (33.1%), Madhya Pradesh and Tripura.
- Mean years of schooling: 6.9 in 2023 (women 5.8, men 8.0), up from 2.8 in 1990 (UNDP).
- Higher education: the gross enrolment ratio (18–23 years) was 28.4% in 2021–22 (AISHE). The National Education Policy 2020 targets 50% by 2035.
- Quality gap: surveys of children’s learning (ASER) show that many children in class 5 cannot read a class 2 text. Enrolment has outpaced learning.
Policies and Programmes in India
- Constitutional:
- Article 45 (originally a Directive Principle for free and compulsory education).
- The 86th Amendment (2002) made education for ages 6–14 a fundamental right (Article 21A). The Right of Children to Free and Compulsory Education Act, 2009 came into force in 2010.
- Adult literacy:
- National Literacy Mission (1988) and its Total Literacy Campaigns. Ernakulam became the first fully literate district in 1990.
- Saakshar Bharat (2009), focused on women.
- ULLAS – Nav Bharat Saaksharta Karyakram (2022–27), for non-literates aged 15+, run through volunteers and a mobile app.
- Schooling:
- Sarva Shiksha Abhiyan (2001), merged into Samagra Shiksha (2018).
- The mid-day meal (1995), now PM POSHAN (2021).
- Kasturba Gandhi Balika Vidyalayas for girls from disadvantaged groups.
- NIPUN Bharat (2021) for foundational literacy and numeracy by class 3.
- Girls: Beti Bachao Beti Padhao (2015), scholarships and bicycles for girls (Bihar’s scheme raised girls’ secondary enrolment).
- National Education Policy 2020: universal foundational literacy, schooling in the mother tongue in the early years, and a 50% higher-education enrolment target.
Remaining Challenges
- The low-literacy belt and tribal and remote districts.
- The gender gap among older women.
- Drop-out after the elementary stage.
- Poor learning quality.
- The digital divide: in NFHS-6, 64% of women aged 15–49 had ever used the internet, against 81% of men.
Previous Year Questions
1990Analyse the causes of the low literacy rate of India. Suggest feasible measures for raising the literacy level.1993Analyse the changes in the literacy rate during the post-independence period in India.2008Describe & explain the spatial patterns of literacy in India.2012Write about Geographical reasons for the variation in literacy from state to state in India.




