

- Human development is the process of enlarging people’s choices: to live a long and healthy life, to be educated and to enjoy a decent standard of living, along with political freedom, human rights and self-respect.
- It treats economic growth and income as means, not as the end of development.
- The Human Development Index (HDI) is the summary measure of that idea, published since 1990 by the United Nations Development Programme (UNDP) in its annual Human Development Report (HDR).
- For geography, the HDI is a tool for mapping who is better off, where, and why. It shows the uneven spread of well-being between continents, countries, Indian states and districts.
The Human Development Approach

From Growth to Human Development
- For decades, a country’s welfare was measured by economic growth or a rise in per capita GDP. The measure was simple, but rising income often failed to improve the lives of large sections of the people.
- Growth could coexist with illiteracy, ill-health and exclusion. A broader measure was needed.
- The approach took shape in the late 1980s on foundations laid by Mahbub ul Haq, the Pakistani economist who led the first HDR (1990), and Amartya Sen.
- The 1990 report called for an approach covering all aspects of human life, for all people, in rich and poor countries alike, now and in the future.
- Core idea: the purpose of development is to widen what people can be and do: be healthy and well nourished, be knowledgeable, and take part in community life.
- Development, in this view, is the removal of obstacles such as low income, illiteracy, ill-health, lack of access to resources and lack of civil and political freedoms.
Capabilities, Functionings and Freedom
- Amartya Sen’s capability approach is the theoretical base of the HDI.
- Functionings are the things a person actually achieves, such as being nourished or literate.
- Capabilities are the real freedoms to achieve them. Development is the expansion of these freedoms (Development as Freedom, 1999).
- Martha Nussbaum extended the approach with a list of central human capabilities, applying it especially to women’s lives.
- The HDI captures only three basic capabilities. It is deliberately simple, a headline measure rather than a complete account of human development.
Human Development and Planning in India
- The ethos of Indian planning was always people-centric. The human development paradigm made that focus explicit within the growth process.
- As the economy opened up in the 1990s, it kept attention on people who might be left out of market-led growth.
- It also helps people hold governments to account and pushes governments to respond to their needs.
- State-level analysis matters most in India, because the states carry the main responsibility for the social sectors (health, education, nutrition) and differ widely in outcomes.
- Madhya Pradesh prepared India’s first State Human Development Report (1995). The Planning Commission released the National Human Development Report 2001, and most states have since produced their own reports, setting a benchmark and a follow-up for social welfare.
Measuring Human Development: the HDI
Dimensions and Indicators
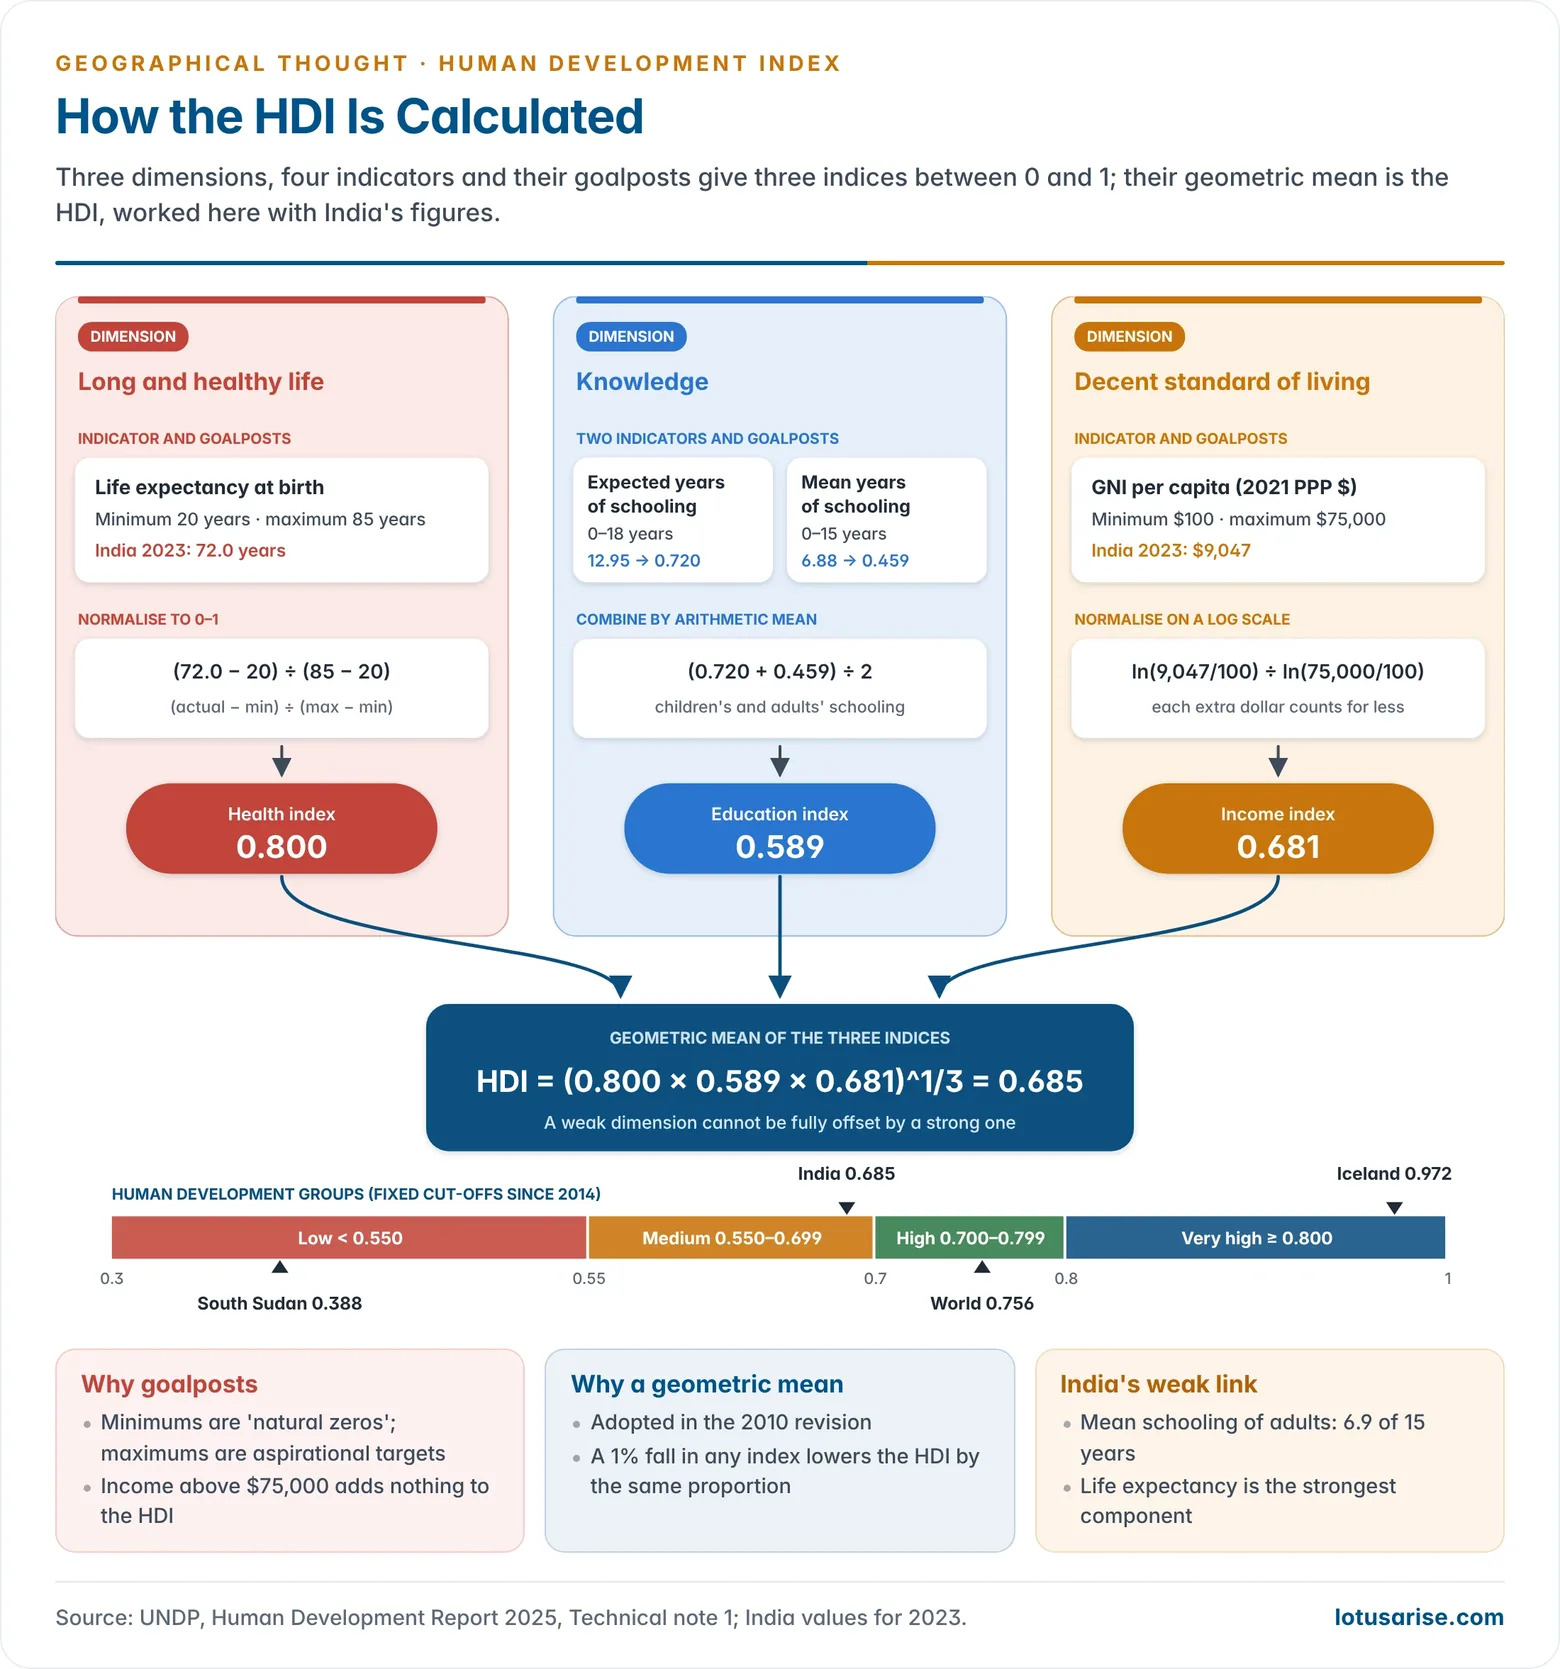
- The HDI is a summary measure of average achievement in three dimensions, each measured by one or two indicators.
| Dimension | Indicator | Minimum | Maximum |
|---|---|---|---|
| Long and healthy life | Life expectancy at birth | 20 years | 85 years |
| Knowledge | Expected years of schooling (children of school-entry age) | 0 | 18 years |
| Knowledge | Mean years of schooling (adults aged 25+) | 0 | 15 years |
| Decent standard of living | GNI per capita (2021 PPP $) | 100 | 75,000 |
- Goalposts are the minimum and maximum values. They act as “natural zeros” and “aspirational targets”.
- No country in the 20th century had a life expectancy below 20 years. 18 years of expected schooling is about a master’s degree. 15 years is the projected maximum of mean schooling for 2025.
- Income above $75,000 adds nothing to the HDI. Nine countries, including Norway, Switzerland, Ireland and Qatar, exceeded that ceiling in 2023.
- Data sources: UN population estimates for life expectancy, the UNESCO Institute for Statistics and household surveys for schooling, and the World Bank and IMF for income.
Calculation in Two Steps
- Dimension indices: each indicator is converted to a 0–1 scale.
- Index = (actual value − minimum) ÷ (maximum − minimum).
- The two schooling indices are combined by an arithmetic mean into the education index, so they can substitute for each other fully.
- Income uses the natural logarithm of the values, because each extra dollar adds less to capabilities as income rises (diminishing returns).
- Aggregation: the HDI is the geometric mean of the three indices: HDI = (health × education × income)^1/3.
- The geometric mean allows only imperfect substitution. Poor performance in one dimension cannot be fully offset by high scores in another, and a 1% fall in any index lowers the HDI equally.
Worked Example: India (HDR 2025, data for 2023)
- Health index: life expectancy 72.0 years → (72.0 − 20) ÷ 65 = 0.800.
- Education index: expected schooling 12.95 years → 0.720; mean schooling 6.88 years → 0.459; average = 0.589.
- Income index: GNI per capita $9,047 (2021 PPP) → [ln 9,047 − ln 100] ÷ [ln 75,000 − ln 100] = 0.681.
- HDI = (0.800 × 0.589 × 0.681)^1/3 = 0.685.
- The weakest link is mean years of schooling, the legacy of low adult education. This is why India’s HDI lags its life expectancy.
How the Method Has Changed
- 1990: life expectancy, adult literacy (later with gross enrolment) and log GDP per capita, combined by an arithmetic mean.
- 2010 revision: mean and expected years of schooling replaced literacy and enrolment, GNI replaced GDP, and the geometric mean replaced the arithmetic mean.
- 2014: fixed cut-off points were introduced for the four human development groups.
- HDR 2025: income is expressed in 2021 PPP dollars.
- Because data and methods are revised, ranks are not comparable across reports. Each report back-calculates a consistent series for every year.
Human Development Groups
| Group | HDI cut-off | Countries (HDR 2025) | Group HDI | Life expectancy | GNI per capita (2021 PPP $) |
|---|---|---|---|---|---|
| Very high | 0.800 and above | 74 | 0.914 | 80.0 | 53,014 |
| High | 0.700–0.799 | 50 | 0.777 | 75.7 | 18,405 |
| Medium | 0.550–0.699 | 43 | 0.656 | 69.3 | 7,822 |
| Low | below 0.550 | 26 | 0.515 | 65.0 | 3,007 |
- India is in the medium group (0.685), just below the 0.700 threshold of high human development.
The HDI Family of Indices
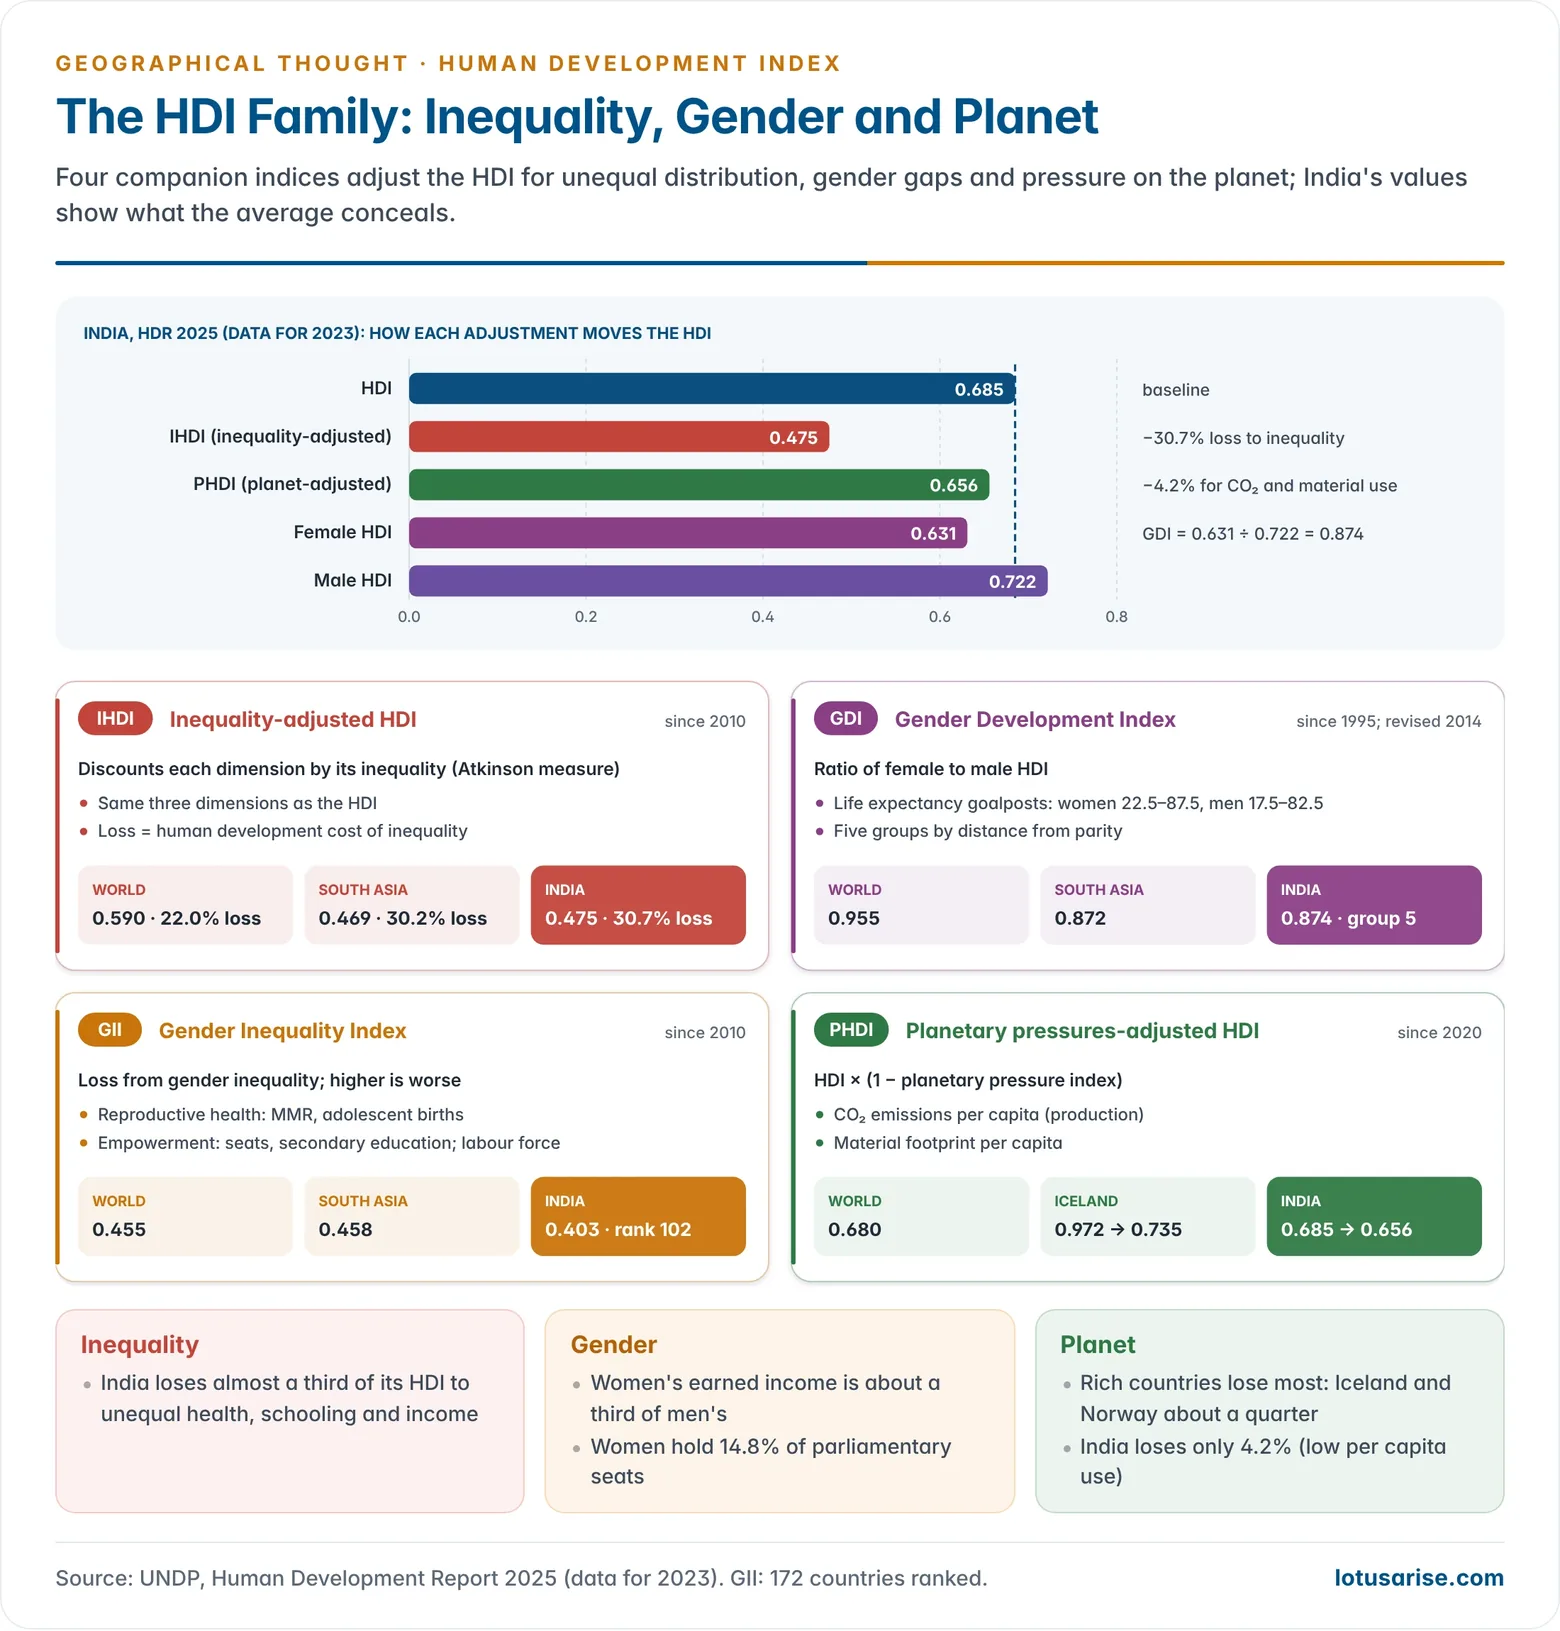
- Since 1995, and mainly since 2010, the HDR has added indices that look at inequality, gender, poverty and planetary pressure.
| Index | Since | What it measures | India (HDR 2025) |
|---|---|---|---|
| IHDI | 2010 | HDI discounted for inequality | 0.475 (30.7% loss) |
| GDI | 1995, revised 2014 | Female HDI ÷ male HDI | 0.874 (group 5) |
| GII | 2010 | Loss from gender inequality | 0.403 (rank 102) |
| MPI | 2010 | Overlapping household deprivations | 0.069 (16.4% poor, 2019–21) |
| PHDI | 2020 | HDI adjusted for CO₂ and material use | 0.656 (4.2% lower) |
Inequality-adjusted HDI (IHDI)
- The IHDI takes account of how achievements are distributed among people, not just their average.
- Each dimension’s average is discounted by its level of inequality, using the Atkinson (1970) family of measures.
- It is the distribution-sensitive level of human development.
- Under perfect equality, IHDI = HDI. It falls below the HDI as inequality rises.
- Two countries with the same HDI can have very different IHDIs.
- The gap between them is the human development cost of inequality, or the overall loss.
- World: 22.0% loss. South Asia: 30.2%. Sub-Saharan Africa: 33.6%. Very high HDI countries: 10.2%.
- India: IHDI 0.475, a 30.7% loss, one of the highest in the region.
- Because the loss can be broken down by dimension, the IHDI points policy to where inequality reduction is most needed.
Gender Development Index (GDI)
- The GDI measures gender gaps in HDI achievements. It is the ratio of the female HDI to the male HDI, calculated with the same indicators:
- Health: female and male life expectancy at birth.
- Education: female and male expected and mean years of schooling.
- Living standard: female and male estimated earned income.
- The goalposts are the same except for life expectancy: 22.5–87.5 years for women and 17.5–82.5 years for men. This allows for the average five-year biological advantage of women.
- Countries are placed in five groups by their distance from parity. Group 1 is within 2.5%, and group 5 is more than 10% away.
- India: GDI 0.874, group 5. Female HDI 0.631 against male HDI 0.722. The gap comes mostly from earned income ($4,543 against $13,273) and adult schooling (5.8 against 8.0 years), even though women live longer.
Gender Inequality Index (GII)
- The GII measures the loss in human development from inequality between women and men in three dimensions:
- Reproductive health: maternal mortality ratio and adolescent birth rate.
- Empowerment: share of parliamentary seats held by women, and adults (25+) with at least some secondary education, by sex.
- Labour market: labour force participation rate (15+), by sex.
- A higher GII means greater disparity. It covered 172 countries in HDR 2025.
- India: GII 0.403, rank 102.
- Maternal mortality is 103 per 100,000 live births, and women hold 14.8% of parliamentary seats.
- 43.5% of women against 61.1% of men have some secondary education. Female labour force participation is 35.1% against 76.4% for men.
- The component indicators show where policy intervention is most needed to overcome the systematic disadvantages of women.
Multidimensional Poverty Index (MPI)
- The global MPI was developed in 2010 by the Oxford Poverty and Human Development Initiative (OPHI) and UNDP. It replaced the Human Poverty Index (1997).
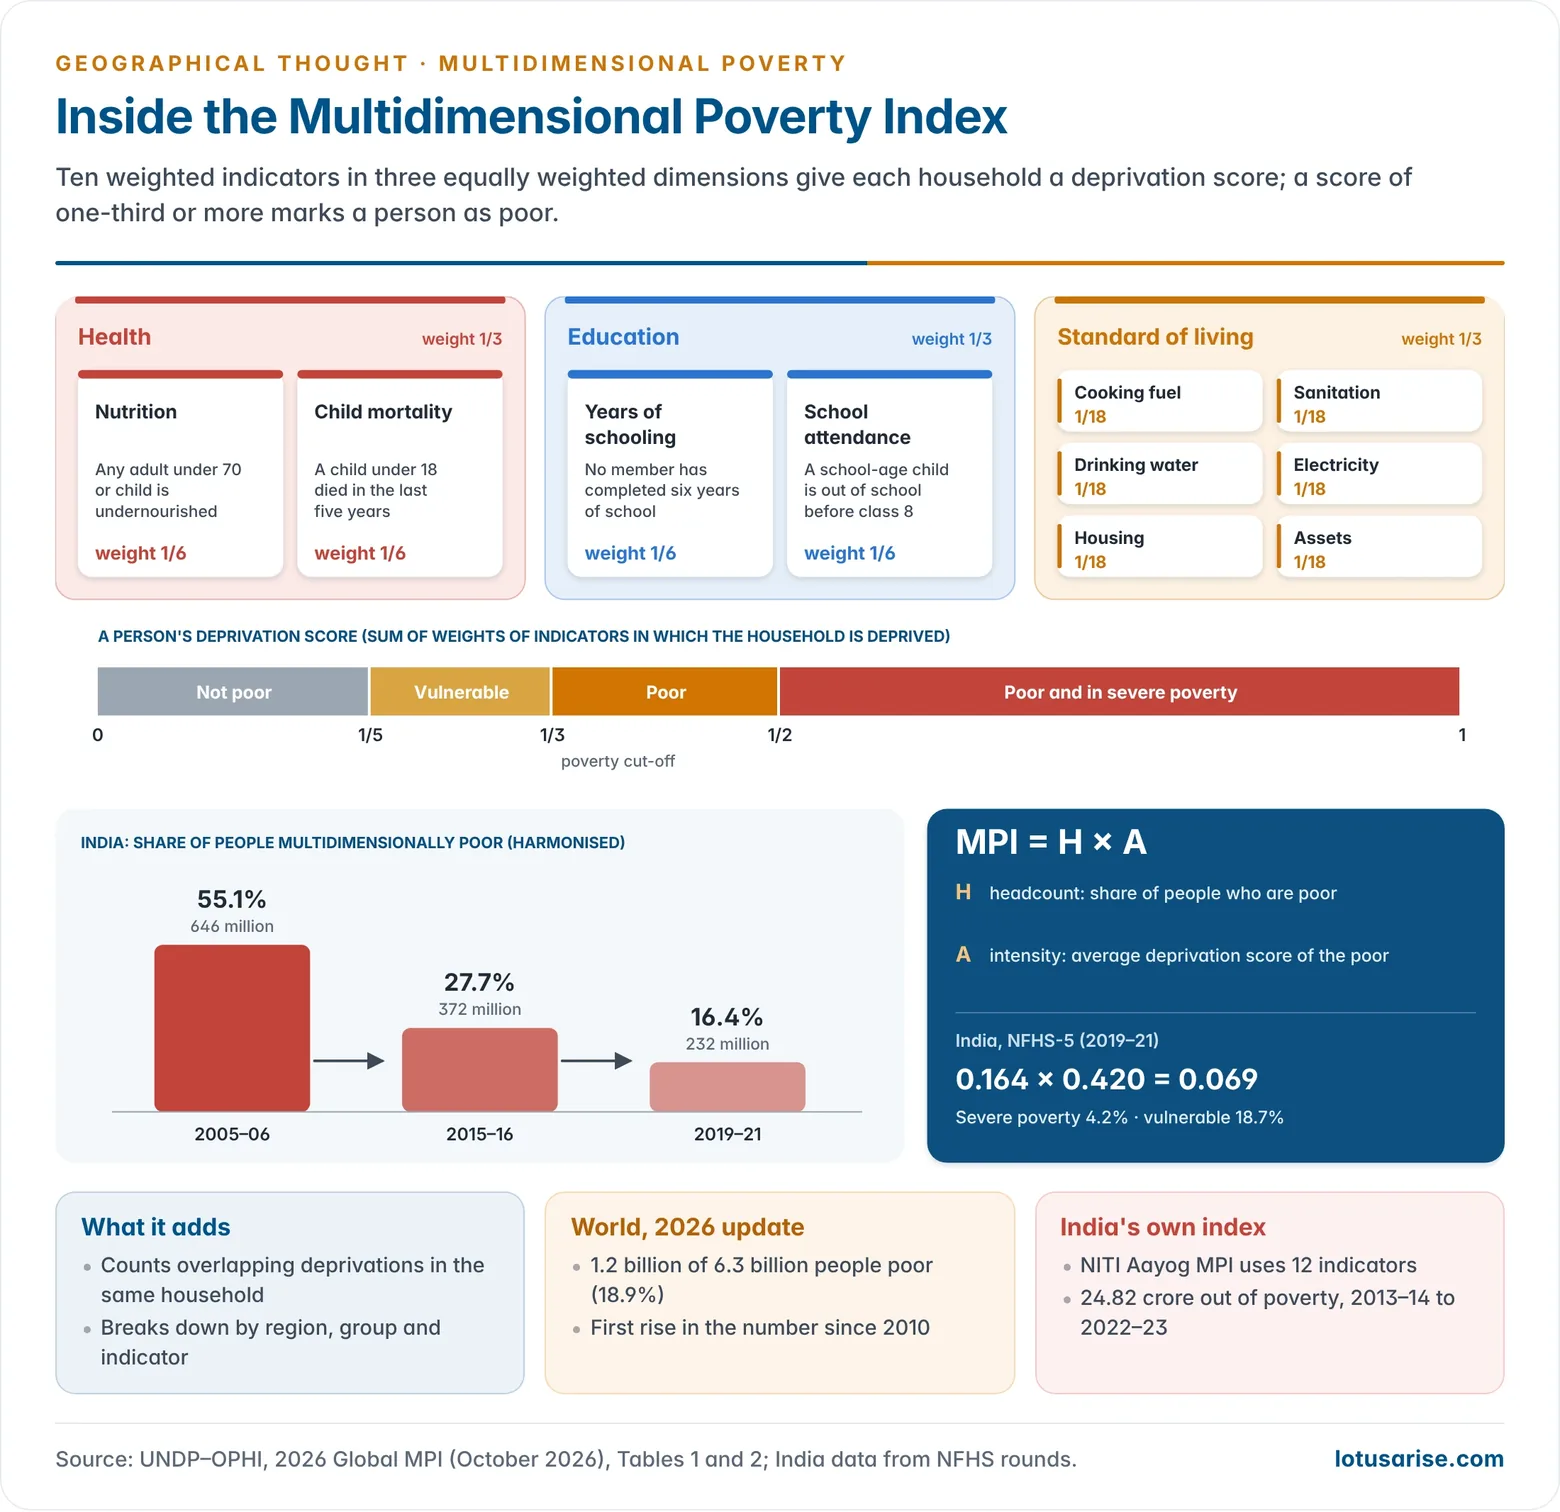
- It complements income poverty by counting overlapping deprivations suffered by the same household at the same time.
- Health: nutrition and child mortality (1/6 weight each).
- Education: years of schooling and school attendance (1/6 each).
- Standard of living: cooking fuel, sanitation, drinking water, electricity, housing and assets (1/18 each).
- Cut-offs: a person is multidimensionally poor if deprived in one-third or more of the weighted indicators, vulnerable at one-fifth to one-third, and in severe poverty at one-half or more.
- MPI = H × A, where H is the headcount ratio and A is the intensity (the average share of deprivations among the poor).
- Uses: it can be broken down by region, ethnicity, caste or dimension, which helps target those in the deepest poverty and monitor policy.
- Countries adapt it with their own indicators. NITI Aayog’s national MPI uses 12 indicators, adding maternal health and bank accounts.
- 2026 global MPI (October 2026): 1.2 billion of 6.3 billion people in 108 countries (18.9%) are multidimensionally poor. For the first time since 2010, the number has risen.
- India (NFHS-5, 2019–21): headcount 16.4%, intensity 42.0%, MPI 0.069. The harmonised headcount fell from 55.1% in 2005–06 to 27.7% in 2015–16 and 16.4% in 2019–21.
- NITI Aayog estimates that 24.82 crore people left multidimensional poverty between 2013–14 and 2022–23, as the headcount fell from 29.17% to a projected 11.28%.
Planetary Pressures-adjusted HDI (PHDI)
- Introduced in HDR 2020, the PHDI discounts the HDI for carbon dioxide emissions per capita and material footprint per capita.
- It reflects concern for inequality between generations, much as the IHDI reflects inequality within one generation.
- PHDI = HDI × adjustment factor. The factor is the average of the CO₂ and material-footprint indices.
- Pattern: very high HDI countries lose most. Iceland (0.972 → 0.735) and Norway (0.970 → 0.723) fall by about a quarter.
- India falls only 4.2% (0.685 → 0.656), because per capita emissions and resource use are low.
Spatial Pattern of Human Development in the World
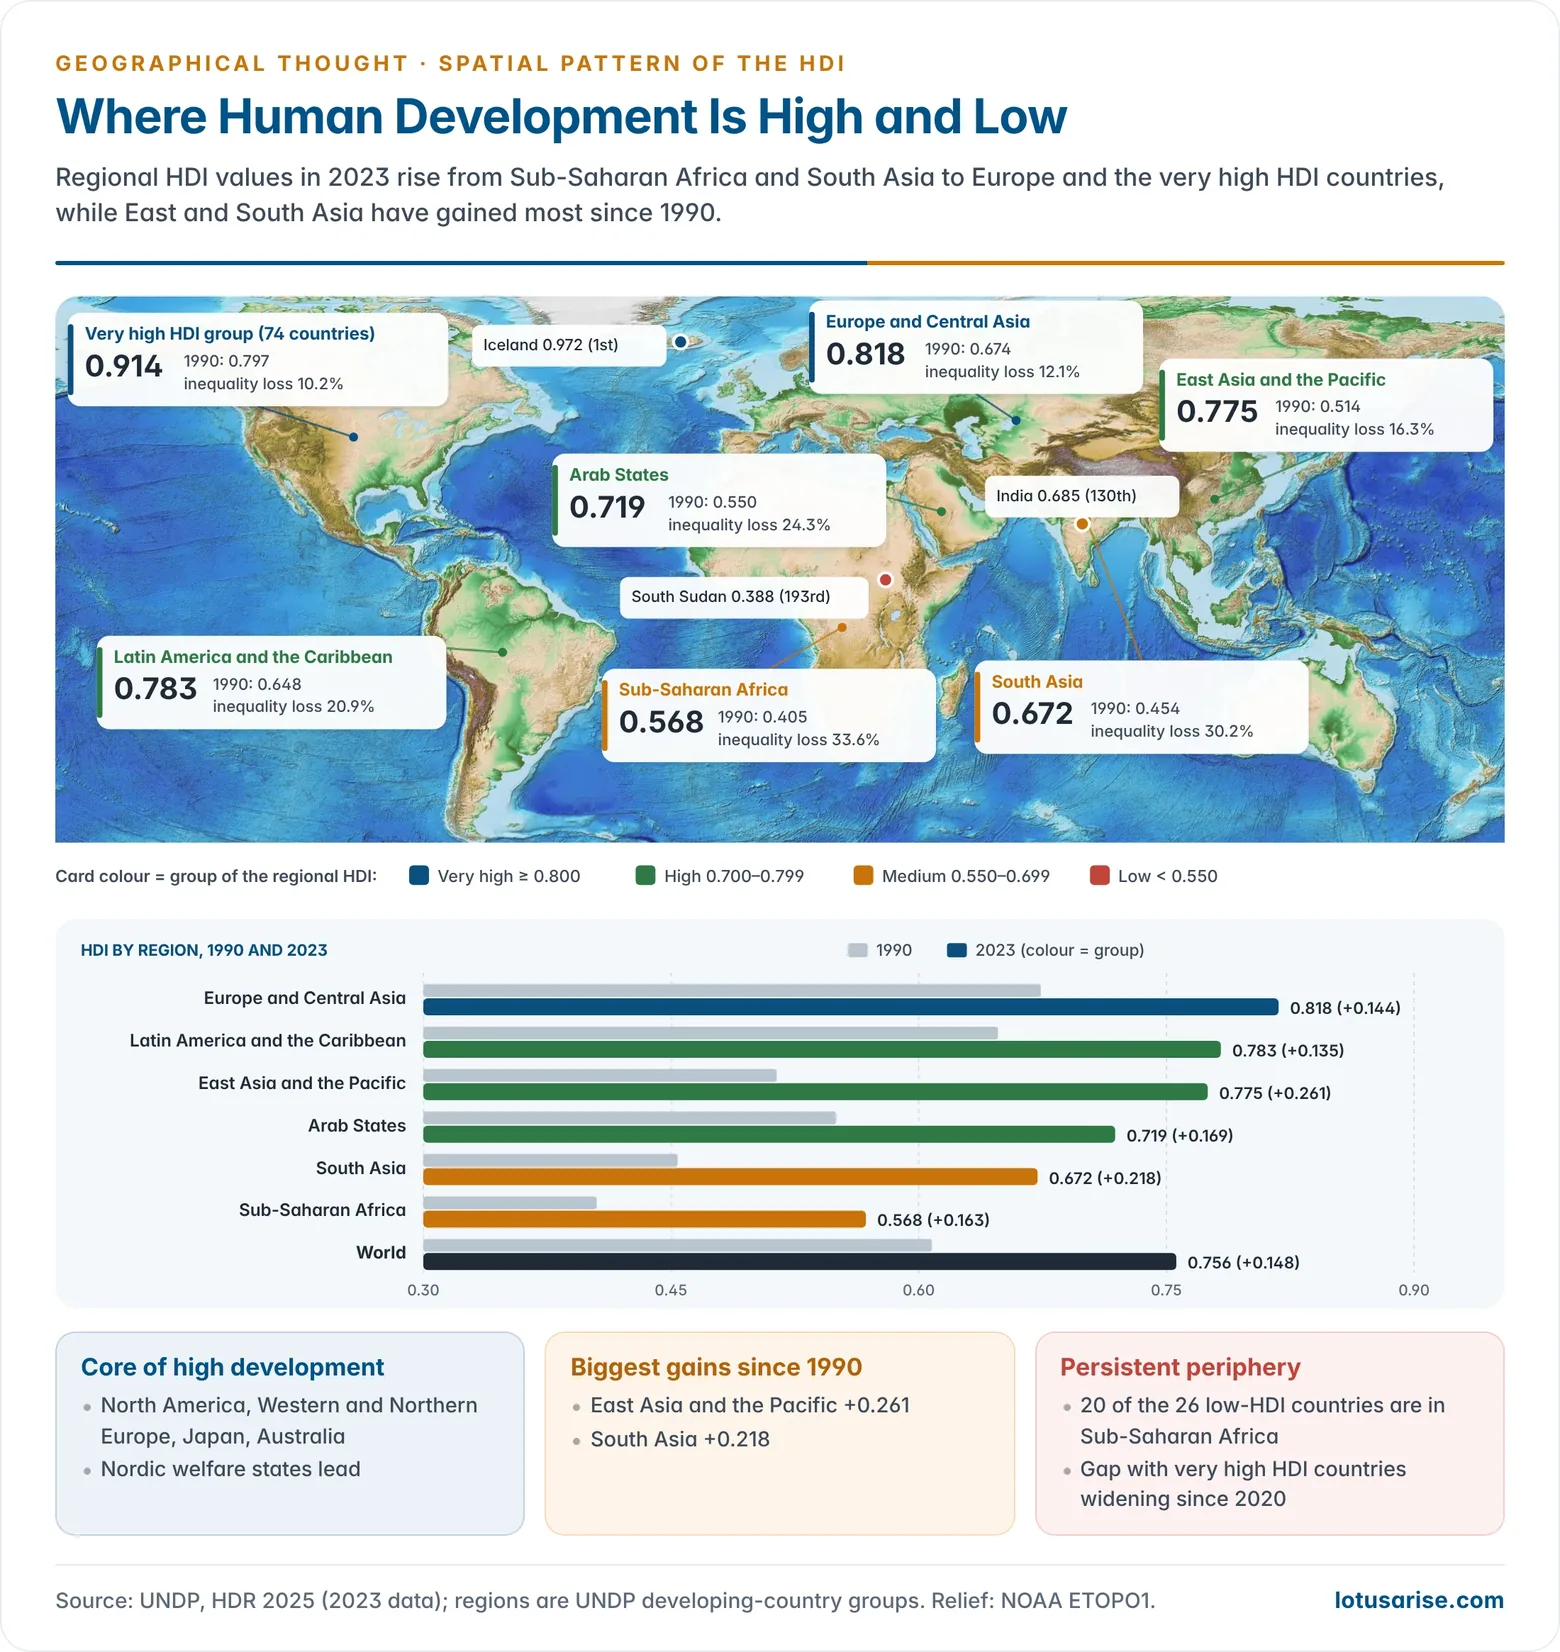
- Global HDI (2023): 0.756. It ranges from Iceland (0.972), Norway and Switzerland (0.970) at the top to South Sudan (0.388), Somalia (0.404) and the Central African Republic (0.414) at the bottom.
| Region | HDI 2023 | HDI 1990 | Loss due to inequality |
|---|---|---|---|
| Europe and Central Asia | 0.818 | 0.674 | 12.1% |
| Latin America and the Caribbean | 0.783 | 0.648 | 20.9% |
| East Asia and the Pacific | 0.775 | 0.514 | 16.3% |
| Arab States | 0.719 | 0.550 | 24.3% |
| South Asia | 0.672 | 0.454 | 30.2% |
| Sub-Saharan Africa | 0.568 | 0.405 | 33.6% |
- Very high human development: North America, Western and Northern Europe, Australia, New Zealand, Japan and South Korea, with the Gulf states, Singapore and parts of Latin America and Eastern Europe.
- Nordic countries lead through universal welfare systems, long life and near-complete schooling.
- High: much of Latin America, China (0.797), the Middle East, Central Asia and Sri Lanka (0.776).
- Medium: most of South Asia (India, Bangladesh, Bhutan, Nepal), parts of Southeast Asia, and much of Central, East and Southern Africa (South Africa and Botswana are high).
- Low: 20 of the 26 low-HDI countries are in Sub-Saharan Africa, especially the Sahel and the Horn. Somalia, Sudan and Djibouti, grouped by UNDP with the Arab States, are also African; the rest are Afghanistan, Pakistan and Yemen.
- Causes include conflict and fragility, high fertility and child mortality, weak schooling, landlocked and commodity-dependent economies, and drought.
- Income and HDI diverge:
- Sri Lanka ranks 22 places higher, and Cuba 30 places higher, on the HDI than on income per head. Long investment in public health and schooling explains this, as it does in Kerala.
- Qatar ranks 39 places lower, and Kuwait 29 places lower. High oil income has not been matched by schooling.
- Trends:
- East Asia has gained most since 1990, and South Asia has made steady progress.
- HDR 2025 finds progress stalling. The projected rise in global HDI for 2024 is the smallest since records began in 1990 (apart from the declines of 2020–21). A very high HDI world, once expected by 2030, is now delayed by decades.
- The gap between very high and low HDI countries, which had narrowed for decades, has widened since 2020.
Human Development in India
India in the Human Development Report 2025
- HDR 2025, A Matter of Choice: People and Possibilities in the Age of AI, was released on 6 May 2025. It covers data for 2023. No newer HDR has yet been released, and the 2026 report is in preparation.
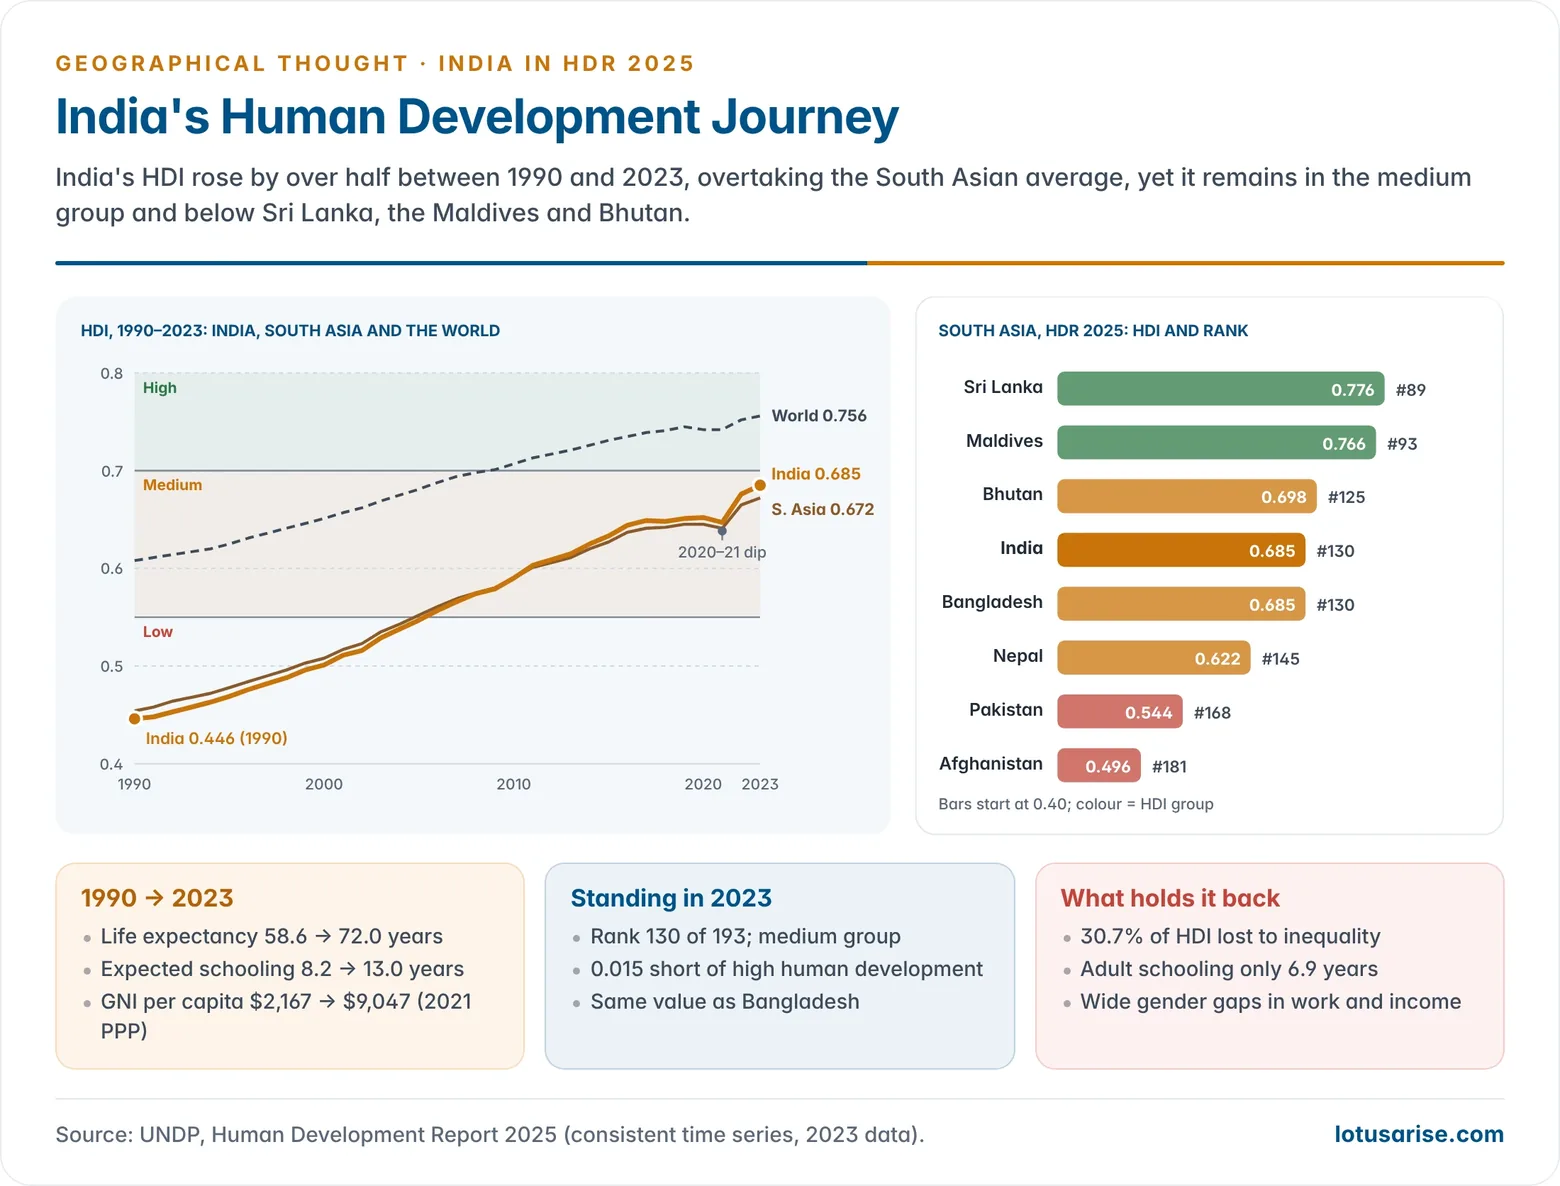
- India ranks 130th of 193 countries, with an HDI of 0.685, up from 0.676 (rank 133) in 2022.
- It remains in the medium group, close to the 0.700 threshold for high human development.
- Long-run gain: India’s HDI rose by over 53%, from 0.446 in 1990 to 0.685 in 2023, faster than the global and South Asian averages.
| Indicator | 1990 | 2023 |
|---|---|---|
| Life expectancy (years) | 58.6 | 72.0 |
| Expected years of schooling | 8.2 | 13.0 |
| Mean years of schooling | — | 6.9 |
| GNI per capita (2021 PPP $) | 2,167 | 9,047 |
- Neighbours: China (78), Sri Lanka (89), Maldives (93) and Bhutan (125) rank above India. Bangladesh has the same value and rank (0.685, 130th). Nepal (145), Myanmar (150), Pakistan (168) and Afghanistan (181) rank below.
Drivers of Progress
- Health: life expectancy reached its highest level so far (72 years) after the pandemic dip. Programmes such as the National Health Mission, Ayushman Bharat, Janani Suraksha Yojana and POSHAN Abhiyaan contributed.
- Education: the Right to Education Act (2009), Samagra Shiksha and the National Education Policy (2020) widened access. Quality and learning outcomes remain weak.
- Income: GNI per capita rose more than fourfold since 1990.
- Poverty: about 135 million Indians left multidimensional poverty between 2015–16 and 2019–21.
- AI: UNDP notes India’s high self-reported AI skill penetration, and that about 20% of Indian AI researchers now stay in the country, up from almost none in 2019.
Challenges
- Inequality cuts India’s HDI by 30.7%, one of the highest losses in the region.
- Gender gaps are wide in work and representation.
- HDR 2025 puts female labour force participation at 35.1% (ILO-modelled). The national PLFS (usual status, age 15+) shows a rise from 23.3% in 2017–18 to 41.7% in 2023–24, still far below men’s 78.8%.
- Women hold under 15% of parliamentary seats. The Constitution (106th Amendment) Act, 2023 (Nari Shakti Vandan Adhiniyam) reserves one-third of seats in the Lok Sabha and state assemblies. It takes effect after the next census and delimitation.
- Low mean years of schooling among adults, and gaps in learning quality.
- Regional disparities between the southern and western states and the central and eastern ones.
Human Development across Indian States
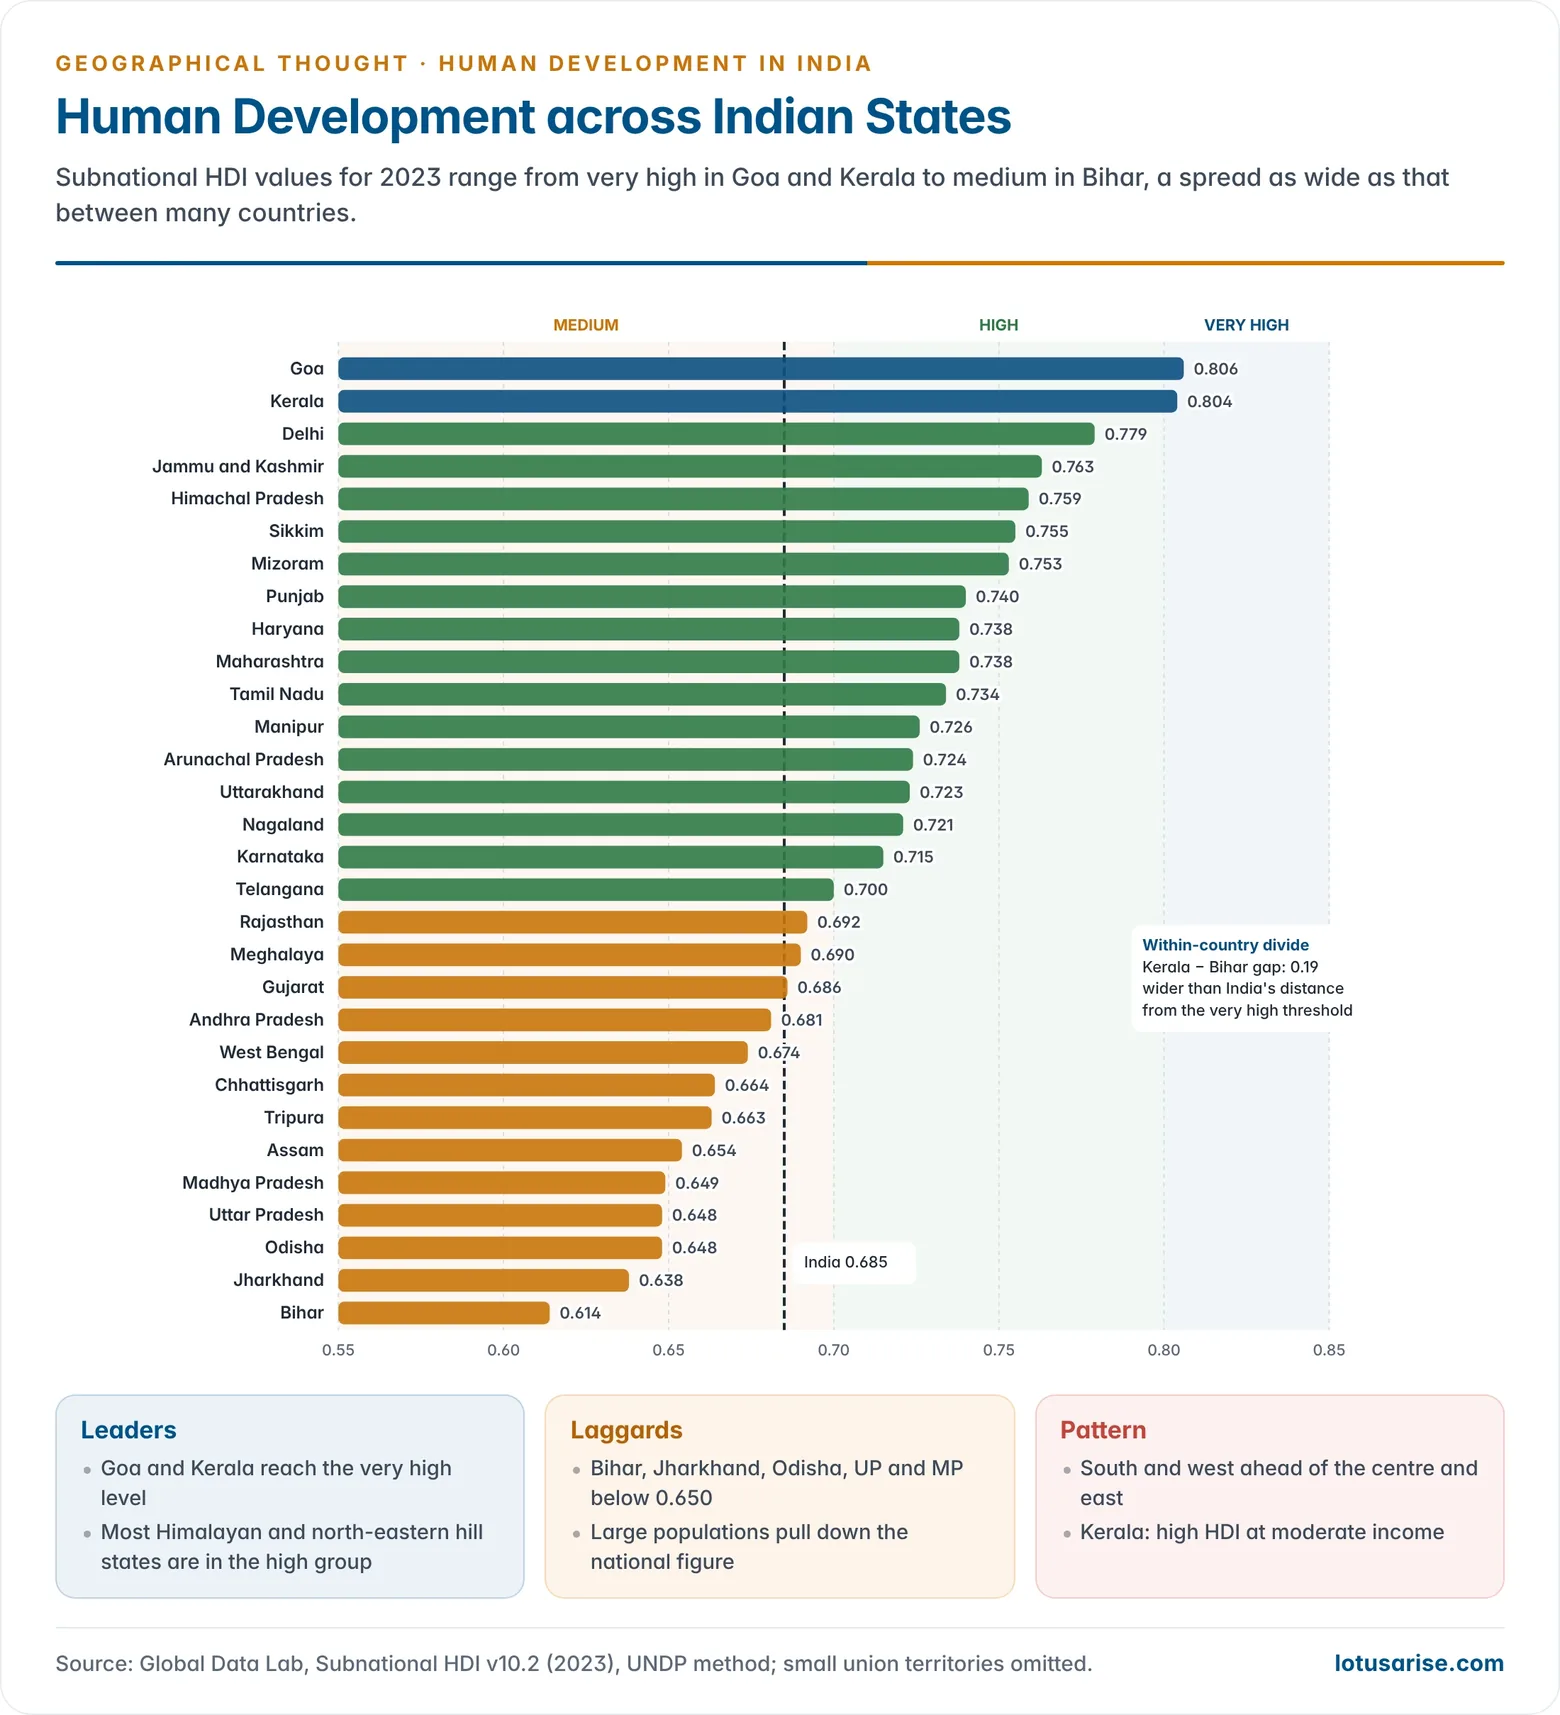
- UNDP does not rank states. Subnational HDI estimates by the Global Data Lab (Radboud University) use the UNDP method and show a wide spread for 2023:
- Highest: Goa (0.806) and Kerala (0.804), at the very high level. They are followed by the union territories of Chandigarh, Puducherry and Delhi, and by Himachal Pradesh, Sikkim and Mizoram.
- Lowest: Bihar (0.614), Jharkhand (0.638), Uttar Pradesh and Odisha (0.648), and Madhya Pradesh (0.649).
- The gap between Kerala and Bihar (0.19) is wider than the gap between India and the very high threshold.
- Kerala’s lead rests on early social reform, mass literacy, public health and women’s education. It shows that high human development is possible at moderate income, a point Jean Drèze and Amartya Sen made central to the Indian debate.
- North–south and core–periphery pattern:
- The southern and western states and the Himalayan states are ahead.
- The BIMARU belt and the eastern states (Bihar, Jharkhand, Odisha, Chhattisgarh) lag. These states hold a large share of India’s population, so they pull down the national average.
- North-East: schooling and gender indicators are relatively good in Mizoram, Manipur and Sikkim, while Assam and Tripura are below the national average.
- Poverty geography: NITI Aayog’s national MPI shows the largest absolute falls in Uttar Pradesh, Bihar and Madhya Pradesh between 2013–14 and 2022–23. These remain the states with the most poor people.
Limitations and Critique of the HDI
- A paradigm shift, with limits: the HDI moved the debate from output to people, shaped national and state reports, and fed into the Millennium and Sustainable Development Goals. Its simplicity is both its strength and its weakness.
Conceptual Limitations
- Narrow coverage: three dimensions leave out political freedom, human rights, security, participation, culture, work quality and environment. These are the “additional choices” of the 1990 definition.
- Averages hide distribution: the HDI ignores inequality between classes, castes, genders and regions. The IHDI and GDI only partly correct this.
- Arbitrary choices: the equal weights, the goalposts and the log of income are value judgements. Changing them changes the ranks.
- Substitutability: even with a geometric mean, high income can partly mask poor health or schooling.
- Quantity, not quality: years of schooling ignore learning outcomes, and life expectancy ignores healthy years and morbidity.
- Sustainability was ignored until the PHDI. Even now the headline HDI rewards resource-intensive rich countries.
Data and Spatial Limitations
- Data gaps and time lags: many developing countries lack recent censuses and surveys, so values are often imputed or old. Revisions in PPP rates or population data can shift ranks without any real change.
- Scale problem: a national value hides intra-national disparities. India’s single figure masks the Kerala–Bihar gap, the urban–rural divide and tribal districts.
- Relative ranking: a country can rise or fall because others move, not because of its own performance.
- Not culture-neutral: critics see a Western, individualist model of the good life. Alternatives such as Bhutan’s Gross National Happiness and subjective well-being measures stress other values.
- Geographical critique: like welfare geography, the HDI shows “who gets what, where” but not the structural “how”: the class relations, global trade and power behind the pattern.
Responses and Present Relevance
- UNDP has answered many criticisms with the IHDI, GDI, GII, MPI and PHDI, with dashboards of extra indicators, and with national and subnational reports.
- The HDI remains the most widely used measure of social well-being and human development. It is best read alongside its companion indices and local data, not as a single verdict.
Previous Year Questions
2026What are the approaches of human development? Describe in detail the measures for computing human development index.2019HDI has brought about a paradigm shift in the way people think about the development process. Critically examine the inherent limitations of HDI.2013Explain the parameters for assessment and the spatial pattern of Human Development Index in the world.2010Critically examine the method of deriving Human Development Index.





Thank you so much…this is really helpful….
well consolidated material … Thanks a lot