

- The Limits to Growth (LTG) model argues that exponential growth in population, industrial output, resource use and pollution, on a finite planet, will sooner or later overshoot the Earth’s carrying capacity.
- Without a deliberate change of course, the result would be ecological and economic collapse some time in the 21st century.
- It was published in 1972 as a report to the Club of Rome and is the most famous neo-Malthusian statement of the population–resource–development problem.
- It remains the starting point for debates on sustainable development, degrowth, planetary boundaries and resource scarcity.
Origin and Structure of the Model

The Club of Rome and the MIT Study
- The Club of Rome was founded in April 1968 by the Italian industrialist Aurelio Peccei and the Scottish scientist Alexander King. It began with about 75 members from science, business, the civil service and academia across the world.
- It believed that the possibilities of continuous growth were being exhausted and that timely action was needed to avert a planetary crisis.
- In June 1970 it took up as its first theme “The Predicament of Mankind“.
- It commissioned a team at the Massachusetts Institute of Technology (MIT), led by Dennis Meadows, with Donella Meadows (lead author), Jørgen Randers and William Behrens III.
- Their report, The Limits to Growth, appeared in March 1972. It became one of the best-known environmental books, published in about 30 languages.
- Follow-up reports:
- Beyond the Limits (1992) gave fresh evidence that humanity had already overshot several limits.
- Limits to Growth: The 30-Year Update (2004) restated the warning with new data.
System Dynamics: Forrester’s Method
- Jay W. Forrester of MIT created system dynamics, a method of computer modelling built on stocks, flows and feedback loops.
- In World Dynamics (1971) he built a world model (World2) linking highly aggregated variables: population, industrial production, food supply, pollution and remaining natural resources.
- The LTG team extended it into World3, a computer model of the whole world system.
- The model’s core thesis: “continued growth leads to infinite quantities that just do not fit into a finite world.”
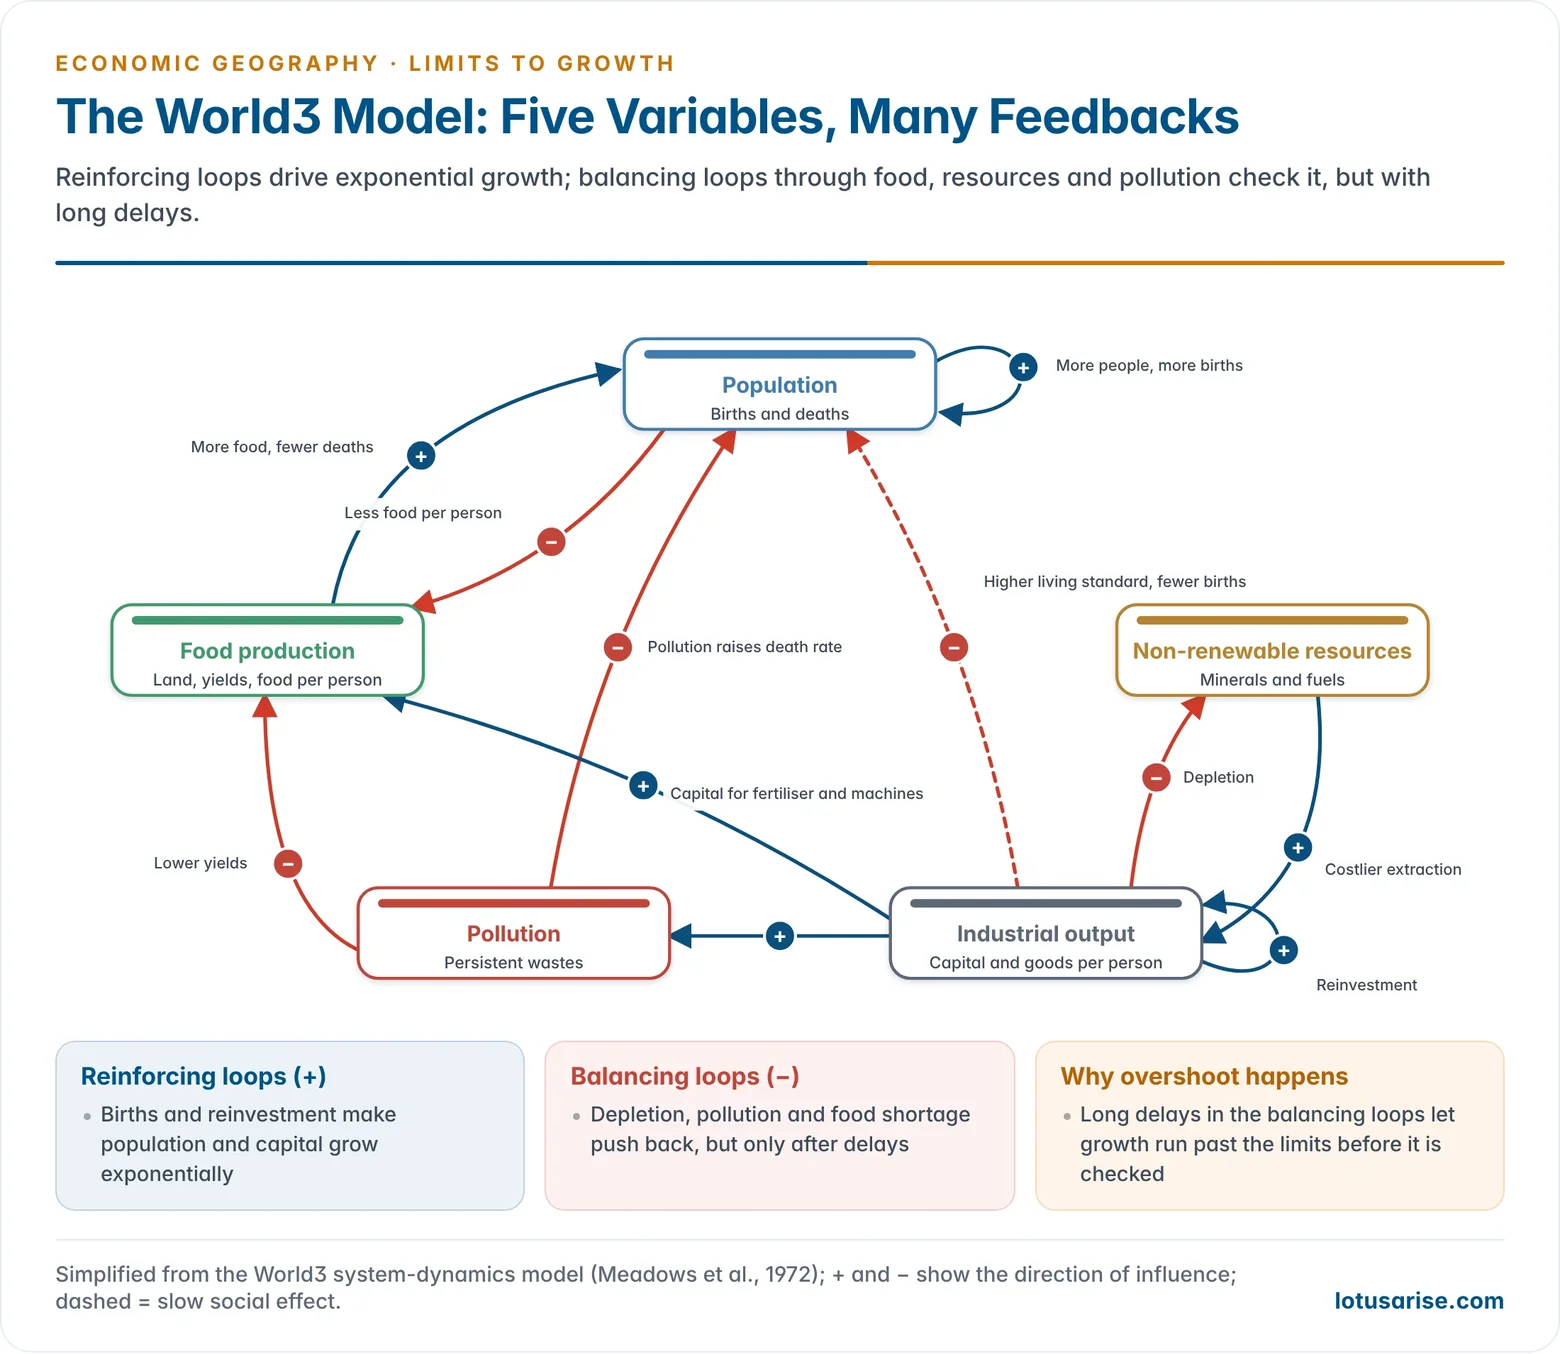
- Feedback loops link the variables.
- Positive (reinforcing) loops drive growth. More people means more births, and more capital produces more output and more investment.
- Negative (balancing) loops restrain growth. Pollution raises the death rate, and falling resources need more capital to extract.
- Example: population growth is positively related to food production. Food production is negatively related to pollution, and pollution is positively related to industrial output.
- The model uses past data on the growth rates of population, industrial output and agricultural production. It adds estimates of technological progress that could open new resources, raise farm yields and control pollution.
The Five Variables
| Variable | What it tracks |
|---|---|
| Population | Population size and growth (birth and death rates) |
| Food production (agriculture) | Land, yields and food per person; scope to raise productivity for food security |
| Industrial production | Industrial capital and output per person; possibility of industrial growth |
| Non-renewable resources | Stock of minerals and fuels, especially petroleum |
| Pollution | Persistent pollution and the planet’s ability to absorb it |
Assumptions of the Model
- Population:
- Population change (birth rate minus death rate) depends on crowding, food intake, pollution and the material standard of living.
- A rise in any of these four tends to lower the birth rate.
- The death rate falls with more food and higher living standards, and rises with more pollution and crowding.
- Living standard: the material standard of living depends on the stock of capital relative to population and on the productivity of capital.
- Resources: non-renewable resources are used up continuously by production.
- The lower the remaining stock, the more capital is diverted to extracting resources, leaving less capital to produce finished goods.
- Agriculture: output depends on land and capital investment.
- Land can be developed or eroded depending on investment decisions. Capital raises yield per hectare, but with diminishing returns.
- Pollution: production generates pollution, which the environment absorbs only gradually. High accumulations of pollution lower the environment’s absorptive capacity.
How the Model Works
Modes of Approach to Carrying Capacity
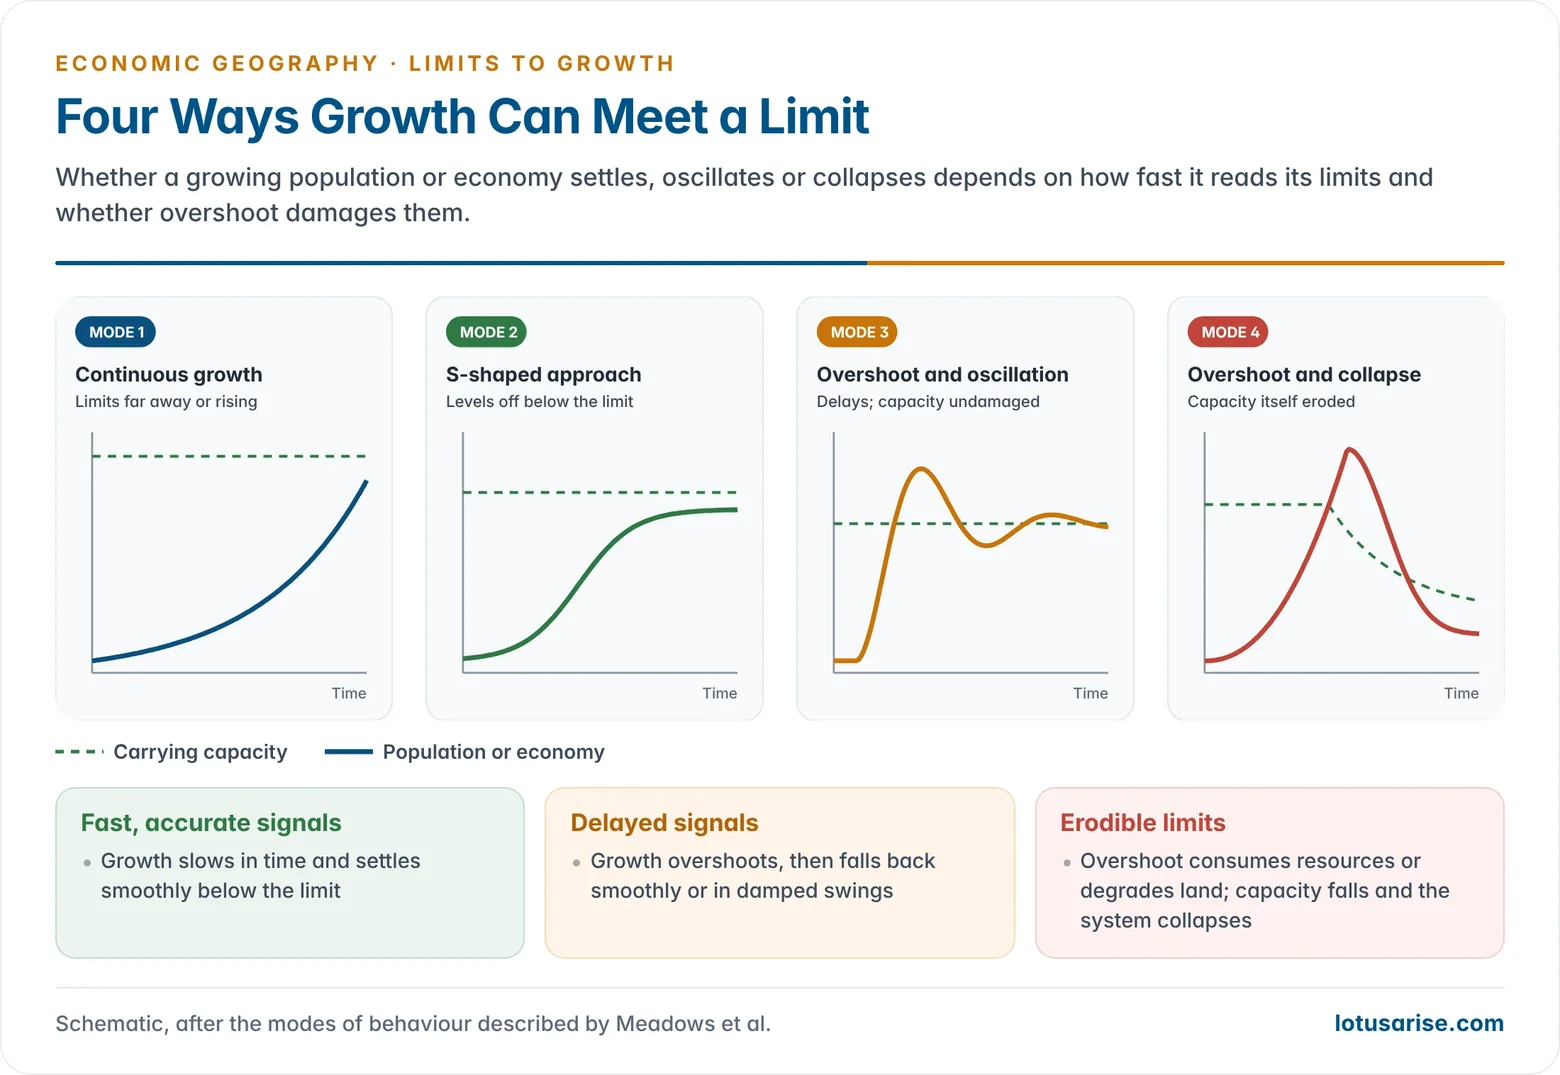
- Carrying capacity is the population that the prevailing physical and biological systems can sustain indefinitely.
- How a growing system meets its limit depends on the carrying capacity and on the speed and delays of its own feedbacks.
- Continuous growth happens only while the limits are far away or are themselves growing.
- Sigmoid (S-shaped) approach: growth slows gradually and levels off smoothly below the limit, because the system receives early signals and responds quickly.
- Overshoot and oscillation: delayed signals let the system overshoot the limit and then fall back, either smoothly or in damped oscillations around it. This happens only when the carrying capacity is not damaged.
- Overshoot and collapse: the overshoot erodes the carrying capacity itself, for example by consuming non-renewable resources or degrading soils. The system then collapses to a much lower level.
- The LTG authors argued that the world system, with its long delays and erodible limits, was heading for overshoot and collapse unless it changed course.
The Standard Run and Other Scenarios
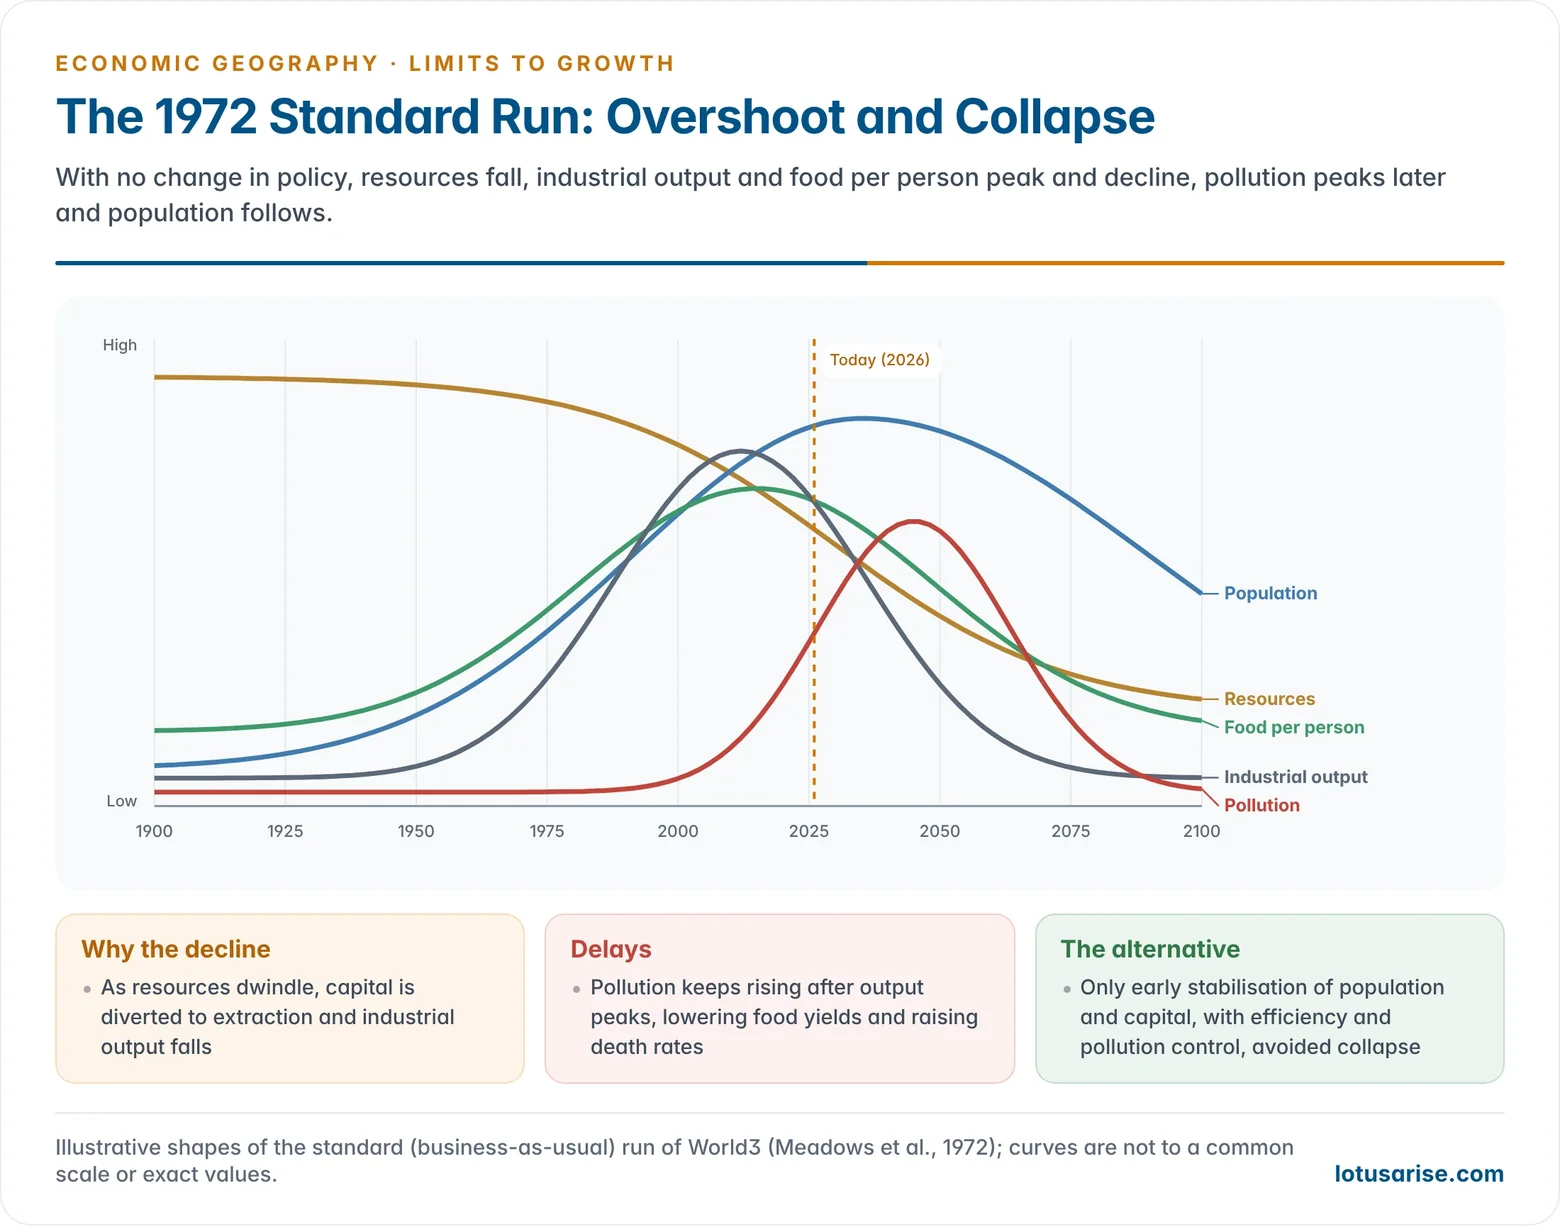
- The model was run under twelve scenarios. The standard run (“business as usual”) assumed no major change in physical, economic or social relationships.
- Graphic explanation of the standard run (1900–2100):
- Resources are fixed in amount (oil, natural gas, copper, lead) and fall steadily as they are used up.
- Population and food rise together for most of the 20th century. Later the population keeps rising while food per person slows, peaks and then declines.
- Industrial output per person rises until resource depletion diverts capital to extraction, after which it falls.
- Pollution keeps rising after industrial output peaks, because of delays in absorption, and pushes up the death rate.
- Population finally peaks and falls, through rising death rates from lack of food, health services and pollution.
- Other scenarios:
- Doubling resources or adding technology for pollution control and farm yields only postponed the collapse. The limit then came from pollution or food instead.
- Only the “stabilised world” scenario, which combined population stabilisation, limits on industrial capital, resource efficiency, pollution control and soil conservation with early action, avoided collapse.
The Population–Resource–Development Nexus
- Population raises demand for food, energy and materials. Development, meaning industrial growth and rising consumption, multiplies resource use per person. Both press on a finite resource base and waste sink.
- The model shows that the three are linked in a single system.
- Development depletes non-renewable resources, and depletion raises the capital cost of further development.
- Industrialisation creates pollution, which lowers food output and raises death rates.
- Population growth needs more food and capital, which deepens resource use.
- Prescription: stabilise population and capital, and shift investment from material output to services, education, health, resource efficiency and pollution control.
- This global equilibrium was an early version of the idea of sustainable development, later defined by the Brundtland Report (1987).
- The model widens the old Malthusian fear of population outrunning food to industry, resources and pollution. It became a founding text of the neo-Malthusian school and recast the idea of over, under and optimum population at world scale.
Criticism of the Model
- Alarmism and determinism: the report was read as a doomsday prediction of the collapse of the world economy in the 21st century.
- Critics said it underrated the possibilities of human innovation.
- Its data and computer simulation were crude by today’s standards, and its relationships were assumed rather than measured. William Nordhaus called it “measurement without data” (1973).
- Static reserve index: it treated reserves of non-renewable resources as fixed and scarce, to be exhausted by about 2100.
- In fact known reserves have grown with exploration and technology, because extraction of sub-economic deposits becomes cheaper.
- Neglect of technology and substitution: the model ignored technological development in extraction, use, recycling and substitution of resources.
- Herman Kahn argued that when a limit is reached, new technology either removes it or a later technology does.
- The Green Revolution raised food output in developing countries far beyond the model’s assumptions.
- Price system ignored: it neglected markets and prices. Rising prices signal scarcity, curb demand and encourage exploration and substitutes.
- Resource optimists such as Julian Simon (The Ultimate Resource, 1981) disagreed with the depletion thesis. Simon won his 1980–1990 wager with Paul Ehrlich when metal prices fell.
- Population: world population did not keep growing exponentially.
- The growth rate peaked at about 2.1% a year in the late 1960s and has since halved. Population was about 6.1 billion in 2000 and about 8.2 billion in 2025.
- China and India slowed growth through birth control and development, and studies show that rising income lowers fertility (the demographic transition).
- Pollution: it assumed pollution would rise exponentially with output.
- Cleaner technology and environmental policy have cut many local pollutants in rich and some developing countries. Critics argue that growth itself pays for potable water, sanitation, housing and less congestion.
- Zero economic growth: the report’s call to stop growth to halt pollution was seen as unworkable and unfair.
- Critics argue that if positive growth leads to doom, zero growth would do the same, only more slowly.
- Growth is the developing world’s only hope of escaping the vicious circle of poverty.
- Zero growth would require massive redistribution of income and wealth within and between countries, which could come only by force and would set rich against poor. The model does not explain how this could happen.
- The view from the South: the Bariloche model of Argentina’s Fundación Bariloche (Catastrophe or New Society?, 1976) argued that the real crisis was poverty and unequal distribution, not physical limits. Basic needs could be met for all within the Earth’s limits.
- Over-aggregation: a single world model hides regional differences. The rich North’s consumption and the poor South’s needs are lumped together, which is a geographer’s objection.
- Methodological critique: Models of Doom (1973), by a team at Sussex University, showed that small changes in assumptions changed the results greatly.
Present Relevance
- Data comparisons:
- The physicist Graham Turner (2008, 2014) found that 30–40 years of real data tracked the standard run closely.
- Gaya Herrington (2021) compared the scenarios with data up to 2020. She found that the world was closest to the “business as usual 2” and “comprehensive technology” scenarios. Both show growth halting within about a decade, though the technology path declines far less sharply.
- Planetary boundaries: Johan Rockström and colleagues (2009) defined nine planetary boundaries. The Planetary Health Check 2025 found seven of the nine crossed, with ocean acidification the latest.
- Ecological overshoot: Earth Overshoot Day, the date humanity’s yearly demand exceeds what the Earth regenerates, fell on 24 July 2025 and 30 July 2026.
- Updates: Jørgen Randers’ 2052 (2012) and the Club of Rome’s Earth for All (2022) recast the message as a call for rapid, fair transformation: ending poverty, reducing inequality, empowering women, transforming food systems and switching to clean energy.
- Policy legacy: the model shaped the Stockholm Conference (1972), the Brundtland Report, the SDGs, and the debate between green growth (decoupling growth from resource use) and degrowth.
Case Study: China’s Growth and Resource Use
- China’s economy grew from under $200 billion in 1980 to about $18.7 trillion in 2024. It is the clearest modern case of rapid growth with intensive resource use.
- Costs: severe air pollution, water scarcity, soil degradation, and the world’s largest carbon emissions (about 31% of the global total in 2025).
- Correction: China leads the world in solar, wind and electric vehicles, with over 1,000 GW of solar capacity by 2025. This shows both the LTG warning and its critics’ faith in technological adaptation.
- India: the LiFE (Lifestyle for Environment) movement and the 500 GW non-fossil target for 2030 reflect the same search for development within limits.
Implications
- The report highlights the dangers of the relentless pursuit of material wealth, above all by industrialised countries.
- It warns of resource depletion, environmental deterioration and population explosion. It calls on policymakers, NGOs and people to protect the environment, save non-renewable resources and control population.
- Its most controversial prescription is that governments should voluntarily adopt a zero-growth (steady-state) policy. The prescription remains contested, but the core warning about exponential growth in a finite system stands.
Previous Year Questions
2023Explain population, resource use and development nexus in the Limits to Growth Model. Why has this model been criticized intensively?2018Discuss in brief the main thesis in “Limits to Growth” (1972) and also provide a critique of the same.2009Write short note on ‘Limits to Growth’ model.2003Write short note: Concept of limits to growth.2000Write short note: The limits to growth1991Write short note: Concept of ‘Limits to Growth’.





Great notes. Waiting for complete geography optional notes.
Sir can you please draw the combined diagram for all the factors combined
Brother I don’t know how you earn money but one thing I want to say person like you are the pillar of humanity… Providing everything free is not cup of tea. ….. Big salute sir God bless you
🙏 Thank You So Much, Keep reading
Your notes make my preparation easy and precise. Thanks a lot