

Signal-detection and vigilance.
Official Syllabus: Paper I · Unit 5 Sensation, Attention and Perception
“Signal detectability theory … separates the sensitivity of the observer from the criterion the observer adopts.”
— Green and Swets (1966), Signal Detection Theory and Psychophysics
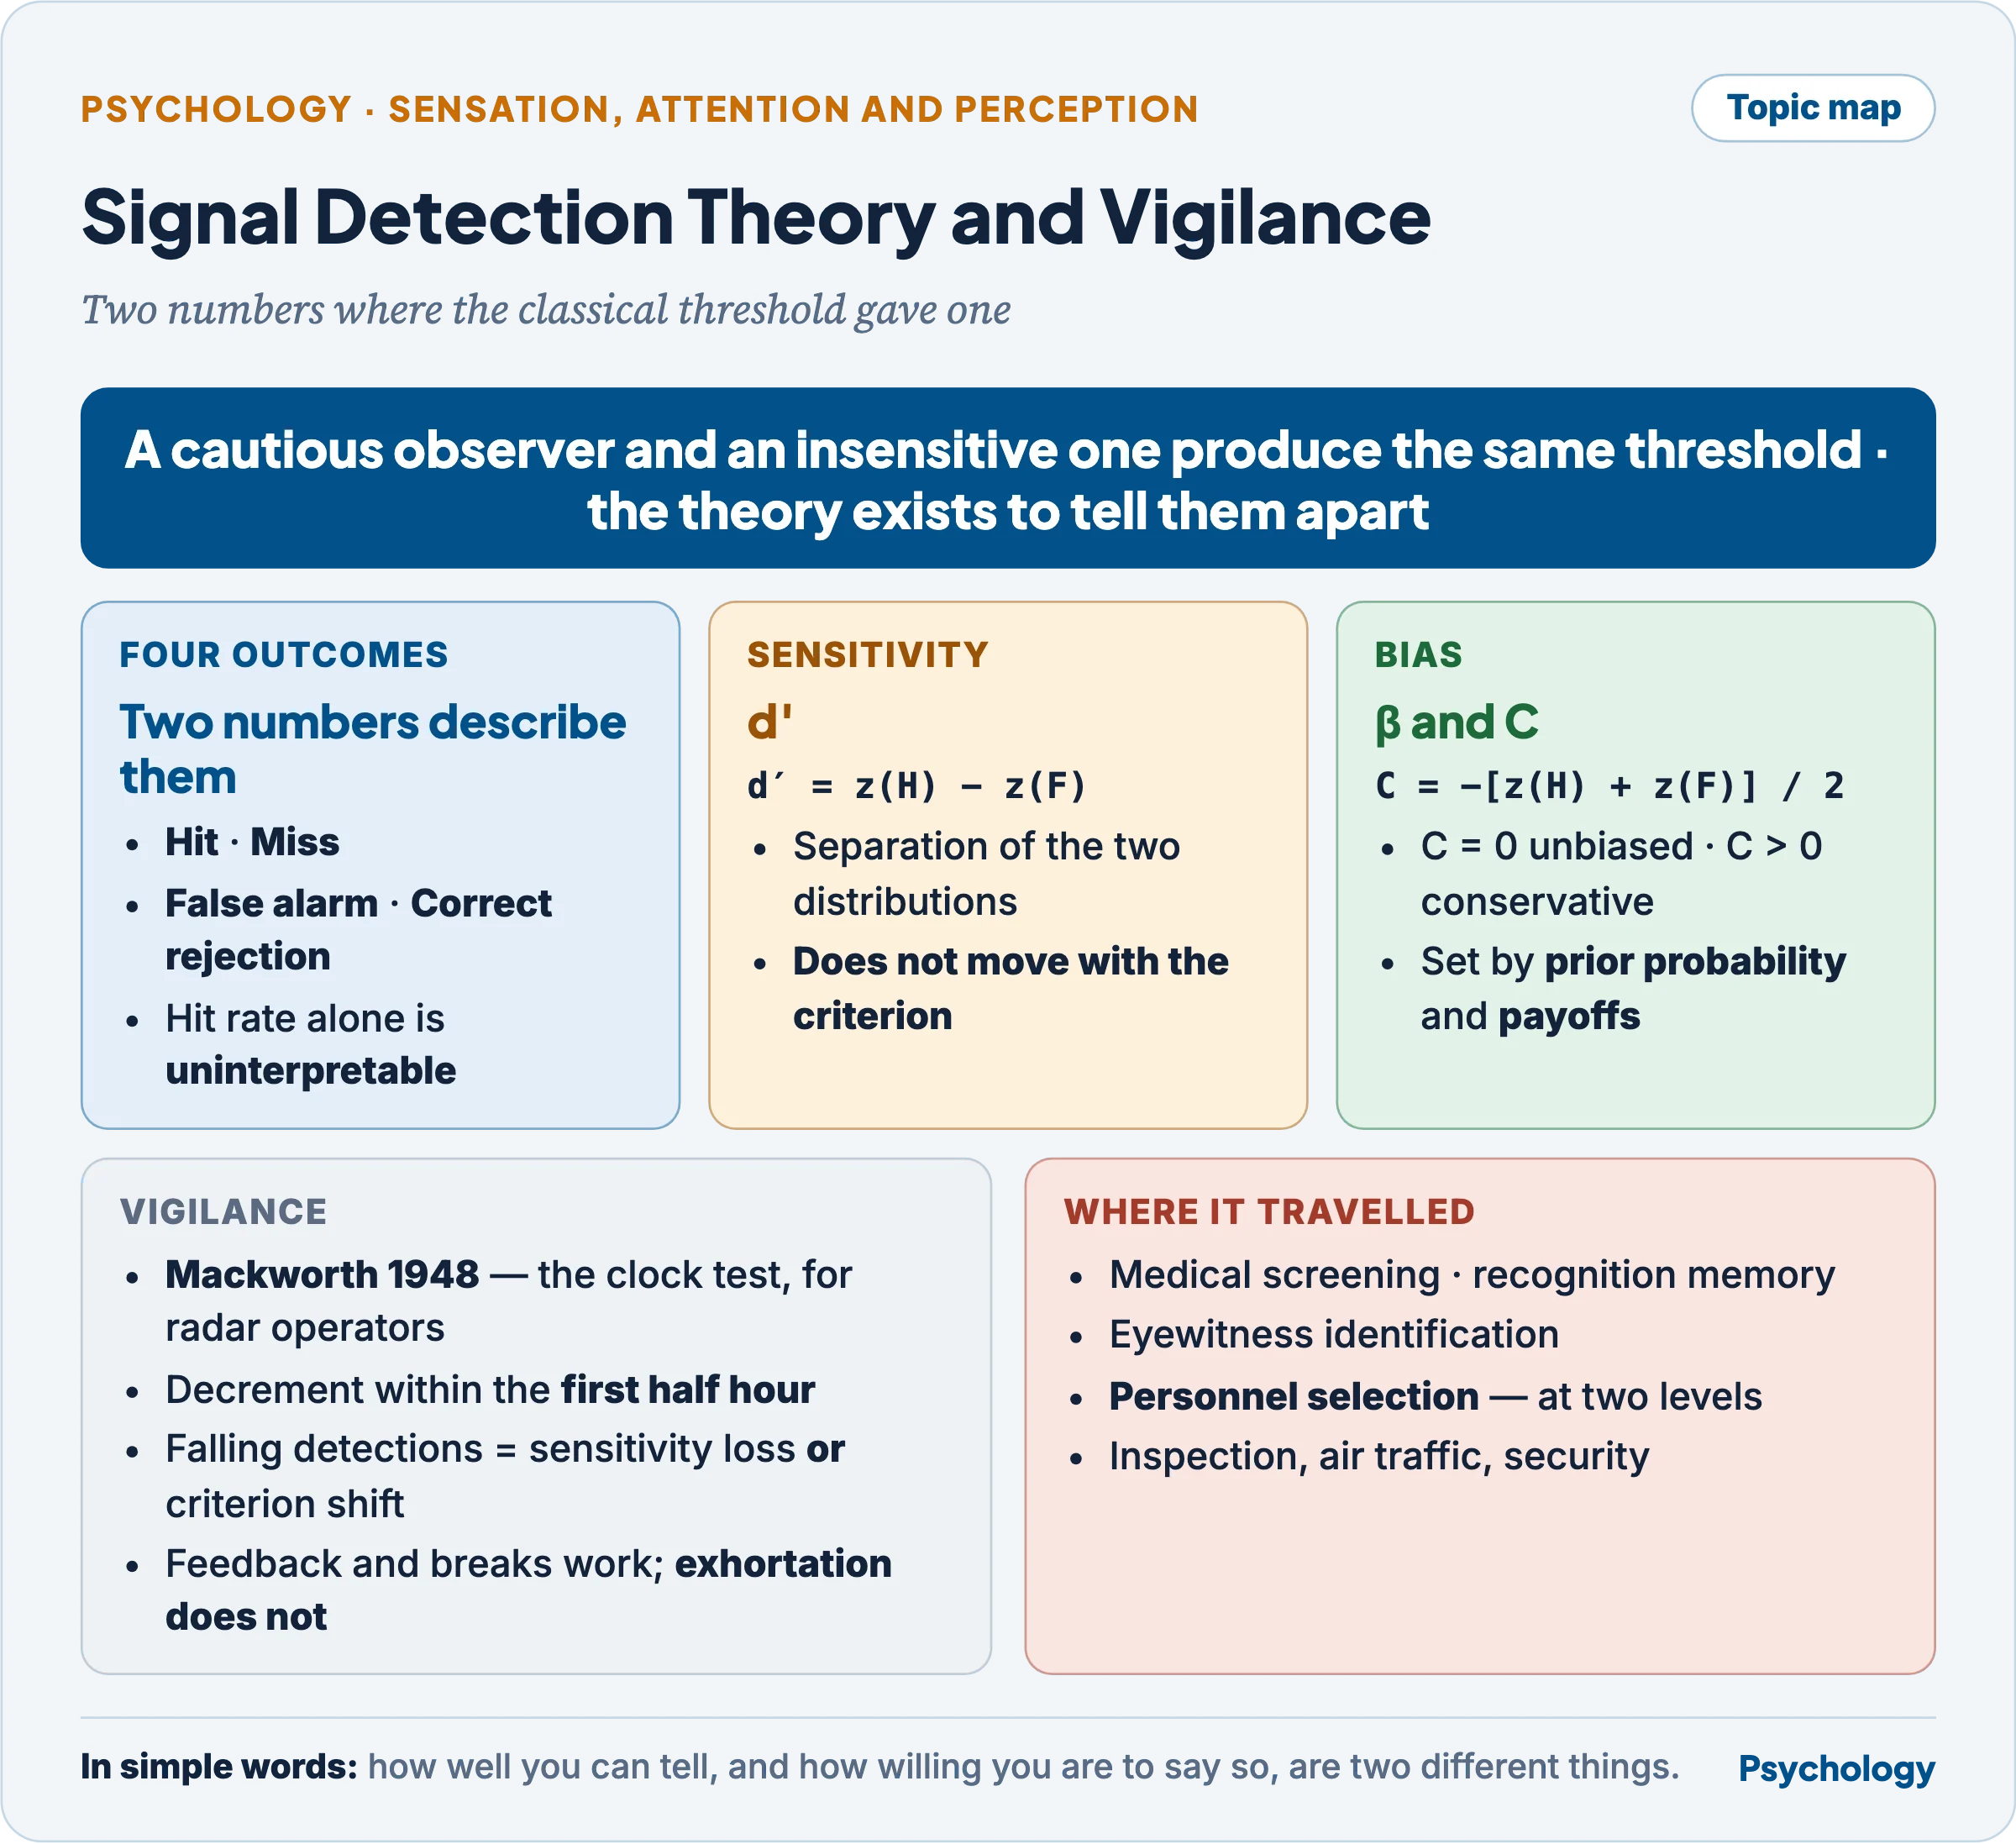
Classical psychophysics asked how faint a stimulus can be and still be detected, and got an answer that was contaminated. A cautious observer and an insensitive one produce the same threshold, because the classical methods record only whether the observer said yes. Signal detection theory’s achievement is to pull those apart: it yields two independent numbers, one for how well the observer can discriminate and one for how willing they are to say so. Everything else in the theory follows from that separation.
Why the classical threshold had to go
Three facts make a fixed threshold untenable.
- There is always noise. The nervous system is spontaneously active, so even with no stimulus present there is some internal response. Detection is therefore never a question of presence against absence but of more against less.
- Detection fluctuates. The same intensity is detected on some trials and not others, which is why Fechner (1860) had to define the classical threshold as a point on a gradual curve rather than a boundary.
- A decision, not just a registration. Told that signals are rare, or that a miss is costly, the same observer with the same eyes reports differently — a point Green and Swets (1966) made the foundation of the theory. The classical methods treat it as error; signal detection theory treats it as the second thing being measured.
The four outcomes
Every trial has two possible states of the world and two possible responses, giving four outcomes. The whole theory is built on this table, and misnaming its cells is the commonest error on the topic.
| Observer says “yes” | Observer says “no” | |
|---|---|---|
| Signal present | Hit | Miss (Type II error) |
| Signal absent (noise only) | False alarm (Type I error) | Correct rejection |
The rows are not independent of each other, which is the point. Hit rate and miss rate sum to one, as do false alarm rate and correct rejection rate, so two numbers describe the table — conventionally the hit rate and the false alarm rate. And those two cannot be improved together: saying “yes” more often raises hits and false alarms.
The hit rate alone is therefore uninterpretable. A high hit rate may mean a sensitive observer or merely a reckless one. This single point is the practical justification for the entire theory, and it is why reporting detection performance as “percentage detected” is inadequate wherever bias may differ between observers or conditions.
The decision process
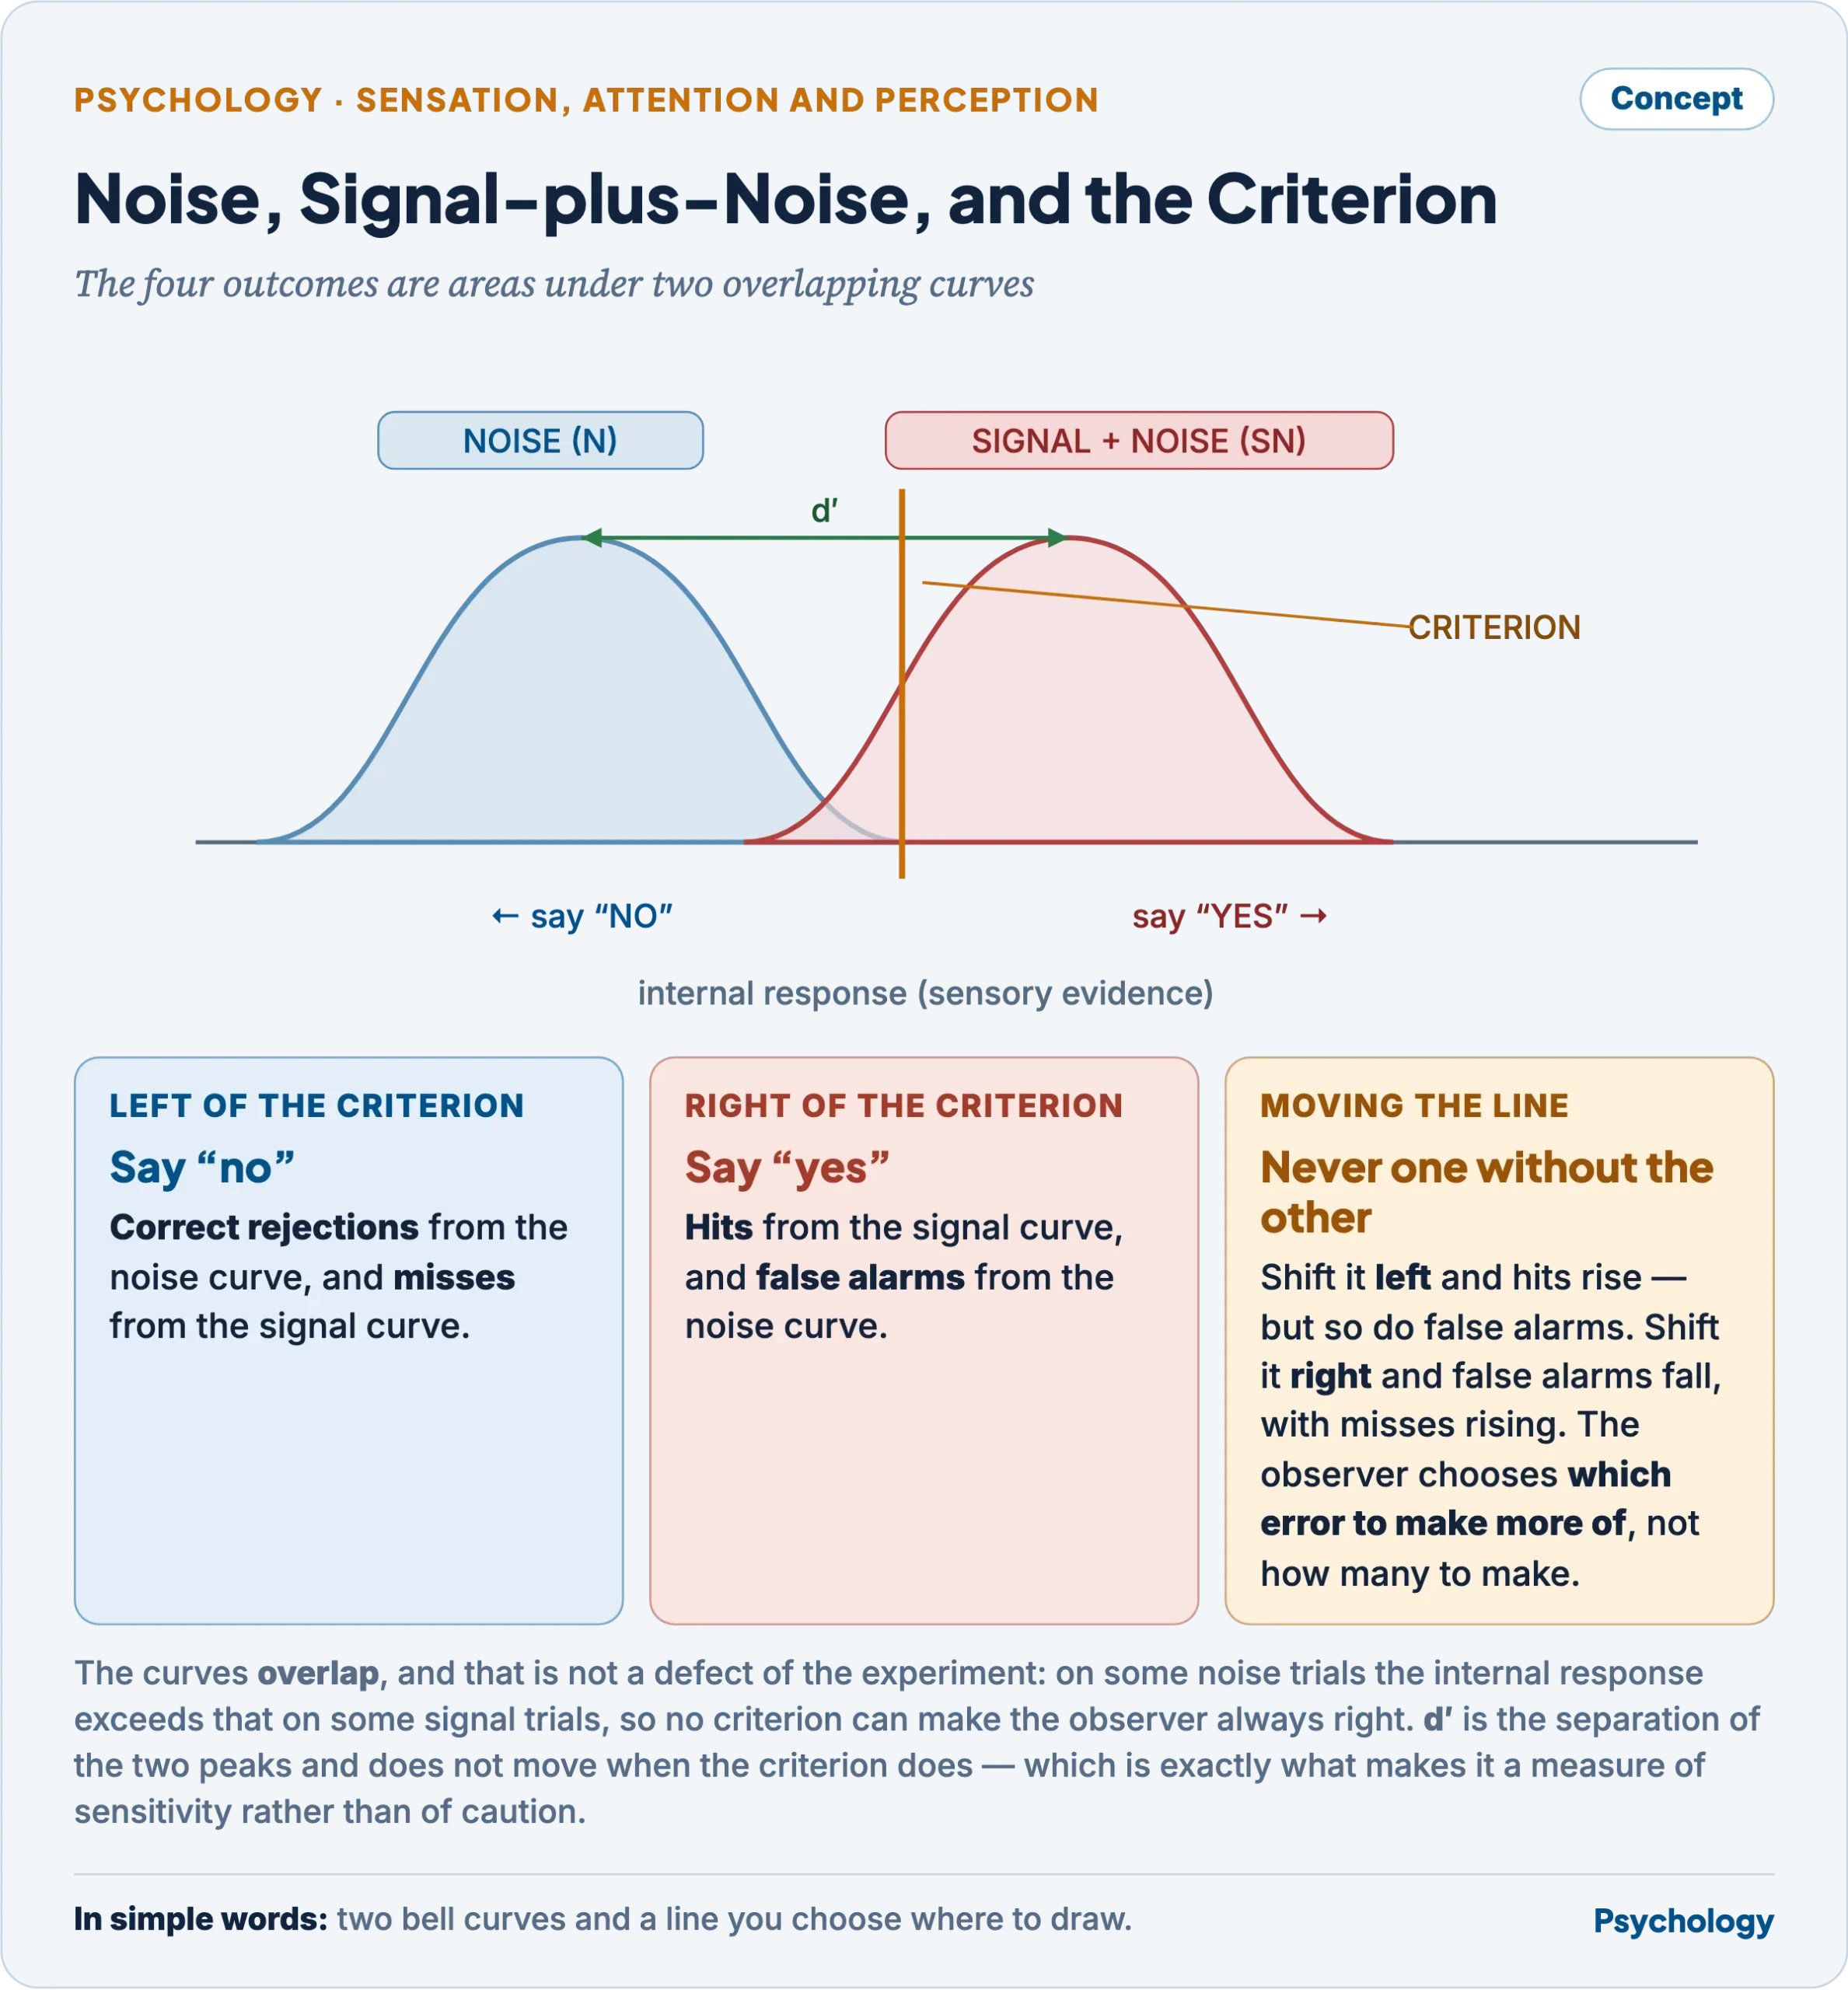
The model represents the observer’s internal response on a single dimension of sensory evidence. Two probability distributions sit on this axis.
- The noise distribution (N) describes the internal response on trials when no signal is presented — the background activity of the system.
- The signal-plus-noise distribution (SN) describes it when a signal is added. It has the same shape but a higher mean, because the signal adds to whatever noise is present.
The two overlap. That overlap is not a defect of the experiment but a fact about a noisy system, and it is why the observer cannot always be right: on some noise trials the internal response exceeds that on some signal trials.
The observer therefore adopts a criterion — a cut-off on the evidence axis. The decision rule is simple: if the internal response exceeds the criterion, respond “signal present”; if not, “absent”. The four outcomes are then areas under the two curves on either side of that line.
- Area of SN above the criterion = hits; below = misses.
- Area of N above the criterion = false alarms; below = correct rejections.
Moving the criterion leftward (liberal, lax) raises hits and false alarms together. Moving it rightward (conservative, strict) lowers both. No position gives hits without false alarms — the observer chooses only which error to make more of.
Sensitivity: d′
d′ (d-prime) is the separation between the means of the two distributions, measured in units of their standard deviation. It is the theory’s measure of sensitivity, and its defining virtue is that it does not change when the criterion moves.
`d′ = z(Hit rate) − z(False alarm rate)`
where z is the inverse normal transform. A d′ of 0 means the distributions coincide and the observer cannot discriminate at all; around 1 is modest; values above about 4 approach perfect separation.
Two consequences are worth stating. Because d′ depends on both rates, estimating sensitivity requires both — hits alone will not do. And percentage correct underestimates true sensitivity whenever bias is present, because it confounds the two; it is an acceptable index only when the observer is close to unbiased.
Bias: β and C
The second measure describes where the criterion sits, and there are two conventions.
- β (beta) is the ratio of the heights of the two distributions at the criterion — the likelihood ratio at that point. β = 1 is the neutral position where the curves cross; β > 1 is conservative (strict, few false alarms, many misses); β less than 1 is liberal.
- C is the criterion’s location expressed as a distance, and is now generally preferred because its interpretation does not depend on d′ in the way β’s does.
`C = −[z(Hit rate) + z(False alarm rate)] / 2`
C = 0 is unbiased — the criterion sits midway between the two distributions. C > 0 is conservative, C less than 0 liberal. If both z-scores shift together, the separation between them is unchanged, so d′ stays constant while C moves: that is the arithmetic expression of the theory’s central claim.
The payoff matrix and decision rules for maximising gains
The criterion is not arbitrary. A rational observer sets it from two things, and both are outside the sensory system entirely.
- The prior probability of a signal. Where signals are rare, saying “yes” is usually wrong, so the rational criterion is conservative. Where they are common, it is liberal.
- The payoff matrix — the values attached to the two correct outcomes and the costs attached to the two errors.
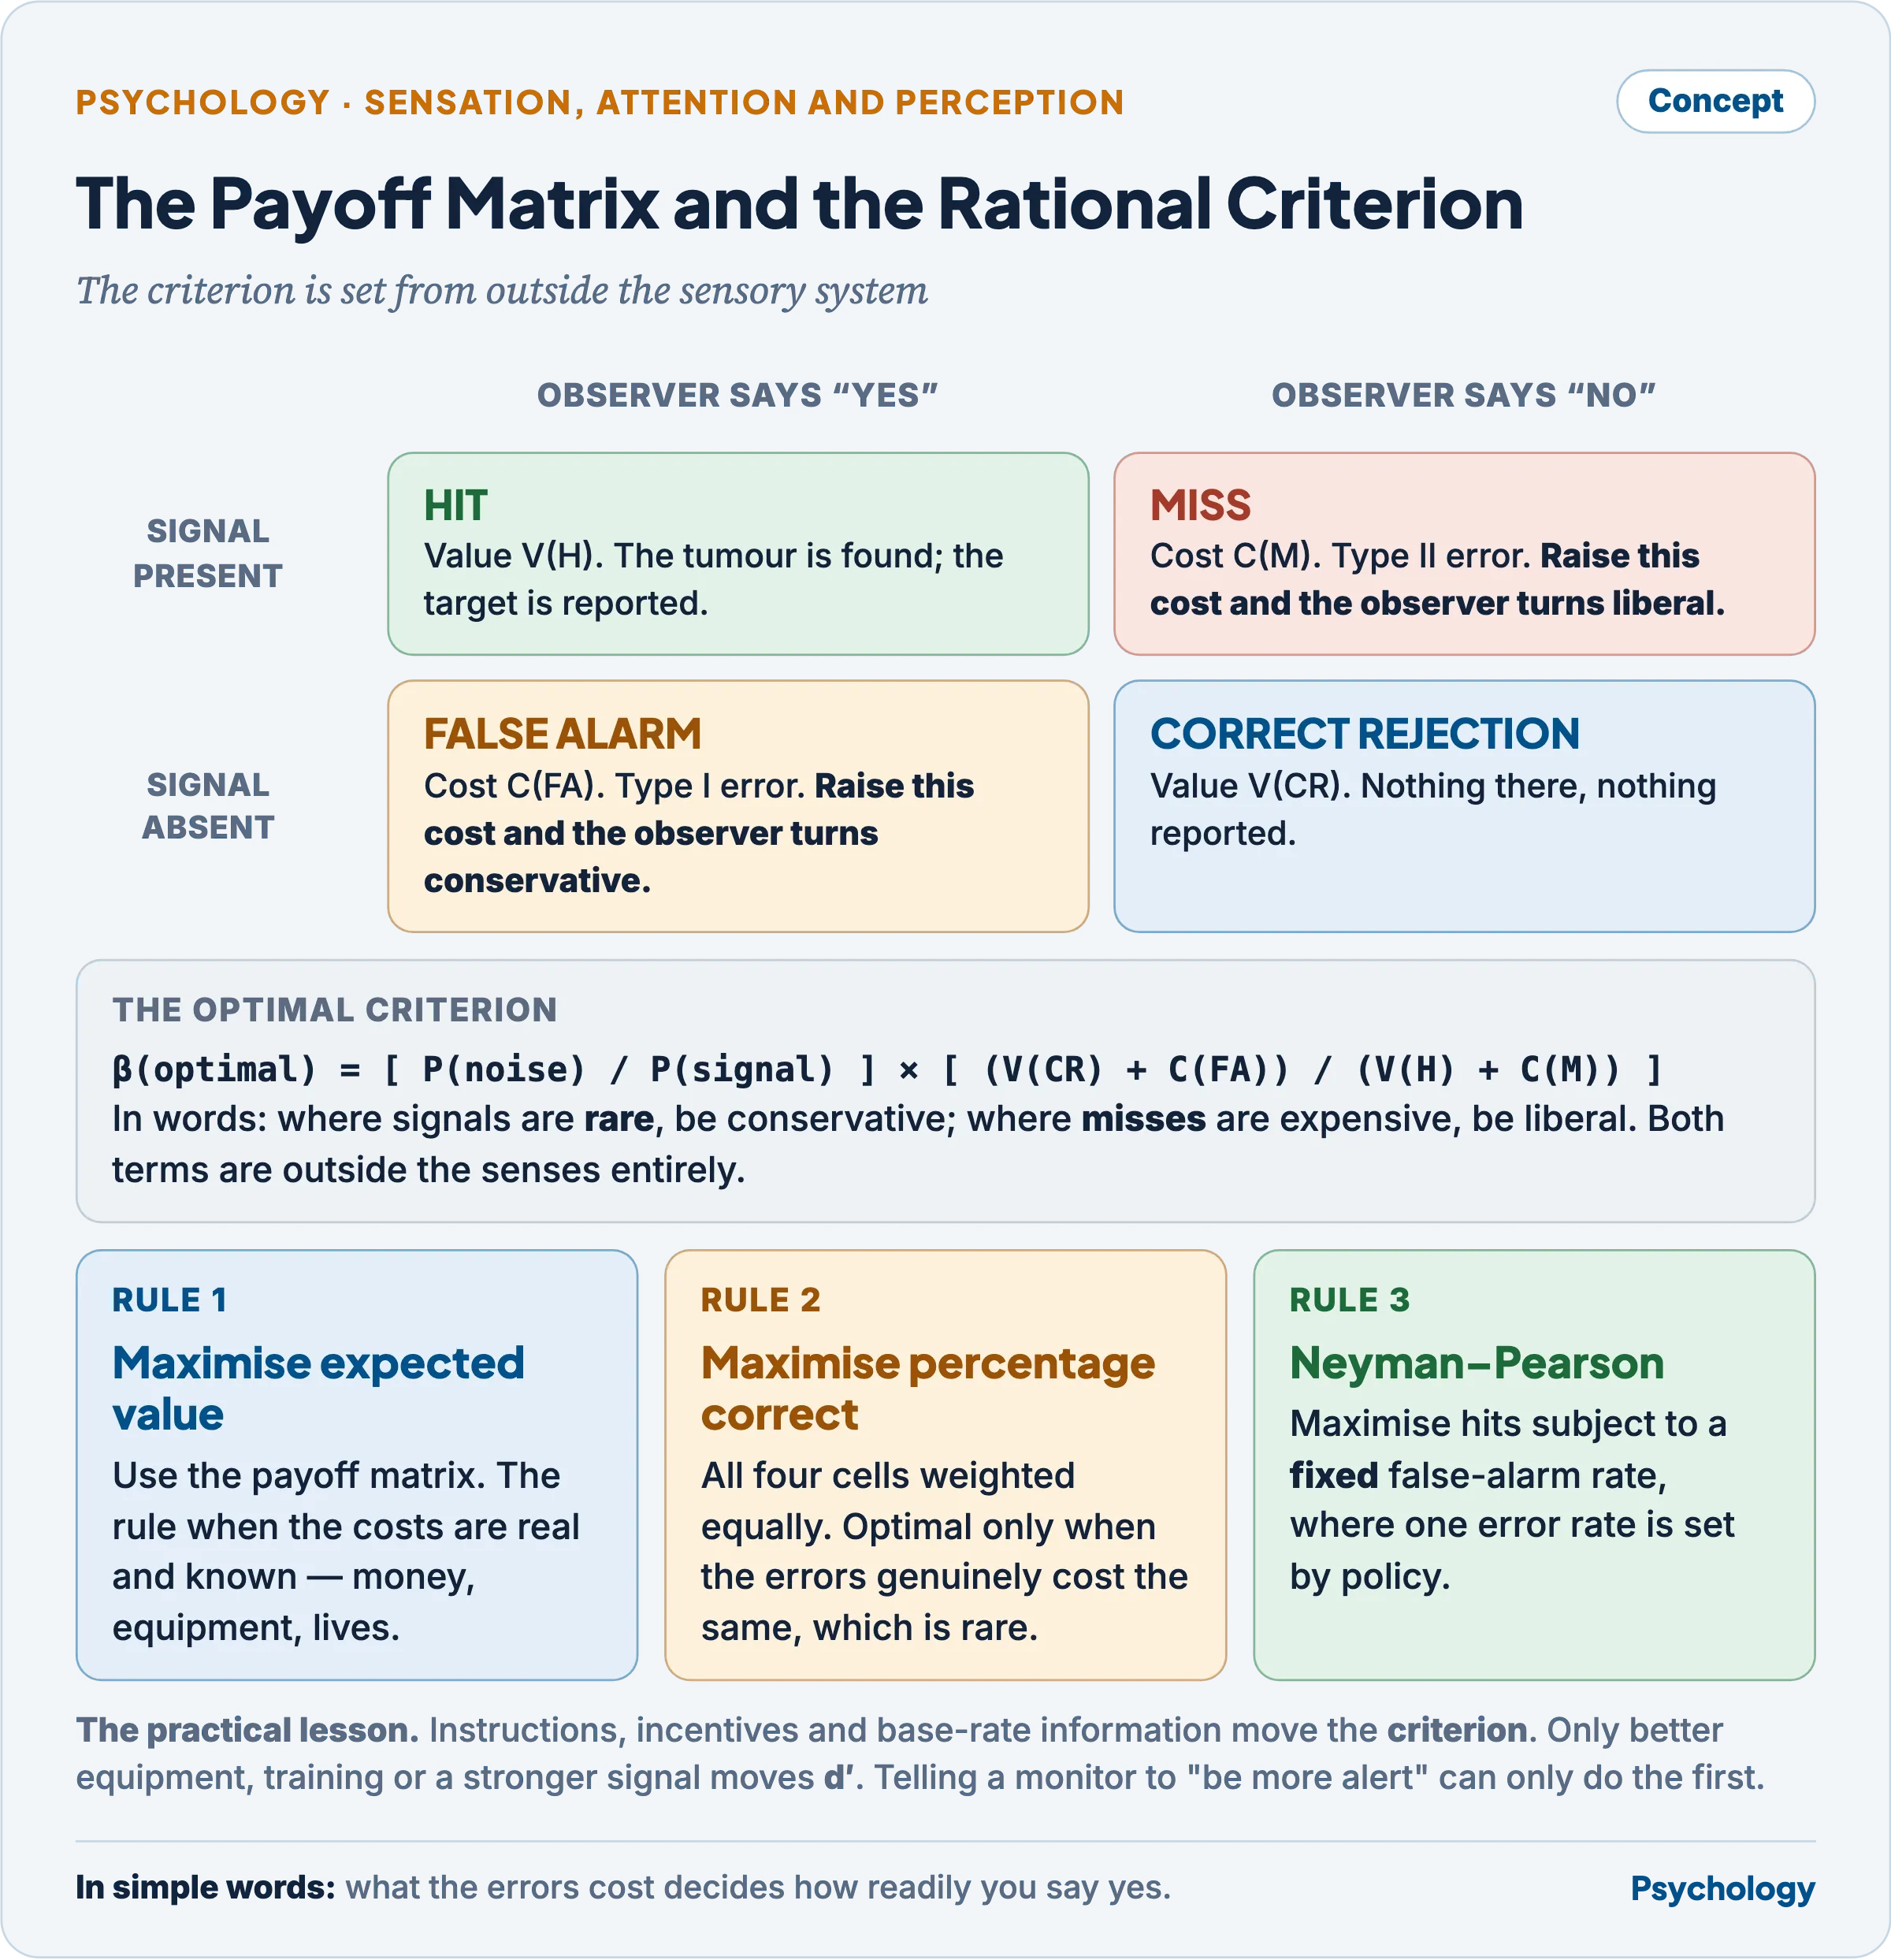
The optimal criterion, in likelihood-ratio terms, is
`β(optimal) = [P(noise) / P(signal)] × [(V(correct rejection) + C(false alarm)) / (V(hit) + C(miss))]`
which says in symbols what is obvious in words: make misses expensive and the observer turns liberal; make false alarms expensive and the observer turns conservative. Three decision rules are available, and naming which one is in force is what the question about maximising gains is asking for.
- Maximise expected value. Use the payoff matrix above. This is the rule when the costs are real and known — money, equipment, lives.
- Maximise percentage correct. A special case in which all four cells are weighted equally. Optimal only when errors genuinely cost the same, which is rare.
- Maximise hits subject to a fixed false-alarm rate — the Neyman–Pearson rule. Used where one error rate is set by policy or regulation and performance is then maximised within it, as in screening programmes with a permitted recall rate.
The practical lesson is the one that makes the theory useful: you can change behaviour without changing sensitivity. Instructions, incentives and base-rate information move the criterion. Only better equipment, better training or a stronger signal moves d′. Confusing the two produces interventions that cannot work — exhorting a monitor to “be more alert” shifts criterion and leaves sensitivity untouched.
The ROC curve
The receiver operating characteristic plots hit rate (y-axis) against false alarm rate (x-axis) as the criterion varies with sensitivity held constant. It is the single most informative display the theory produces.
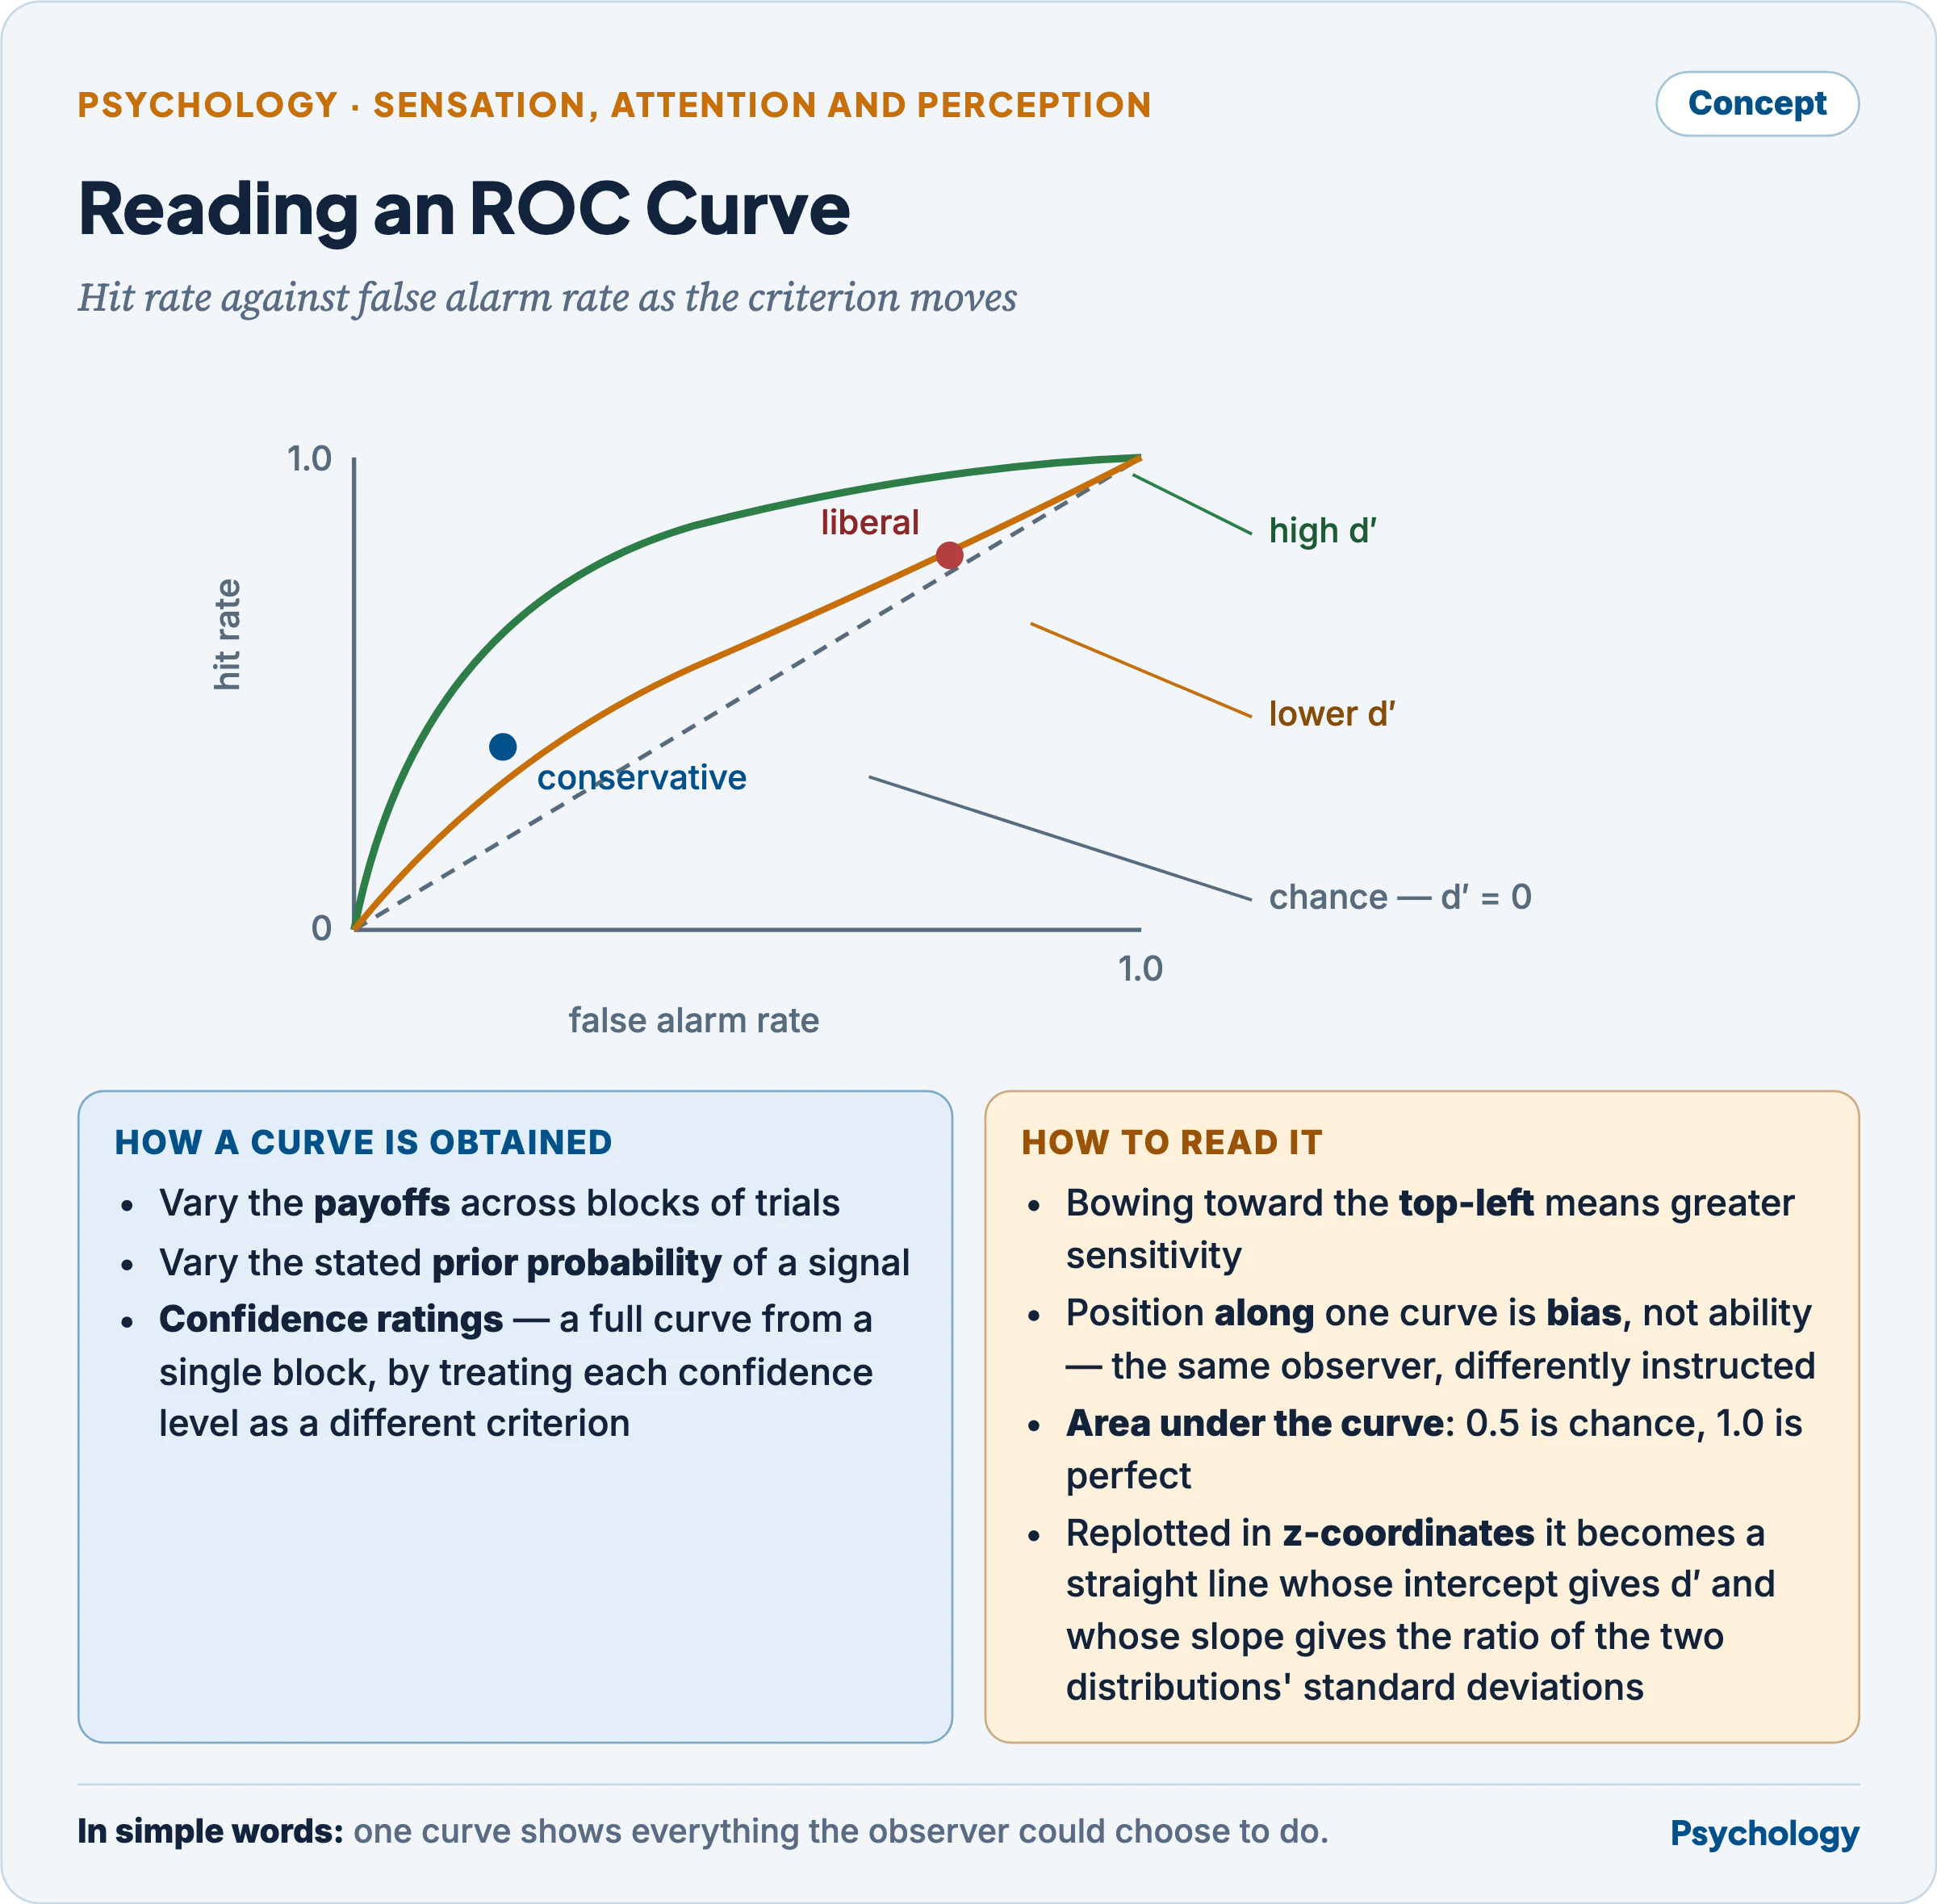
How it is obtained. The observer’s criterion must be moved while d′ is held constant, and there are three ways.
- Vary the payoffs across blocks of trials, so the rational criterion shifts.
- Vary the prior probability of a signal and tell the observer.
- Use confidence ratings — the observer rates confidence on each trial rather than answering yes or no, and each confidence level is treated as a different criterion. This yields a full curve from a single block and is by far the most efficient method.
Each criterion gives one hit-rate/false-alarm-rate pair, which is one point. The set of points is the curve.
How it is read.
- The diagonal from corner to corner is chance: hit rate equals false alarm rate, d′ = 0, no discrimination whatever.
- The further the curve bows toward the upper-left corner, the greater the sensitivity. The upper-left corner itself is perfect performance — all hits, no false alarms.
- Position along a curve is bias, not sensitivity. The upper-right end is a liberal criterion, the lower-left a conservative one. Two observers at different points of the same curve differ in bias and not in ability.
- Area under the curve (AUC) is a sensitivity measure requiring no distributional assumptions: 0.5 is chance, 1.0 is perfect. It is interpretable as the probability that a randomly chosen signal trial produces a higher internal response than a randomly chosen noise trial.
- Plotted in z-coordinates the curve becomes a straight line whose intercept gives d′ and whose slope gives the ratio of the two standard deviations — so an ROC that is symmetric about the minor diagonal indicates equal variance, and an asymmetric one indicates the signal distribution is more variable than the noise distribution, which is common in practice.
Vigilance
Vigilance is the maintenance of attention to detect infrequent, unpredictable signals over a prolonged period — the radar operator, the sonar listener, the sentry, the quality inspector, the radiologist.
The field begins with a practical problem. Norman Mackworth (1948) was asked to determine the optimum watch length for airborne radar operators, and built the Mackworth Clock Test: a pointer steps regularly around a blank clock face, and the observer reports the occasional double-step. His finding, reported in The Breakdown of Vigilance During Prolonged Visual Search, is the foundational result of the field: detection declines markedly within the first half hour on watch and continues to fall thereafter. This is the vigilance decrement.
What signal detection theory contributed
Before SDT, the decrement was described simply as falling detection rate and explained as “attention declining”. The theory’s contribution was to show that a falling detection rate has two possible causes, and that the older description could not distinguish them.
- A genuine loss of sensitivity — d′ falls, the observer really is discriminating less well.
- A conservative shift of criterion — the observer becomes less willing to report, so both hits and false alarms fall while d′ is unchanged.
These require opposite remedies, which is why the distinction is practical and not merely technical. Decades of work beginning in the early 1960s addressed exactly this. The broad finding is that event rate matters: where events are infrequent the decrement is largely a criterion shift, and as event rate rises a genuine sensitivity decline appears. The sensitivity account has been challenged recently, partly because the standard vigilance tasks produce very low false-alarm rates, which makes d′ and C unreliable to estimate — a methodological problem the theory itself exposes.
How vigilance can be improved
Mackworth’s own monograph already distinguished what works from what does not, and the pattern fits the theory exactly.
- Knowledge of results — giving the observer feedback on detections — substantially reduces or removes the decrement.
- A salient interruption, such as a telephone call or a rest break, restores performance.
- Exhortation has no effect. Urging the observer to be more attentive changes nothing. This is the finding that matters most, and the theory explains it: exhortation can only move the criterion, and where the loss is in sensitivity, moving the criterion cannot recover it.
The applied programme that follows is specific: shorten watches; schedule breaks; introduce artificial signals and feedback to keep the event rate up and calibrate the criterion; raise signal salience by display design rather than by instruction; and where misses are costly, set the payoff structure to make the criterion deliberately liberal and accept the false alarms as the price.
Applications beyond the laboratory
The theory applies wherever a decision must be made under uncertainty about whether something is present, which is why it travelled so far beyond psychophysics.
- Medical diagnosis and screening. A radiologist reading mammograms is setting a criterion; the ROC curve is now the standard way to evaluate a diagnostic test, and sensitivity and specificity are the hit rate and the correct rejection rate under other names.
- Recognition memory. “Have you seen this item before?” is formally a detection task. Old items are signal, new items noise, and d′ separates genuine memory strength from a willingness to say “old” — which is how false memory and eyewitness confidence are now analysed.
- Eyewitness identification. Whether a lineup produces identifications depends on the witness’s criterion as well as their memory, and lineup procedures are evaluated by ROC analysis for exactly that reason.
- Personnel selection. This works at two levels, and the second is the one usually missed. First, select operators with high d′ for the relevant display, and train criterion setting separately, since the two are independent. Second — and this is the less obvious point — the selection decision is itself a detection problem: accepting a candidate who succeeds is a hit, accepting one who fails is a false alarm, rejecting one who would have succeeded is a miss. The cut-off score is a criterion, and where it should sit depends on the base rate of suitable candidates and the selection ratio, together with the relative costs of the two errors. In defence selection a miss — rejecting a capable candidate — costs much less than a false alarm admitting an unsuitable one into a safety-critical role, which justifies a conservative cut-off.
- Clinical judgement, industrial inspection, air traffic control and airport security are all the same structure, and in each the rational criterion is set by the asymmetry of the costs.
- Psychophysics itself was reformed by it: the classical threshold is now generally replaced by d′ at a specified level.
Criticisms and limitations
- Normal, equal-variance assumptions. The model requires them, and in practice the signal distribution is often more variable than the noise distribution, which makes the simple d′ formula an approximation. The unequal-variance case requires a full ROC to detect, which most studies do not collect.
- Extreme rates break the arithmetic. A hit rate of 1.0 or a false alarm rate of 0 gives an infinite z-score and an undefined d′, so corrections must be applied — and these are arbitrary, and matter most in exactly the low-false-alarm conditions that vigilance research produces.
- A stable criterion is assumed, whereas observers drift and adjust trial by trial, which inflates apparent variability.
- A theory of the decision, not the sensory process. The model is a formal account of how evidence is converted into a response; it says nothing about how the evidence is generated, and it is compatible with many different physiological accounts.
- Only approximate rationality. Observers do not set β optimally even when the payoffs are stated; they characteristically show conservatism, moving the criterion in the right direction but not far enough.
- An unresolved measurement problem. Because the standard tasks yield so few false alarms, the central question of whether the decrement is sensitivity or criterion remains contested after seventy-five years, and recent reviews have argued the sensitivity account may have been overstated for precisely this reason.
- It cannot settle what the costs are. The theory tells you the optimal criterion given a payoff matrix; deciding what a missed tumour or a wrongful identification is worth relative to a false alarm is a moral and political judgement, not a psychological one, and the theory’s appearance of objectivity can conceal that the hard part was assumed rather than solved.
Previous Year Questions
- 2024Discuss the signal detection theory (SDT) with reference to perceptual vigilance task performance.
- 2018Discuss signal detection theory and explain its applications.
- 2015Demonstrate with suitable examples how the signal detection theory has helped in modifying the process of vigilance.
- 2012Discuss the ‘pay-off matrix’ in relation to the signal detection theory.
- 2011How does signal-detection theory envisage the decision process? In what other areas of psychology can it be applied?
- 2009Distinguish the application of signal detection theory in the selection process of defence personnel. How do you get and interpret ROC curve?
- 2007What are the theoretical and practical implications of research on signal detection and vigilance? Discuss in the light of experimental studies.
- 2001Describe the decision rules employed by an individual for maximizing his gains. Also explain the uses of ROC curves.