

Official syllabusPaper II · Unit 1 · Psychological Measurement of Individual Differences
The nature of individual differences.
Definition
“Variations or deviations from the average of the group, with respect to the mental or physical characters, occurring in the individual member of the group.”
Drever (1952)
People differ on every psychological characteristic yet measured, and the differences are lawful: they have a typical shape, identifiable causes and a measurable size. Recognising this turned variation from a nuisance into the subject matter of testing, and it remains the rationale for tests, vocational guidance and India’s selection and certification machinery.
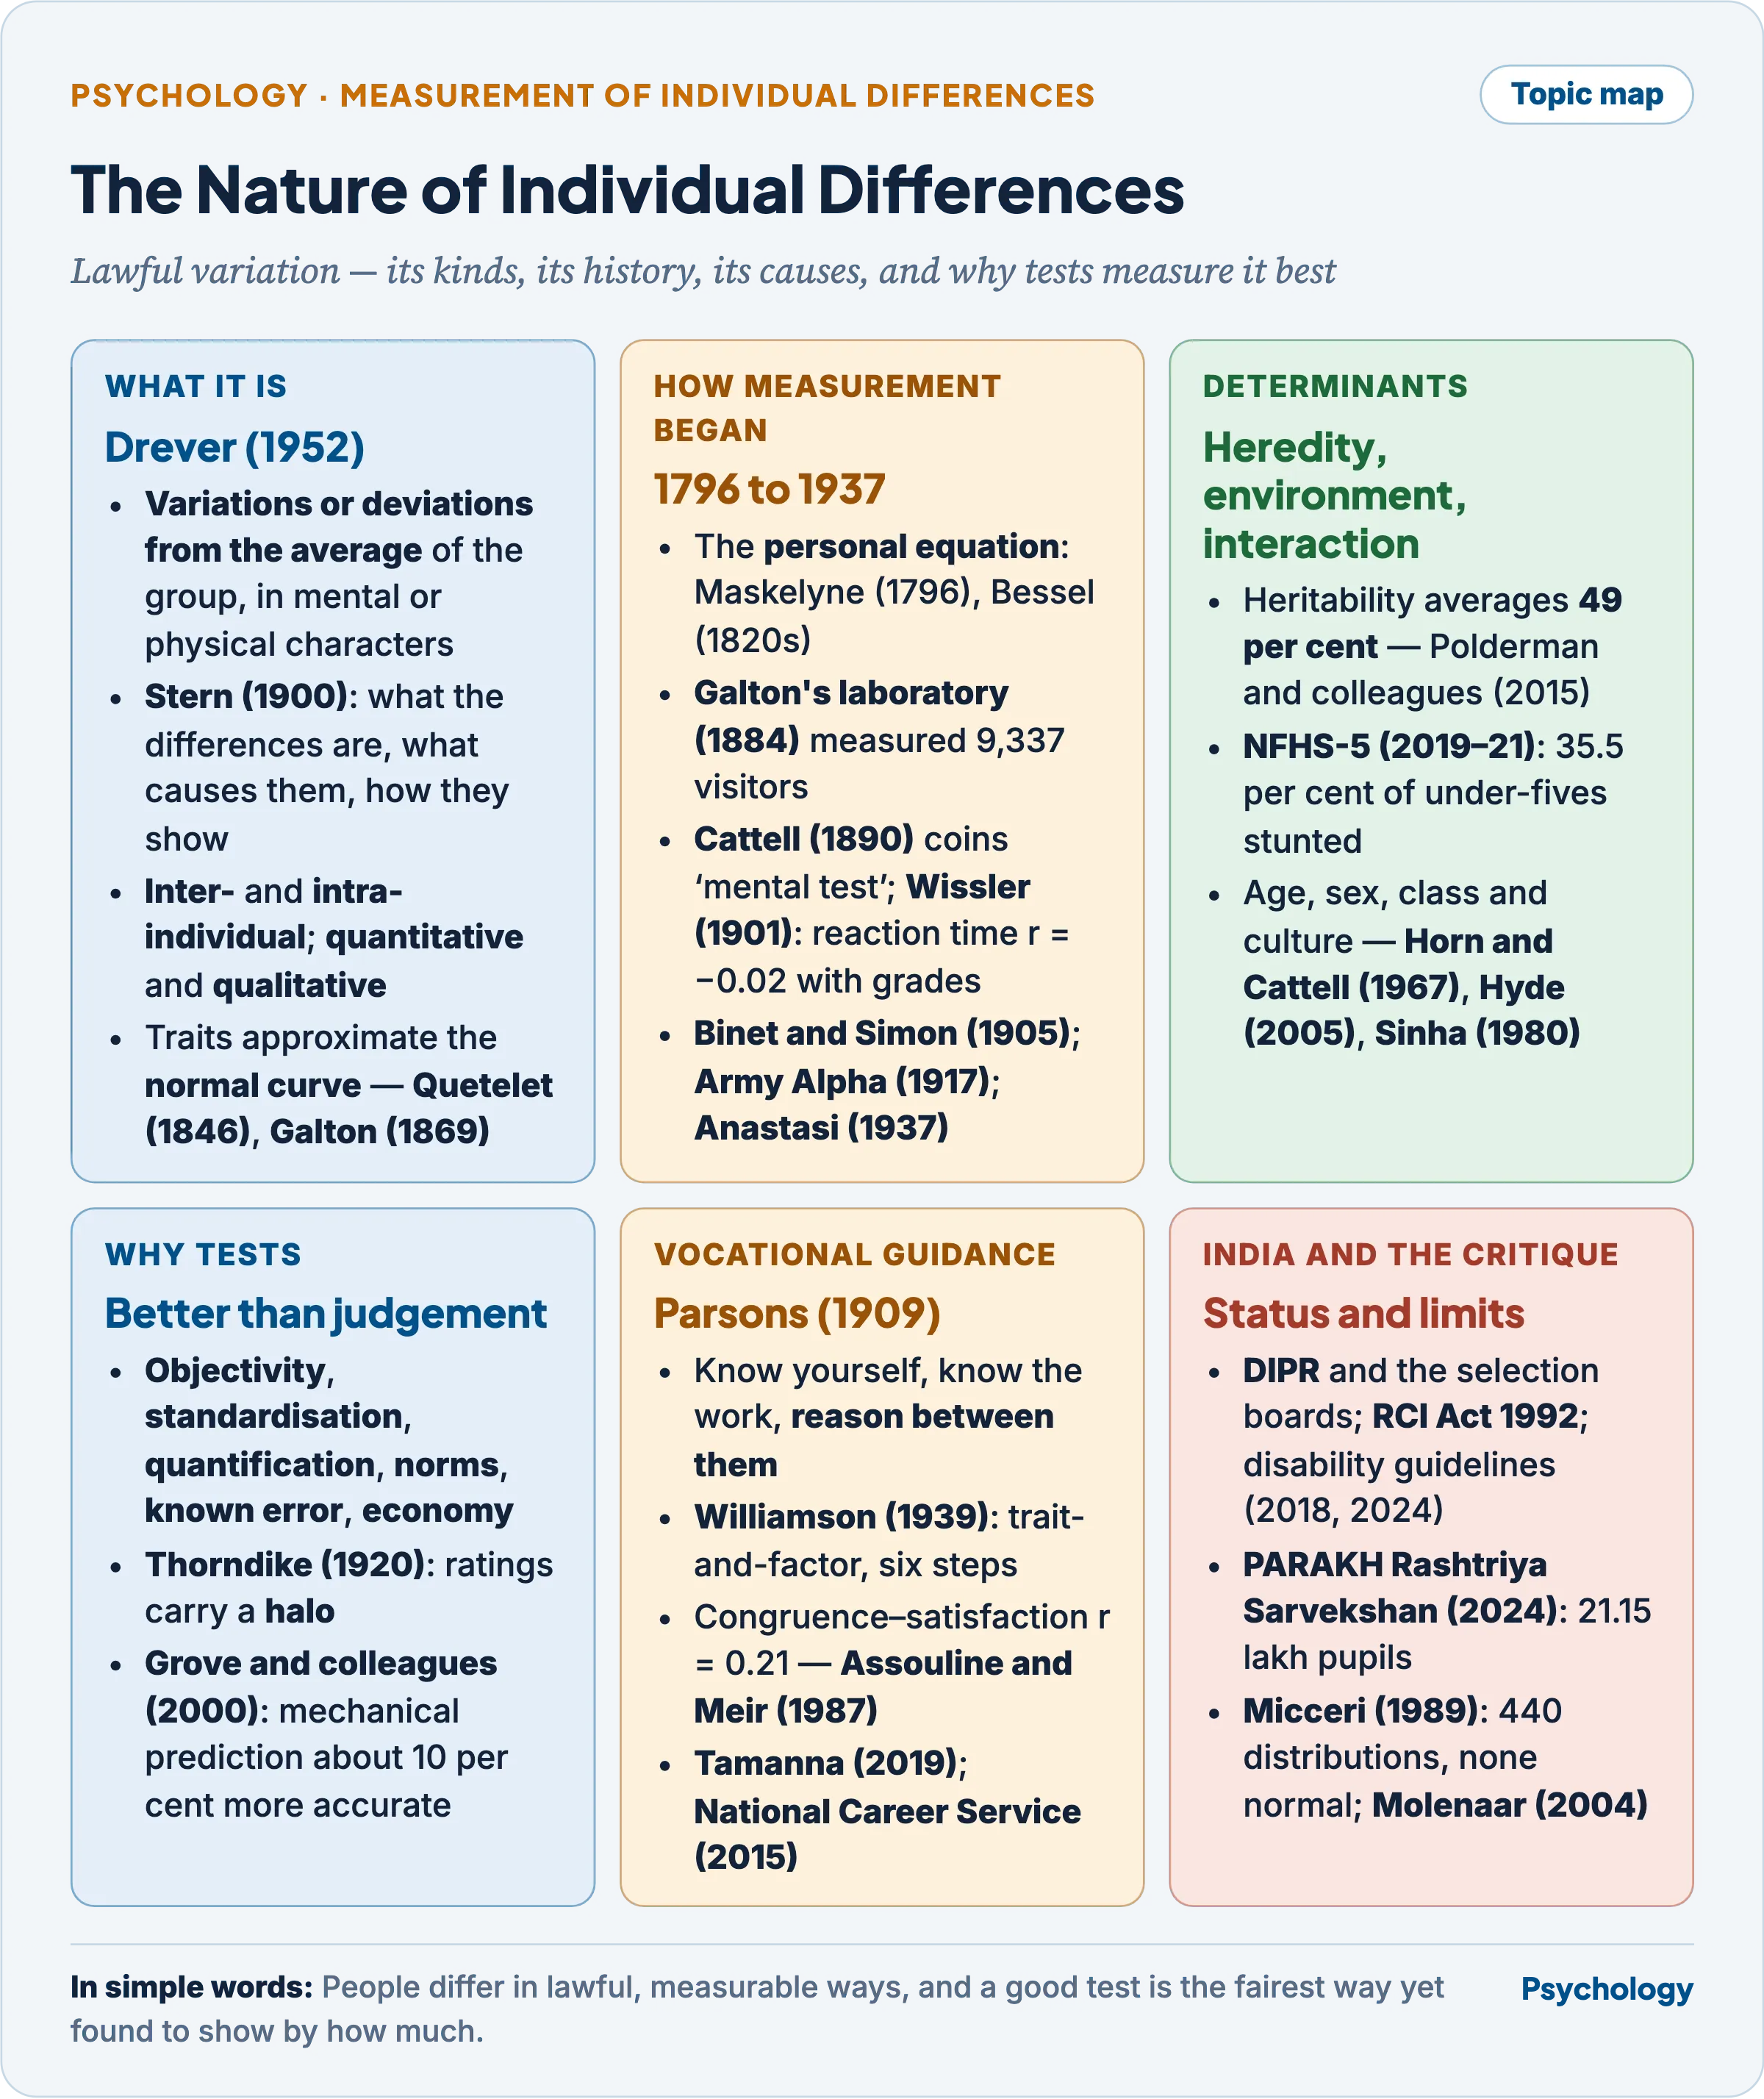
Tests, guidance and selection are worth having only because the differences in the first box are stable, measurable and consequential.
The nature of individual differences
- Stern (1900) named differential psychology and gave it three tasks: what the differences are, what causes them, and how they show themselves — the last yielding, in his words, “a psychological symptomatology and diagnostic”, which is testing.
- Two attitudes to variation divide the history. Quetelet (1835) treated deviation from his homme moyen, the average man, as error around a type; Galton (1869) treated the deviation itself as the thing to be explained.
- Cronbach (1957): “The correlational psychologist is in love with just those variables the experimenter left home to forget.” The experimenter files individual variation under error variance; the differential psychologist studies it.
Kinds of individual differences
- Inter-individual differences lie between persons on the same trait — two pupils’ numerical aptitude. They are what norms, selection and ranking use.
- Intra-individual differences lie within one person, across traits (a profile strong in verbal reasoning, weak in spatial) or across time (state against trait). Aptitude batteries report profiles to capture them.
- Stern (1911) crossed traits with persons to give four research schemes.
- Variation research — one trait across many persons; correlation research — two or more traits across many persons.
- Psychography — many traits in one person; comparison research — many traits in two or more persons. The first pair became psychometrics; the second, the idiographic tradition.
- Quantitative differences are of degree along a continuum (more or less anxious); qualitative differences are of kind (a different strategy, a categorical condition). Most measured traits behave as continua, so “types” are regions of a distribution, not separate groups.
- Individual and group differences must be kept apart: group differences lie between means, and the spread within each group is usually far larger. Hyde (2005), reviewing 46 meta-analyses, found 78 per cent of 124 sex-difference effect sizes small or close to zero.
Trait distribution and the normal curve
- Quetelet (1846) fitted the normal “law of deviation” to the chest girths of 5,738 Scottish soldiers. Galton (1869), in Hereditary Genius, extended it by analogy to “natural ability”, dividing men into equal-interval grades above and below the average.
- In Galton’s table the highest named grade, G, held about one man in 79,000.
- A trait produced by many small, independent influences — genes and experiences adding up — approximates a normal distribution: symmetrical, densest at the mean, with about two-thirds of cases within one standard deviation and almost all within three.
- The shape is a working assumption, not a law: Galton’s step from chest girth to mental capacity was an untested analogy (see Criticisms and limitations).
The origin of the measurement of individual differences
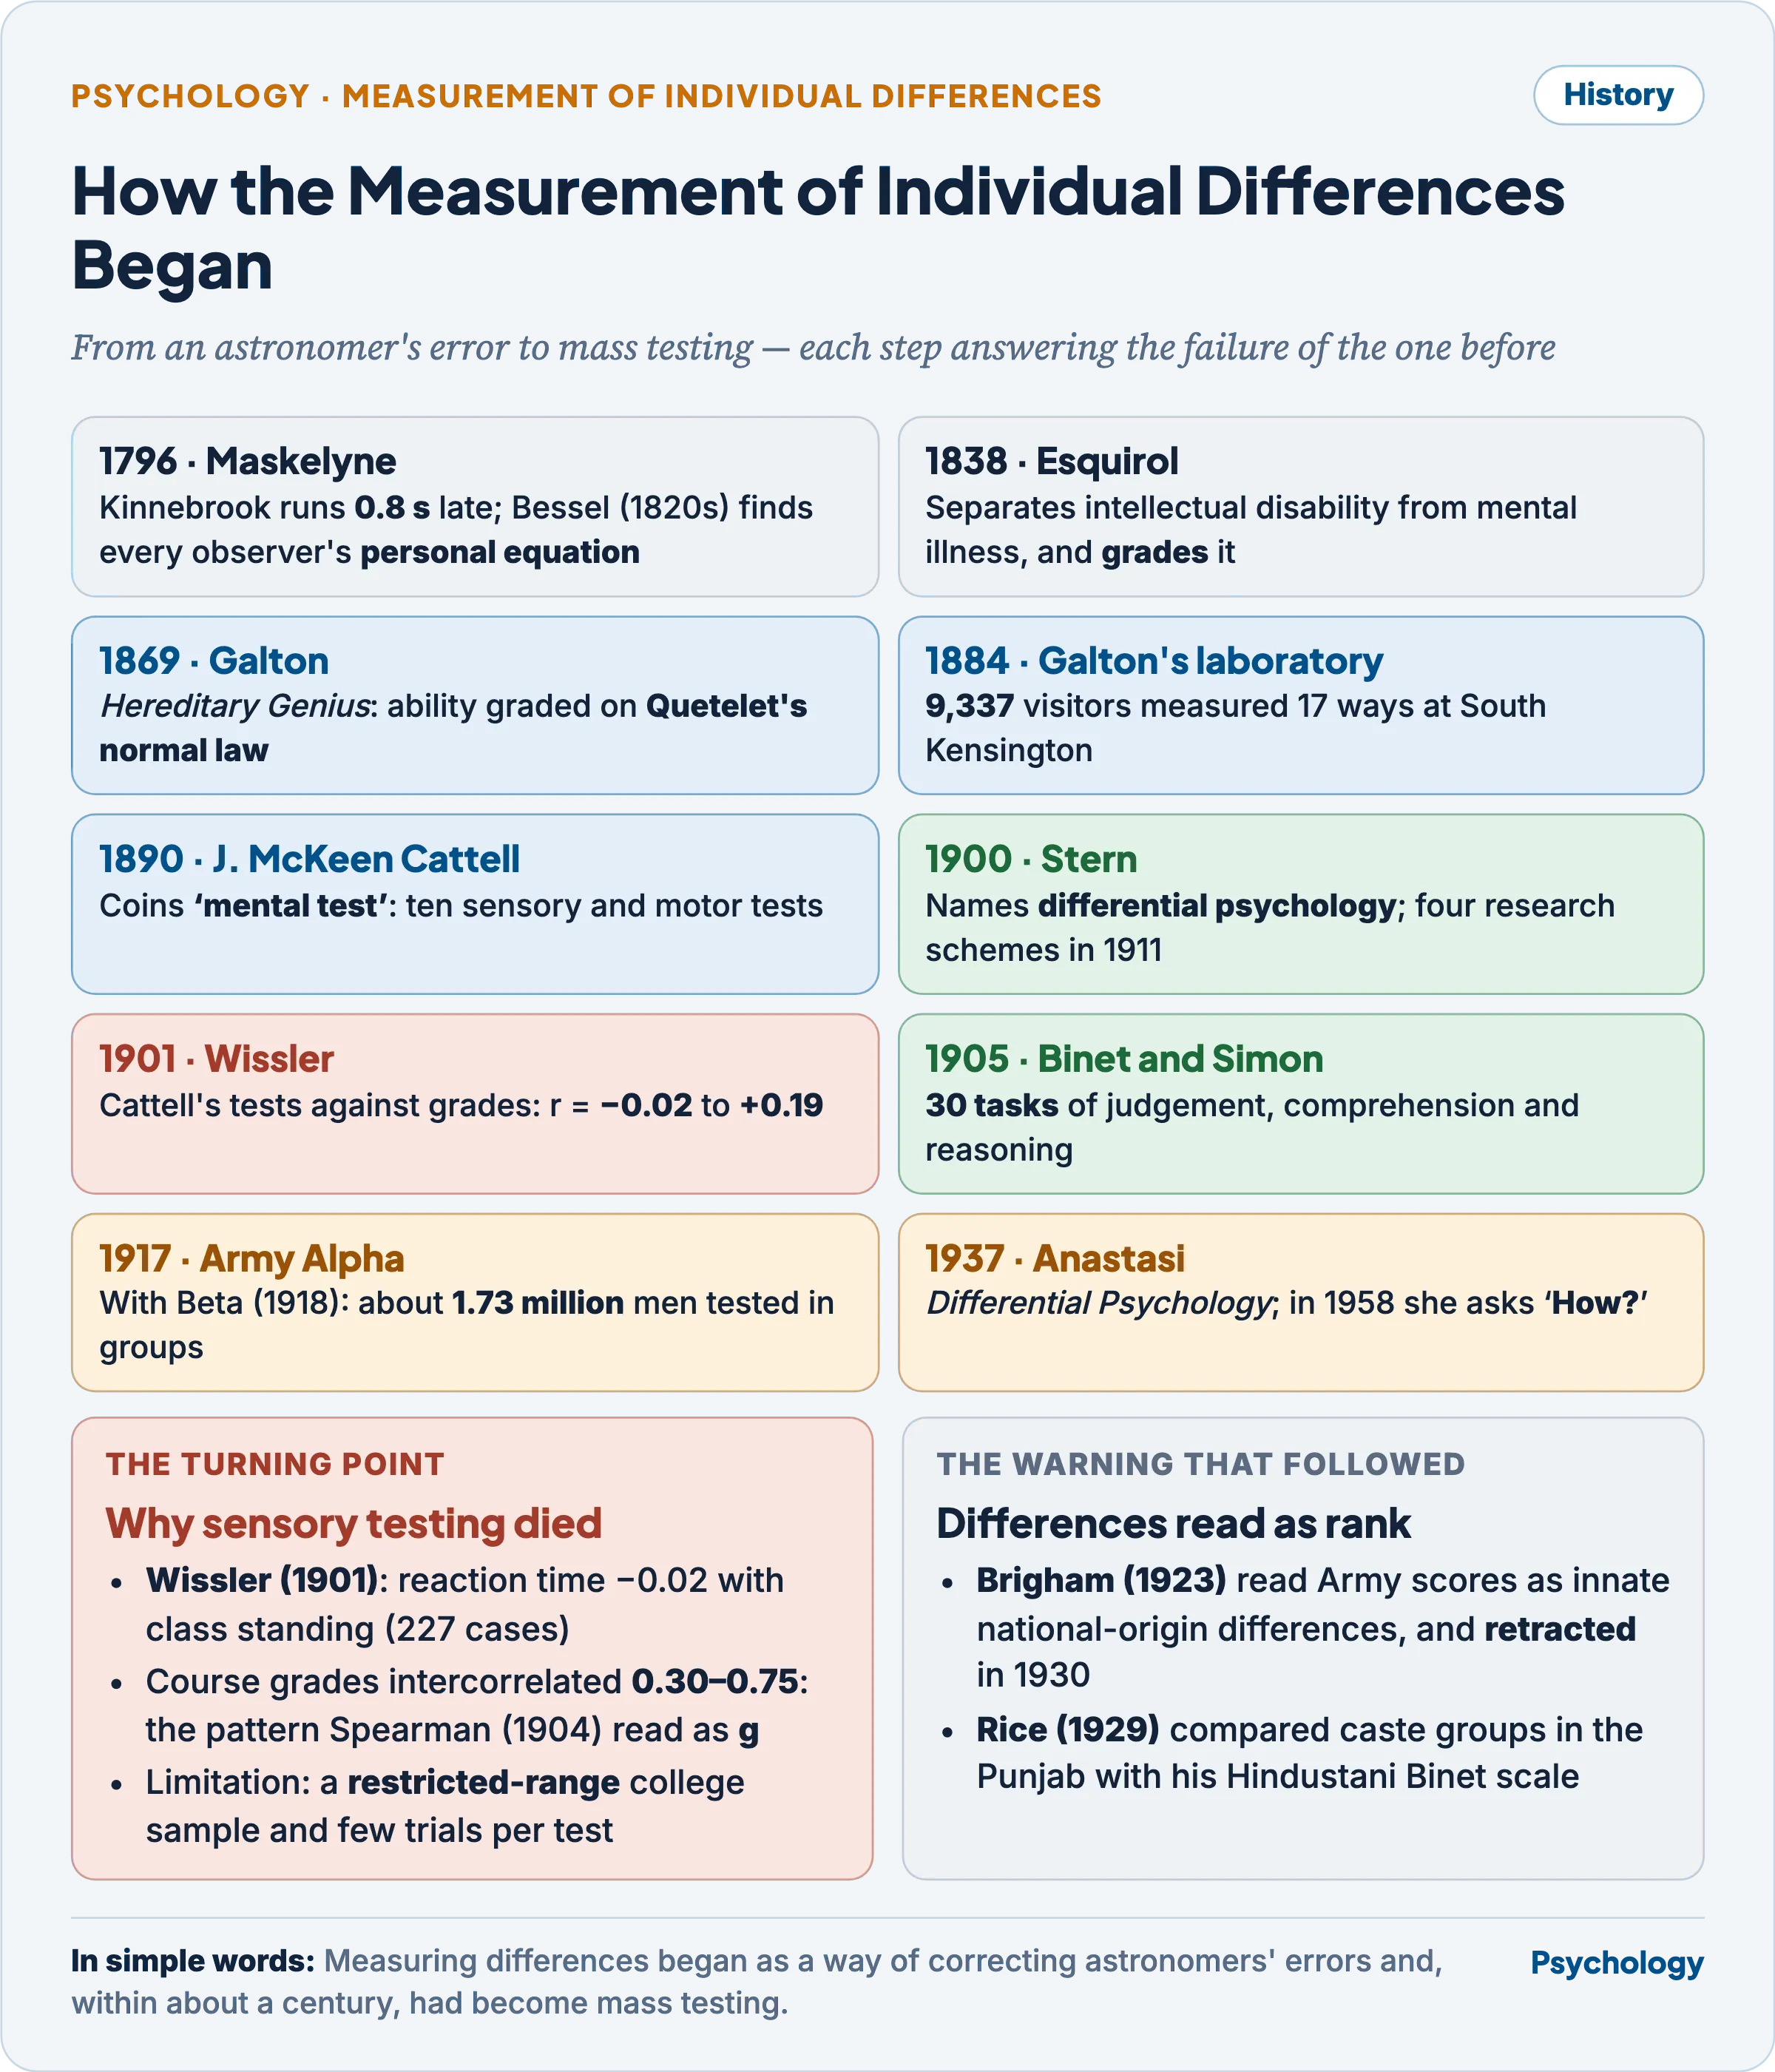
Each step answered the last one’s failure: sensory tests did not predict grades, so Binet sampled judgement; individual testing was slow, so the Army tested groups.
- The personal equation. Maskelyne (1796), at Greenwich, dismissed his assistant Kinnebrook, whose star-transit timings ran eight-tenths of a second behind his own. Bessel (1820s) then showed every observer had a stable, characteristic lag — the first measured individual difference in reaction time.
- Clinical roots. Esquirol (1838) separated intellectual disability from mental illness and graded its severity; Seguin (1866) built sense-training and form-board methods later absorbed into performance tests.
- Galton made individual differences a science.
- Hereditary Genius (1869) traced eminence through families; his anthropometric laboratory at the International Health Exhibition, South Kensington (1884), measured 9,337 visitors in 17 ways each, for threepence.
- He devised correlation (Galton, 1888) and the questionnaire. Limitation: Galton (1885) conceded his volunteers were not random specimens of the crowd, and the programme assumed that sensory keenness indexes intellect.
- J. McKeen Cattell (1890) coined “mental test” in Mind: “Psychology cannot attain the certainty and exactness of the physical sciences, unless it rests on a foundation of experiment and measurement.” His ten tests ran from dynamometer pressure to letters remembered at one hearing.
- Wissler (1901) — the study that ended the sensory programme.
- Correlated Cattell’s tests with the class standing of Columbia students: reaction time −0.02 (227 cases), the best test, logical memory, +0.19 (86 cases).
- Course grades correlated 0.30 to 0.75 with one another, the pattern Spearman (1904) would read as a general factor.
- Limitation: a restricted-range college sample and few trials per test depressed every correlation.
- Binet and Simon (1905), answering a 1904 French ministerial commission on children needing special instruction, replaced sensory tasks with 30 tasks of judgement, comprehension and reasoning in rising difficulty; the 1908 revision grouped them by age.
- Stern (1912) turned mental age into a quotient; both are treated in Measurement of Intelligence – Methods and Instruments and IQ, Deviation IQ and the Constancy of IQ (Paper I).
- Army Alpha (1917) for literate recruits and the non-verbal Army Beta (1918), built by Yerkes’s committee, tested about 1.73 million men by January 1919 — the birth of mass group testing.
- Limitation: Brigham (1923) read the scores as proof of innate national-origin differences, then retracted the analysis (Brigham, 1930).
- Woodworth (1919) published the Personal Data Sheet, 116 yes–no items for wartime screening: the first self-report inventory.
- Anastasi (1937) consolidated the field in Differential Psychology; Anastasi (1958) replaced the “Which one?” and “How much?” of heredity and environment with “How?”.
Determinants of individual differences
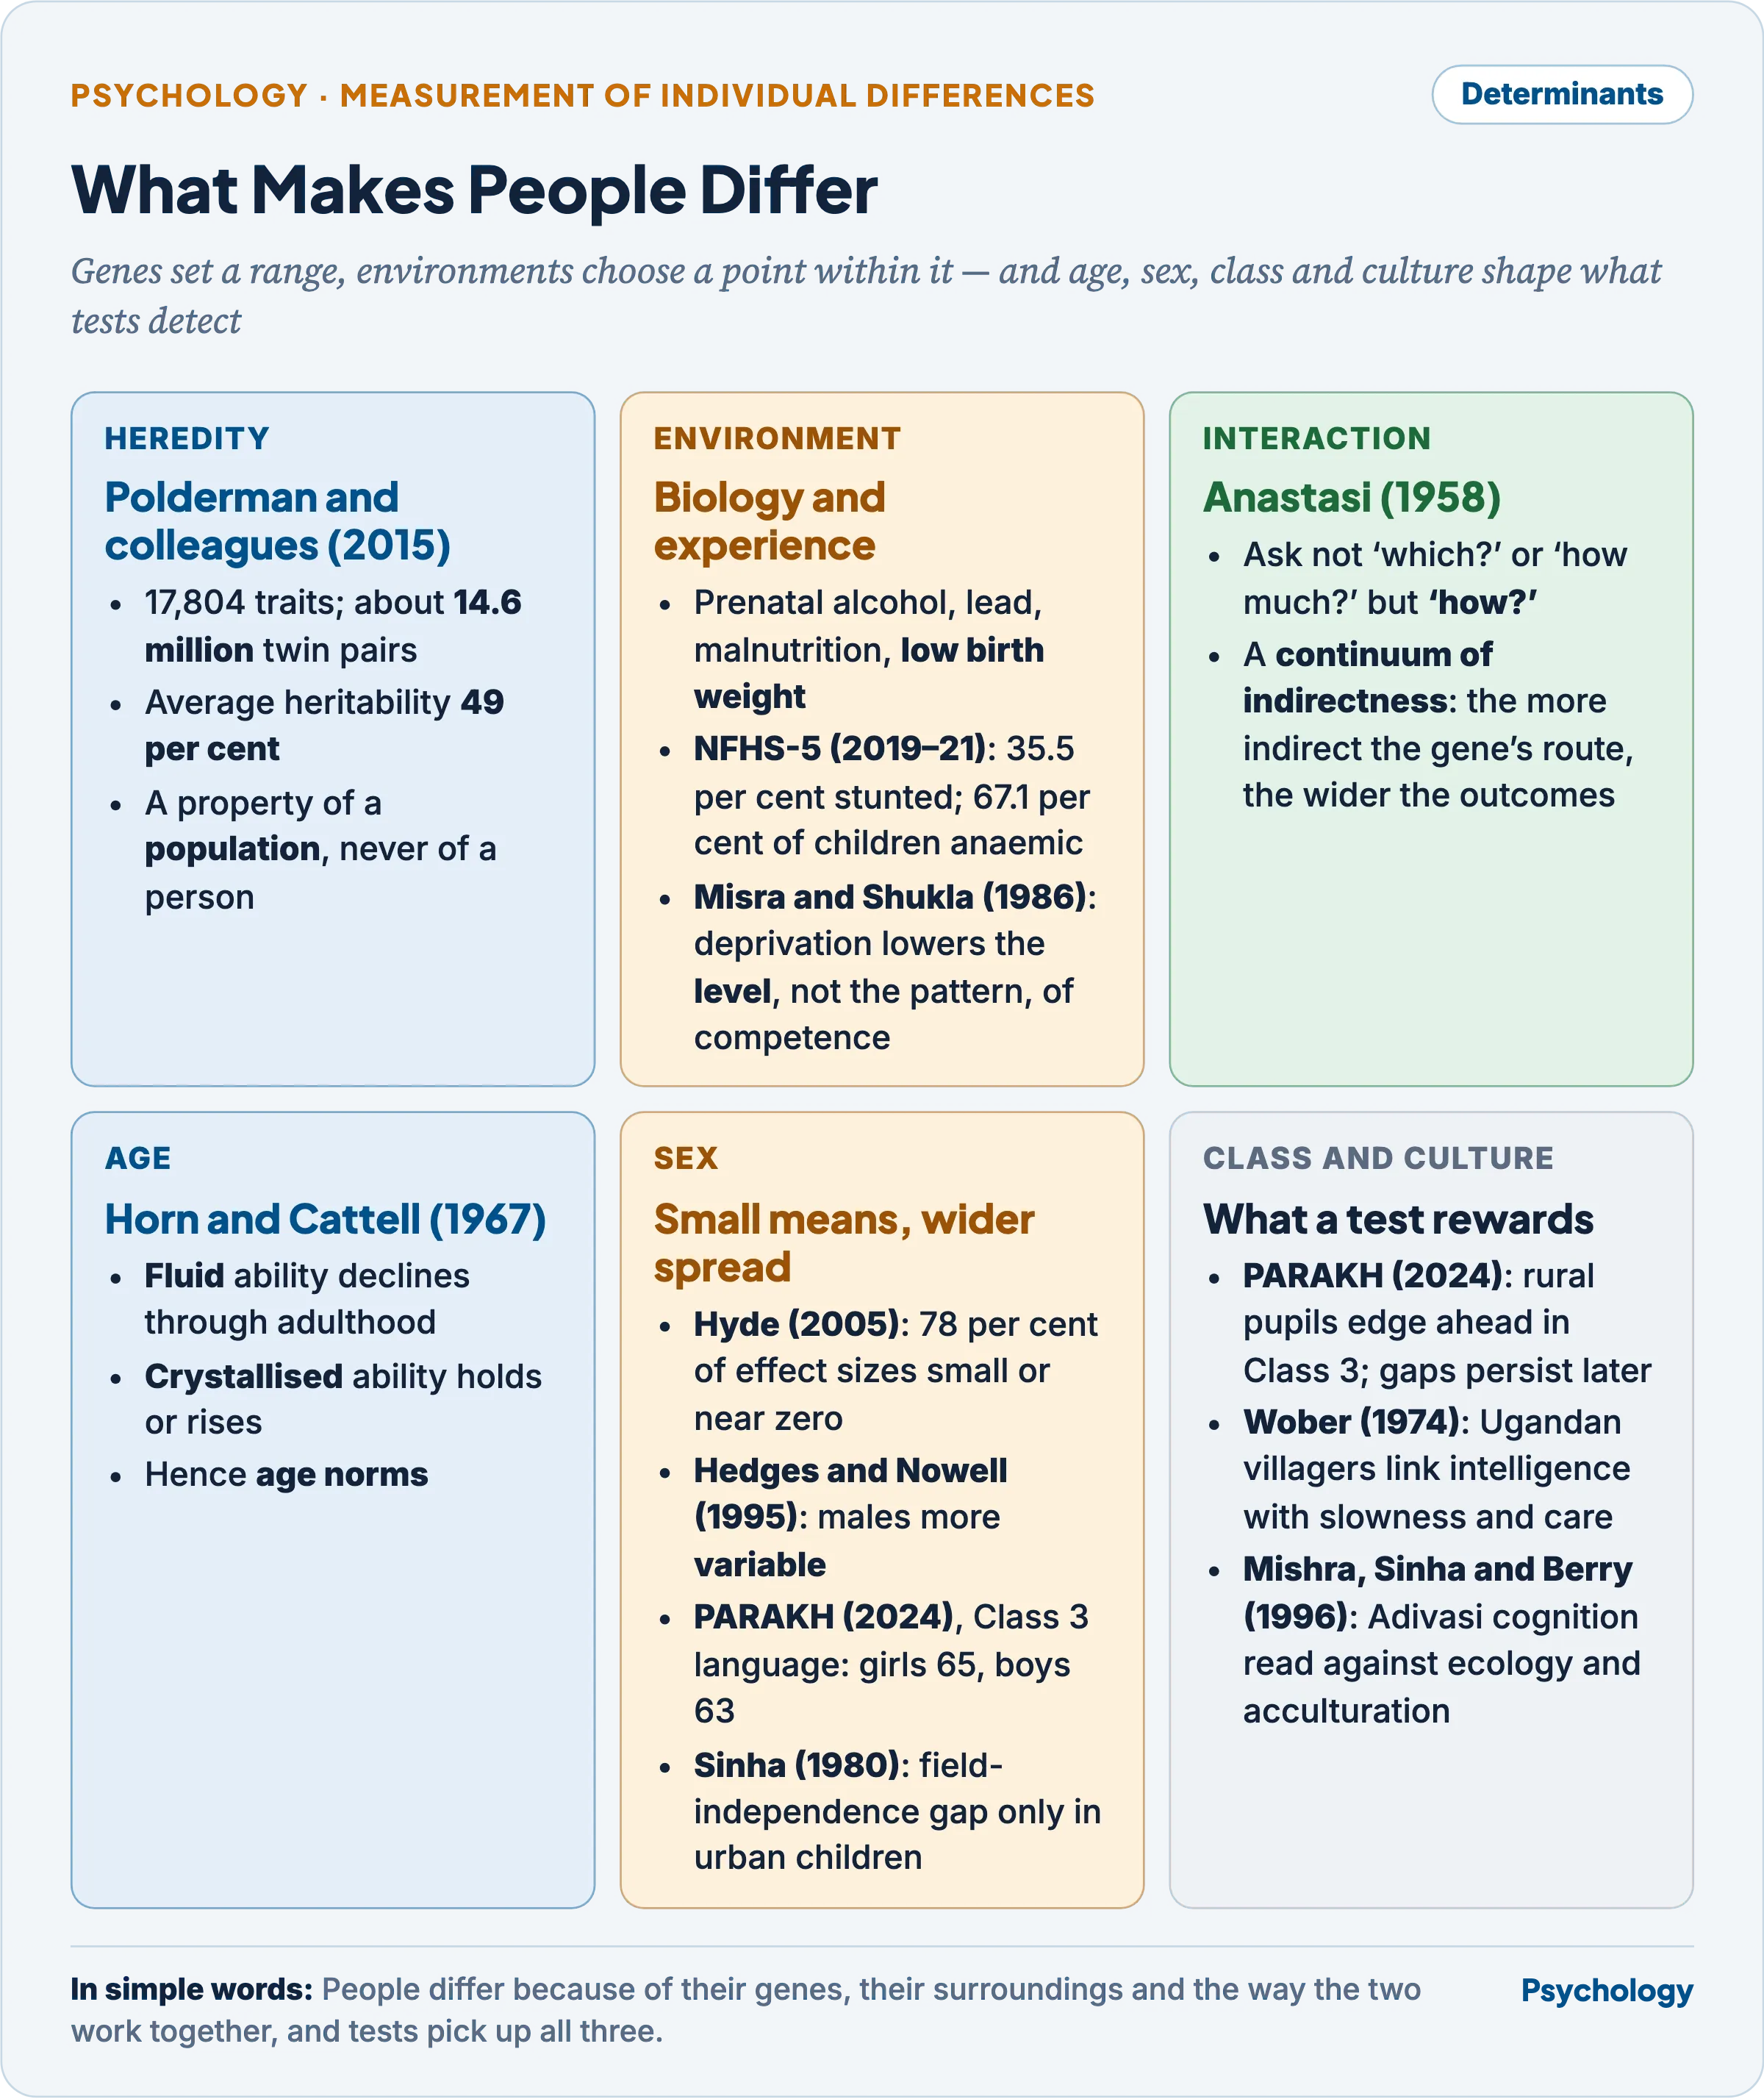
No determinant acts alone: nutrition alters what genes can express, and culture decides which abilities a test rewards.
- Heredity. Polderman and colleagues (2015) meta-analysed 17,804 traits from twin studies of about 14.6 million pairs: average heritability 49 per cent. It describes a population, not a person; the designs are in Heredity, Environment and Their Interaction (Paper I).
- Biological environment. Prenatal alcohol, lead, maternal malnutrition and low birth weight lower later ability. NFHS-5 (2019–21) found 35.5 per cent of Indian under-fives stunted and 67.1 per cent of children aged 6–59 months anaemic.
- Experiential environment. Misra and Shukla (1986) compared Indian children high and low on experiential deprivation at successive ages in early childhood.
- The low-deprived represented spatial information better at every age, and the gap was largest among the youngest.
- Deprivation lowered the level of competence but not its pattern, so a global “deficit” label misdescribes such children.
- Interaction. Anastasi (1958) placed hereditary influences on a “continuum of indirectness”: the more indirect the route from gene to behaviour, the wider the possible outcomes.
- Age. Horn and Cattell (1967) found fluid ability declining through adulthood while crystallised ability held or rose, so age norms are indispensable.
- Sex. Means differ little (Hyde, 2005), but Hedges and Nowell (1995), using six national probability samples, found male scores more variable on most tests, which multiplies sex ratios at the extremes.
- PARAKH Rashtriya Sarvekshan (2024): Class 3 girls scored 65 per cent in language against boys’ 63; both scored 60 in mathematics.
- Sinha (1980) found sex differences in field independence small among Birhor and Oraon communities and significant only among urban schoolchildren — a product of socialisation.
- Socio-economic status and place. In the same survey (PARAKH, 2024), rural children edged ahead in Class 3; rural–urban gaps persisted in Classes 6 and 9.
- Culture. Wober (1974) found Baganda villagers linking intelligence (obugezi) with slowness and care, less so among teachers and urban elites.
- Mishra, Sinha and Berry (1996) related cognitive performance among three Adivasi groups of Chotanagpur, from nomadic Birhor to agricultural Oraon, to ecology and acculturation; Mishra (1998) argued that ignoring such context turns difference into “deficit”.
- Anastasi and Urbina (1997) hold that every test tends to favour people from the culture that produced it.
Psychological tests as tools for assessing individual differences
Definition
“A psychological test is essentially an objective and standardized measure of a sample of behavior.”
Anastasi (1976)
Why tests are better than observation, interview, ratings and self-description
| Method | Objectivity | Standardisation | Quantification and norms | Characteristic error |
|---|---|---|---|---|
| Observation | Depends on the observer | Situation varies | Counts possible, rarely normed | Observer bias, reactivity, small sample of behaviour |
| Unstructured interview | Depends on the interviewer | Questions vary | An impression, not a score | First impressions, halo, low agreement |
| Ratings | Depends on the rater | Common scale, private frame | Numbers without units | Halo, leniency, central tendency |
| Self-description | Self as judge | Free form | None | Social desirability, limited insight |
| Standardised test | Fixed scoring key | Same items, instructions and time | Scores referred to norms | Measurement error, estimated and reported |
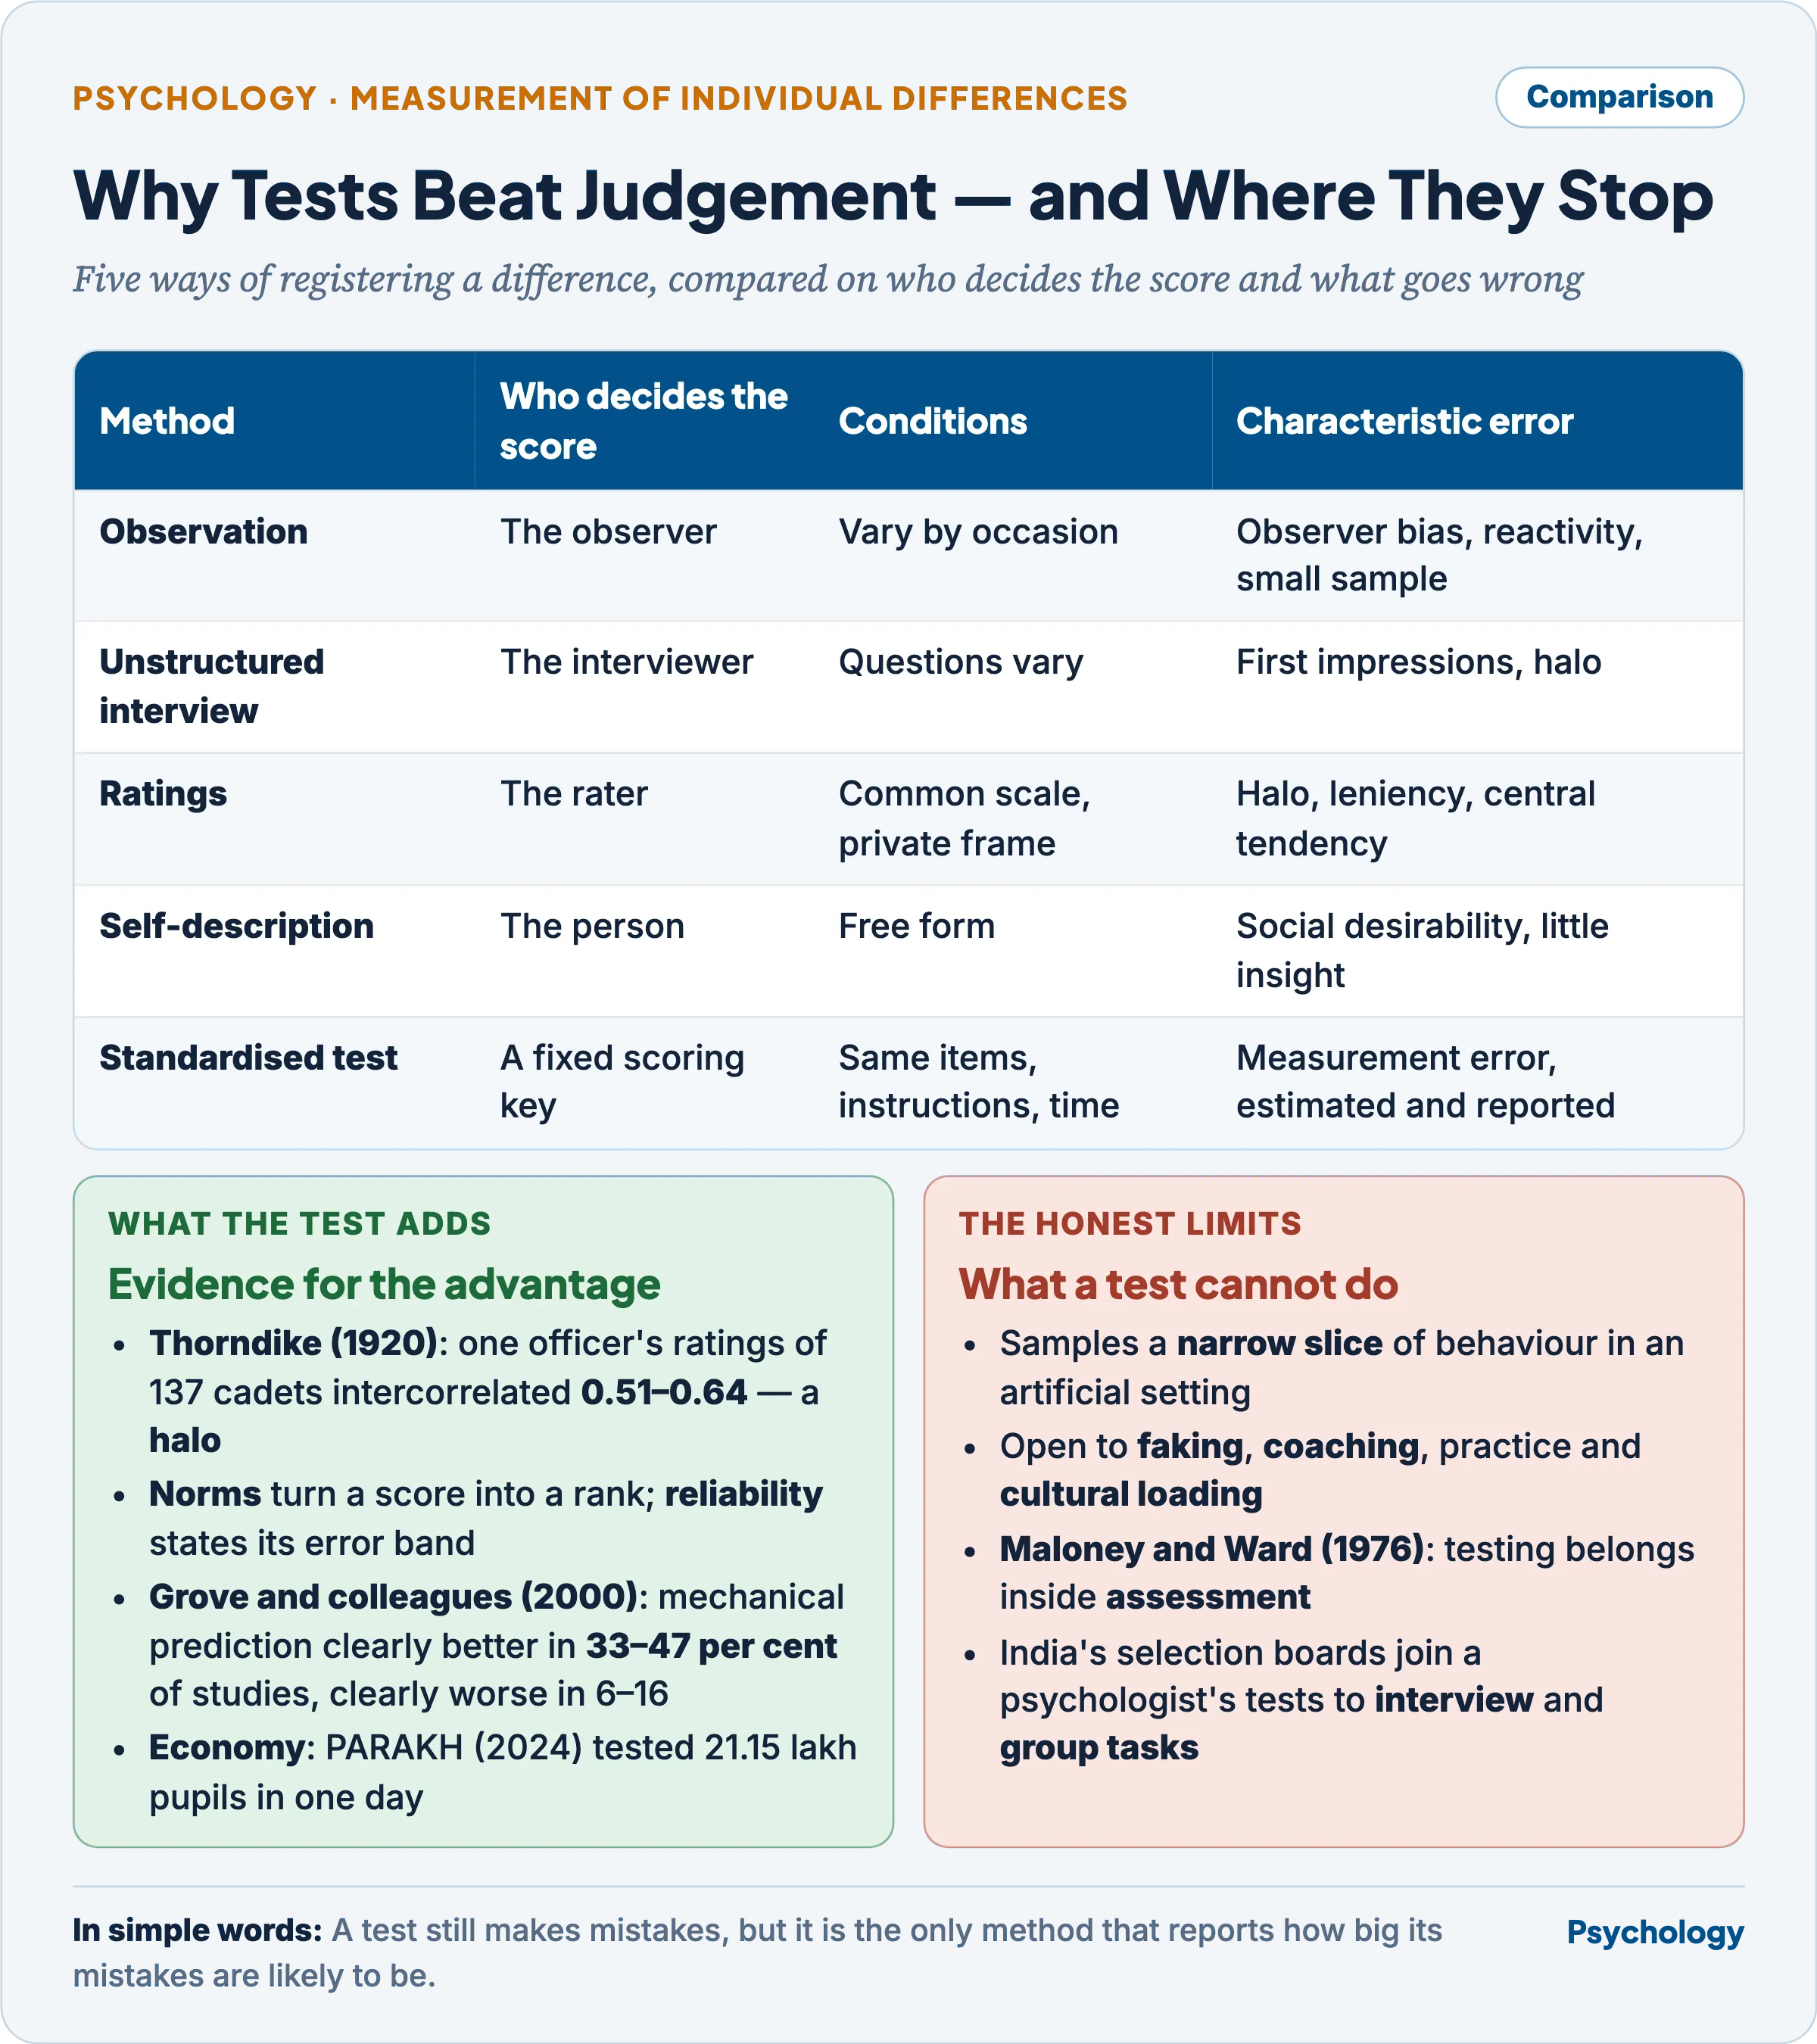
The test does not abolish error; it is the one method that states the size of its own.
- Objectivity. Thorndike (1920) named the halo effect.
- One officer’s intelligence ratings of 137 aviation cadets correlated 0.51 to 0.64 with his ratings of their physique, leadership and character — “too high and too even”.
- Pooled ratings of teachers on different qualities intercorrelated near 0.8 to 0.95, while an intelligence test correlated no more than 0.3 with them.
- Standardisation. Every examinee meets the same sample of behaviour under the same conditions, so a difference in score belongs to the person, not the occasion.
- Quantification. Thorndike (1918): “Whatever exists at all exists in some amount. To know it thoroughly involves knowing its quantity as well as its quality.” A score registers degree, and a depression score communicates what “the patient seems better” cannot.
- Norms. A score acquires meaning as a rank in a defined population, set out in Test Norms and Norm-Referenced Measurement.
- Known error. Only a test reports its reliability and standard error of measurement, stating the band within which a true score lies; see Reliability of Psychological Tests and Validity of Psychological Tests.
- Economy. Group tests reach millions: the Army programme of 1917–18, and the PARAKH Rashtriya Sarvekshan (2024), which tested 21.15 lakh children in 74,229 schools on one day.
- Prediction. After Meehl (1954), Grove and colleagues (2000) found mechanical combination of data about 10 per cent more accurate, clearly better in 33–47 per cent of studies and clearly worse in 6–16 per cent; clinical judgement fared worst when it drew on interviews.
- The honest limits. A test samples a narrow slice of behaviour in an artificial setting, misses context, and is open to faking, coaching and cultural loading. Maloney and Ward (1976) placed testing inside assessment, which adds interview, history and observation — as India’s selection boards do.
Uses of psychological tests in assessing individual differences
- Selection — officer selection boards combine a psychologist’s tests with interview and group tasks (Indian context).
- Diagnosis and certification — intellectual disability is certified in India from an adaptive-behaviour scale and an IQ test.
- Classification and guidance — an aptitude profile such as Tamanna’s informs the choice of stream.
- Research and programme evaluation — national surveys locate learning gaps by grade, region and school type.
- Self-understanding — feedback on one’s own profile. How each use goes wrong is treated in Use, Misuse and Limitations of Psychological Tests; the kinds of test in Types of Psychological Tests.
Importance of individual differences for vocational guidance
- If people differ stably and occupations differ in their demands, the two can be matched. Parsons (1909) stated the premise in Choosing a Vocation:
- “(1) a clear understanding of yourself, your aptitudes, abilities, interests, ambitions, resources, limitations, and their causes; (2) a knowledge of the requirements and conditions of success … in different lines of work; (3) true reasoning on the relations of these two groups of facts.”
- Williamson (1939) turned this into the trait-and-factor model at Minnesota, in six steps: analysis, synthesis, diagnosis, prognosis, counselling and follow-up. Tests made Parsons’ first factor measurable; the instruments are in Aptitude and Its Measurement and Interests: Nature, Structure and Measurement (Paper I).
- The evidence supports matching, modestly. Mean congruence–satisfaction correlations were 0.21 across 41 studies (Assouline and Meir, 1987) and similarly modest across 53 samples (Tsabari, Tziner and Meir, 2005); congruence predicted performance more strongly, about 0.36 (Nye, Su, Rounds and Drasgow, 2012).
- The criticisms target the matching picture itself: a one-off snapshot, where Super (1953) showed vocational choice develops across the life span; “test ’em and tell ’em” counselling; and a presumption of free choice where family and income constrain it.
- Tamanna — Try And Measure Aptitude And Natural Abilities (NCERT, then under the Ministry of Human Resource Development, 2019; piloted by CBSE) — a voluntary seven-aptitude test for Classes 9 and 10, normed on 5,491 students. It operationalises Parsons’ first factor, self-knowledge, at stream choice.
- National Career Service (Ministry of Labour and Employment, 2015) — portal and career centres offering counselling, psychometric assessment and occupational information: Parsons’ second and third factors, knowledge of work and reasoned matching, at national scale.
Methodological issues in constructing tests of individual differences
- Defining the construct. A test needs a conceptual definition before an operational one. Messick (1995) named the two resulting threats: construct under-representation (too narrow) and construct-irrelevant variance (too broad), as when heavy reading load depresses a mathematics score.
- Sampling behaviour and persons. Items must sample the domain, and norms must sample the population. Kamat (1934) faulted Rice (1929), whose Hindustani adaptation had been standardised on 1,070 boys aged 5 to 16 — no girls and no young children.
- Quantifying. Binet and Simon (1905) conceded their scale was “a classification, a hierarchy among diverse intelligences” rather than a measure, since intellectual qualities “are not superposable”; whether trait scores have equal units remains open.
- Response sets. Self-reports are bent by social desirability (Edwards, 1957), acquiescence and faking, which create differences unrelated to the trait.
- Translation and bias. Van de Vijver and Tanzer (1997) distinguished construct, method and item bias.
- The ITC Guidelines (2017) set 18 standards for adaptation, yet Rios and Sireci (2014) found most published adaptations did not follow them — acute where a national survey runs in 23 media of instruction (PARAKH, 2024).
- Reliability as the test of reality. A reliability coefficient is the share of observed differences that is true-score difference; unreliable differences are not individual differences at all. The full procedure is in Construction and Standardization of Psychological Tests.
Criticisms and limitations
- The normal curve is partly made, not found. Micceri (1989) examined 440 large-sample achievement and psychometric distributions and found every one significantly non-normal. Test builders often select items that yield a bell.
- Measurement may be assumed rather than shown. Michell (2000) argued that the hypothesis that psychological attributes are quantitative “has never been critically tested”, and concluded “that psychometrics is a pathology of science”.
- Between-person structure is not within-person structure. Molenaar (2004) showed that a structure found across people generalises to processes within one person only under conditions rarely met, reviving the idiographic case of Allport (1937).
- Group differences invite misuse. Brigham (1923) and Rice (1929), who compared caste groups in the Punjab, read test gaps as innate rank; Setlur (2014) traced Indian psychometry’s move from reading caste as race to reading it as heredity.
- Western norms travel badly. Imported tests carry their culture’s content and pace, and Indian group gaps read as deficits when ecology and schooling are ignored (Mishra, 1998).
- Differences are over-claimed. Popular claims of large sex differences outrun the data (Hyde, 2005), and heritability is routinely misread as fixity — the error dissected in Heredity, Environment and Their Interaction (Paper I).
Indian context: the present status of psychological testing in India
- Early adaptations. Rice (1929) produced the Hindustani Binet-Performance Point Scale in Lahore; Kamat (1934) revised the Stanford-Binet for Kannada- and Marathi-speaking children of Dharwar, Indianising items — the difference between a patil and a kulkarni replaced that between a president and a king.
- Bhatia (1955) built a battery of performance tests with separate scoring for literate and illiterate examinees; Malin (1969) adapted the Wechsler as MISIC, never updated since — an ageing-norm problem.
- Defence Institute of Psychological Research (DRDO) — began as an Experimental Board at Dehradun (1943), became the Psychological Research Wing (1949) and the Directorate of Psychological Research (1962), and took its present name in 1982. It standardises the tools of the Services Selection Boards.
- At each board an interviewing officer, a group testing officer and a psychologist assess independently and then confer; the psychologist uses the TAT, word association, situation reaction and self-description tests.
- Rehabilitation Council of India Act, 1992 (Ministry of Social Justice and Empowerment) — lists clinical psychologists as rehabilitation professionals and, under section 13, bars anyone off the Central Rehabilitation Register from practising or signing statutory certificates. It operationalises user competence as a legal condition.
- NCAHP Act, 2021 (National Commission for Allied and Healthcare Professions; Ministry of Health and Family Welfare) — registers psychologists other than clinical psychologists as behavioural health professionals, so non-clinical test users gain a regulator.
- Guidelines for assessing specified disabilities (Department of Empowerment of Persons with Disabilities, 2018, under the RPwD Act 2016; revised 2024) — certify intellectual disability from the Vineland Social Maturity Scale and an IQ test such as Binet-Kamat or MISIC: an entitlement resting on a normed difference.
- NEP 2020 (Ministry of Education) — moves assessment from rote recall to competencies, adds a 360-degree holistic progress card, and proposes PARAKH, set up in NCERT in 2023, as the national standard-setter, with a common aptitude test through the National Testing Agency.
- PARAKH Rashtriya Sarvekshan (2024) — tested 21.15 lakh pupils in Classes 3, 6 and 9 across 781 districts on 4 December 2024. Class 3 averaged 60 per cent in mathematics, and Classes 6 and 9 showed persistent gaps, chiefly in mathematics and science.
- The status, judged. Testing is institutionalised in defence selection, disability law and national assessment. Its weaknesses are adapted rather than indigenous tests, ageing norms, equivalence across scheduled languages, and regulation only recently extended beyond clinicians.
Previous Year Questions
- 2026What do you understand by Individual Differences? Comment on the major methodological issues in construction of tests for assessment.
- 2020In what ways psychological tests are better tools in assessing individual differences? Explain.
- 2017Explain how the concept of individual differences emerged and state its importance for vocational guidance.
- 2016In what ways psychological tests are useful in assessing individual differences? Answer with examples.
- 2002Elucidate the nature of individual differences. Describe the methods of validity and reliability.
- 1997Comment on: Briefly describe the origin of the measurement of individual differences and comment on the present status of psychological testing in India.